Loading patterns...
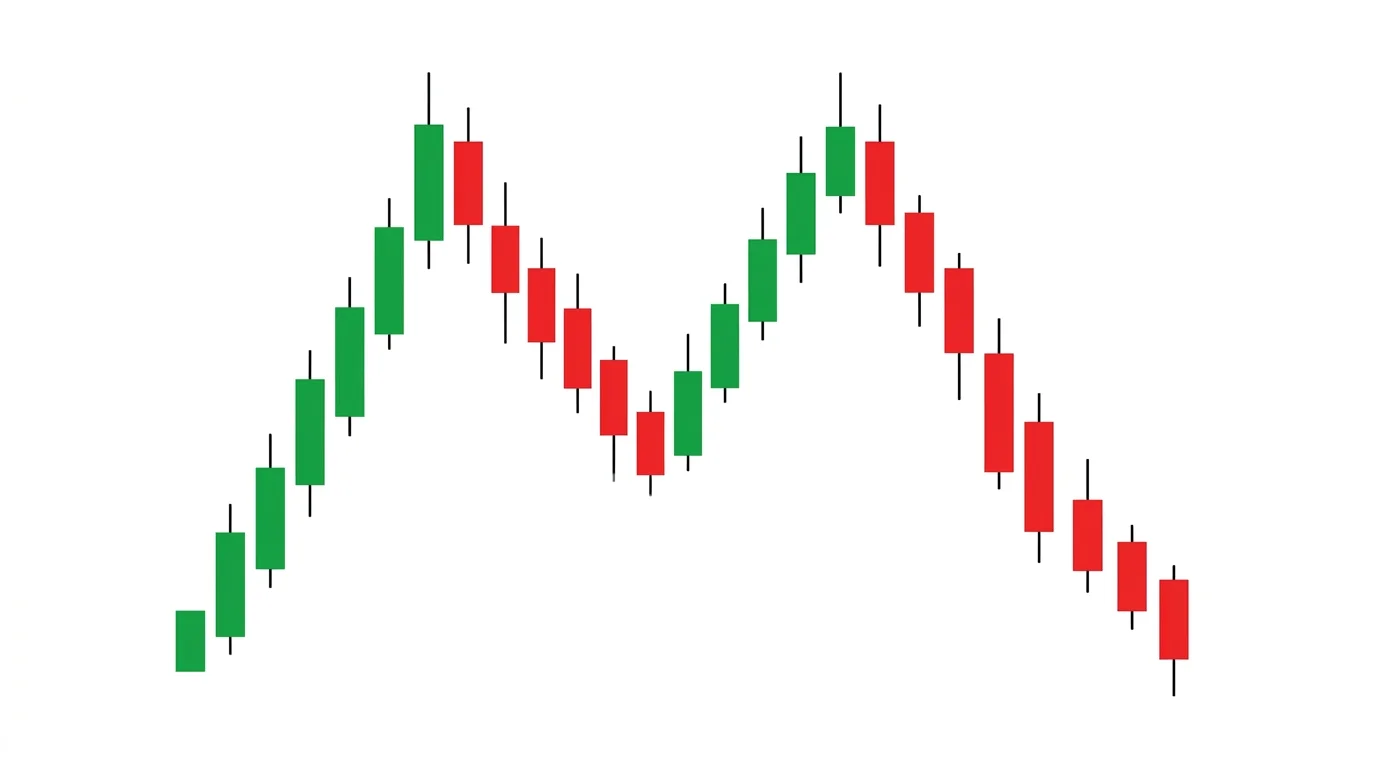
Chart Formations
Geometric price patterns including triangles, wedges, head & shoulders, and double tops/bottoms.
Patterns coming soon
Chart formations are geometric patterns that emerge over multiple candles as price creates recognizable shapes. Unlike candlestick patterns that focus on individual candle shapes, chart formations look at the broader structure of price movement. Head and Shoulders, Double Tops/Bottoms, Triangles, Wedges, and Channels are among the most powerful patterns in technical analysis. They provide clear breakout/breakdown levels, measurable targets, and well-defined invalidation points — making them essential for any serious trader's toolkit.
Showing 0 of 0 patterns
Patterns Coming Soon
We are building detailed data files for every pattern in the Chart Formations category. Check back soon.
Frequently Asked Questions
Candlestick patterns focus on the shape of individual candles (1-4 candles), while chart patterns look at the broader geometric structure formed by many candles over time (weeks or months). Chart patterns like Head & Shoulders or Triangles provide larger-scale trading signals.