Loading patterns...
Neutral Patterns
Indecision patterns that can break in either direction.
20 patterns
Indecision patterns that can break in either direction.
Showing 20 of 20 patterns
neutralindecision1 candle
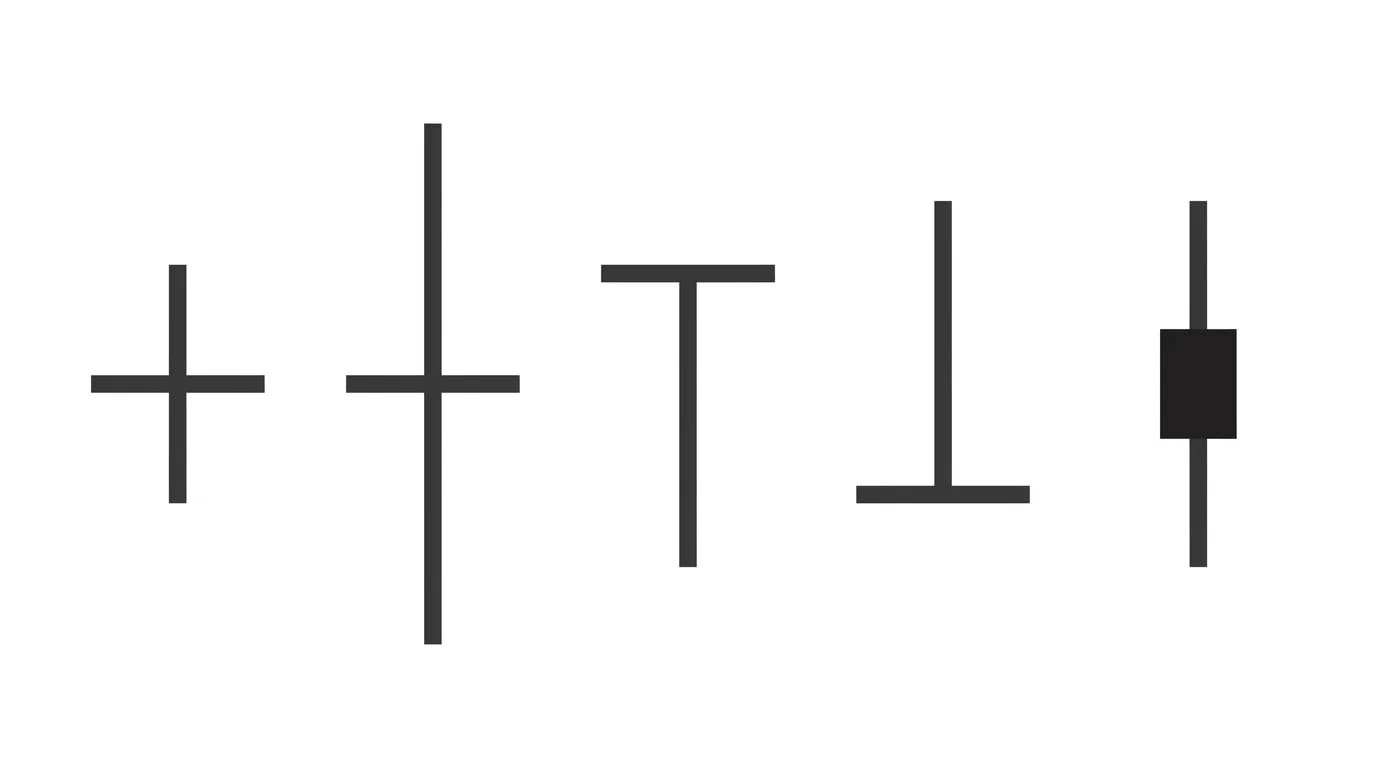
Doji
Doji (同事)
The Doji is the quintessential indecision candle where opening and closing prices are virtually identical, reflecting a perfect tug-of-war between buyers and sellers.
Diff
Rel
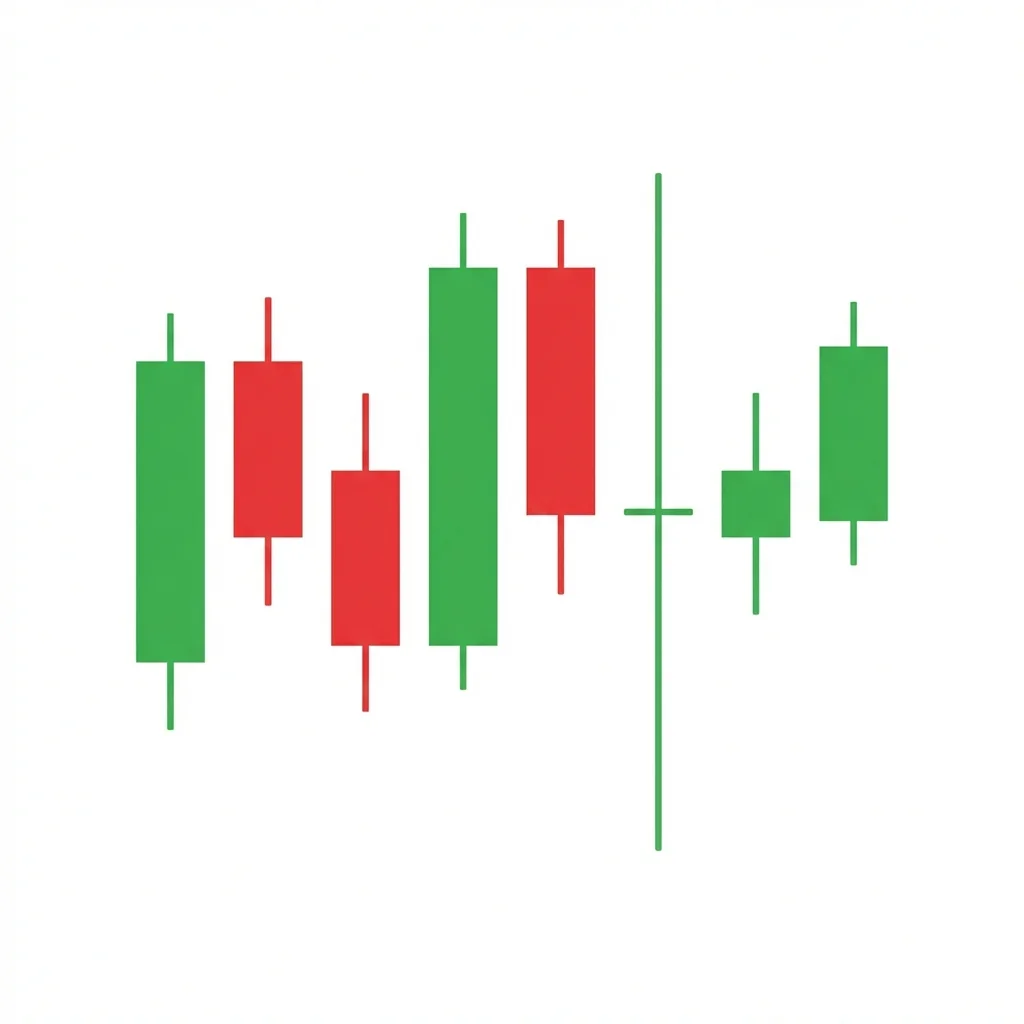
neutralindecision3 candles
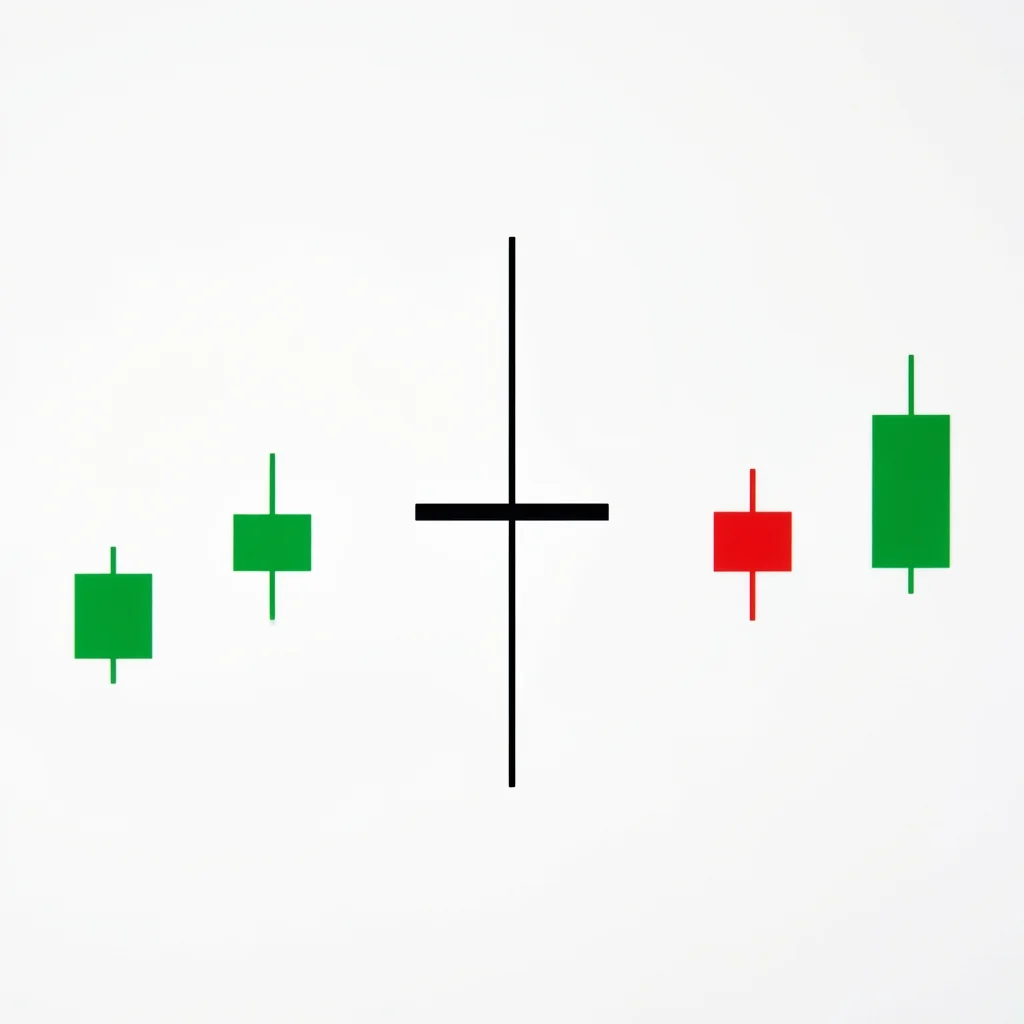
Doji Cluster
A Doji Cluster consists of two or more consecutive doji candles, indicating prolonged indecision and compressed volatility that typically precedes a significant breakout move.
Diff
Rel

neutralindecision1 candle
Four-Price Doji
The Four-Price Doji is the rarest doji variant where all four price points (open, high, low, close) are identical, appearing as a horizontal line and signaling complete market inactivity or perfect equilibrium.
Diff
Rel
neutralindecision1 candle
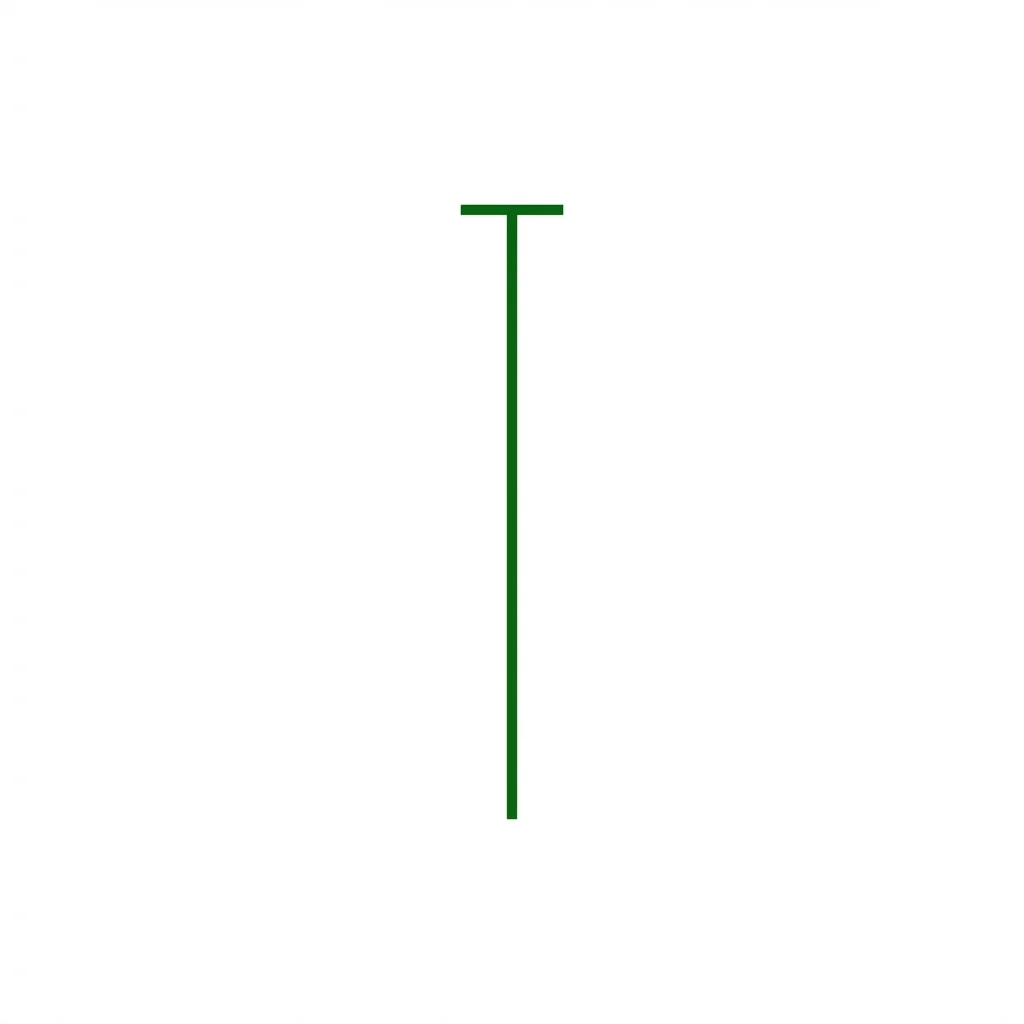
Hammer Doji
Tonbo (トンボ)
The Hammer Doji (Dragonfly Doji) features a long lower shadow with the open and close at the session high, showing that sellers drove price down sharply but buyers recovered all losses, creating a neutral signal that depends on context.
Diff
Rel
neutralindecision1 candle
High Wave
Takuri (たくり)
The High Wave candle features a small body with extremely long upper and lower shadows, signaling intense intraday volatility and extreme indecision that often precedes a significant directional move.
Diff
Rel
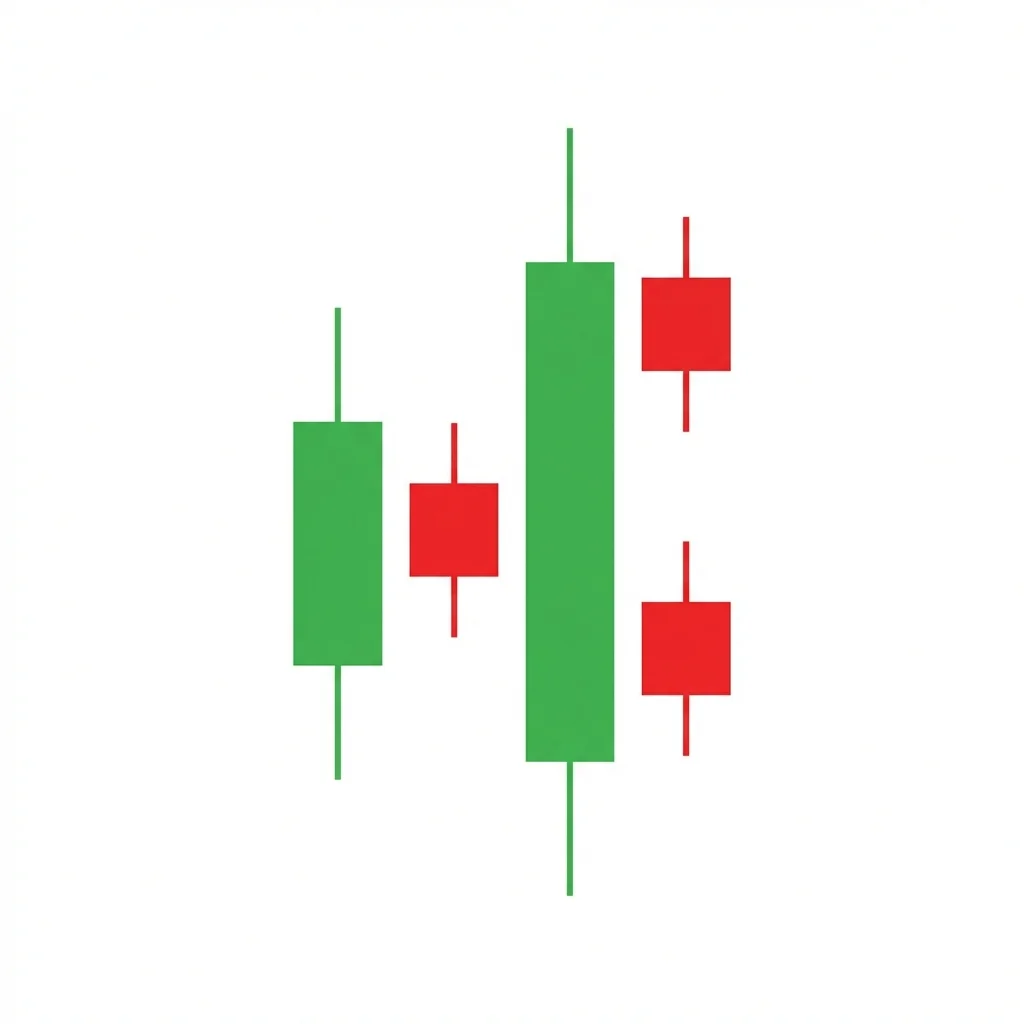
neutralindecision2 candles
Inside Bar
The Inside Bar is a two-candle pattern where the second candle's entire range is contained within the first candle, signaling a contraction in volatility and a pending breakout in either direction.
Diff
Rel
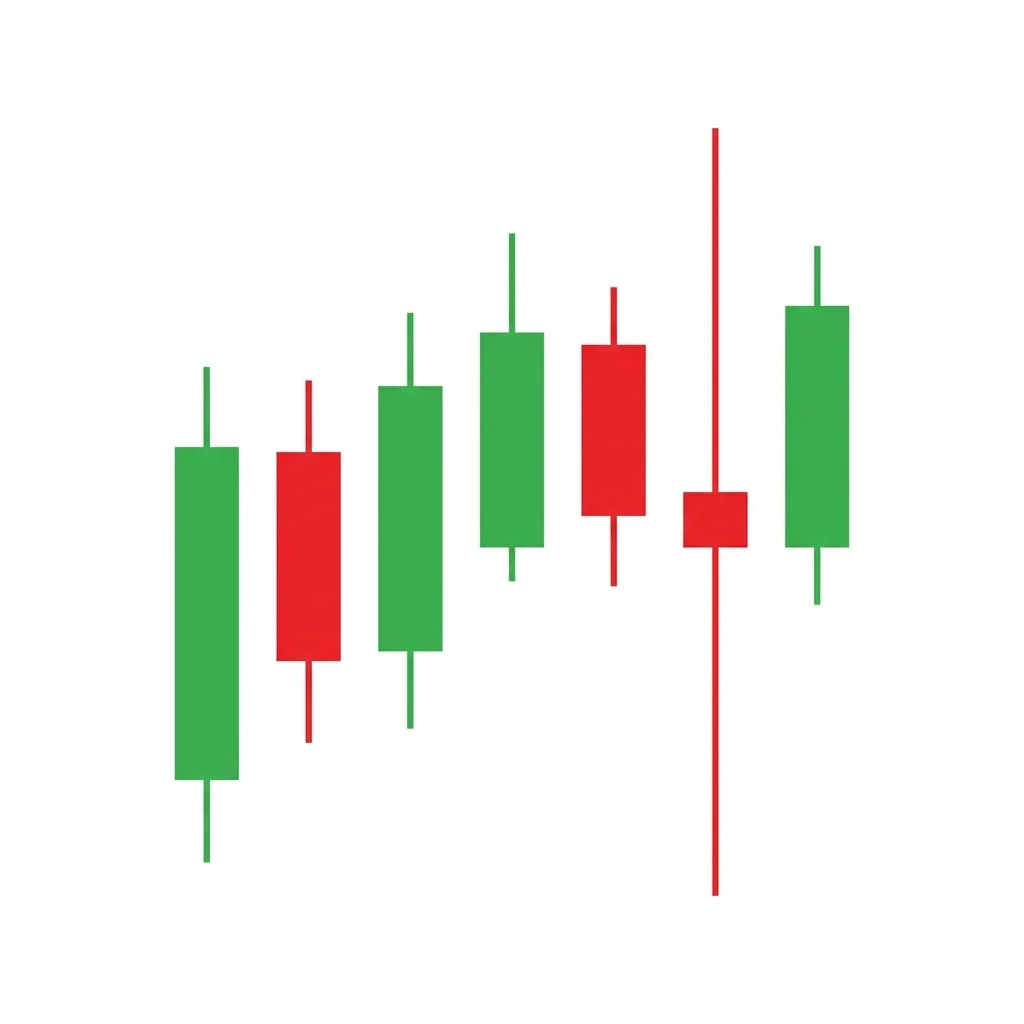
neutralindecision3 candles
Inside-Outside-Inside
The Inside-Outside-Inside (IOI) is a three-candle pattern where an inside bar is followed by an outside bar and then another inside bar, creating a compression-expansion-compression sequence that often precedes a significant breakout.
Diff
Rel
neutralindecision1 candle
Long-Legged Doji
Juji (十字)
The Long-Legged Doji features extremely long shadows in both directions with the open and close near the center, representing the most extreme form of single-candle indecision and a potent warning of momentum exhaustion.
Diff
Rel
neutralindecision1 candle
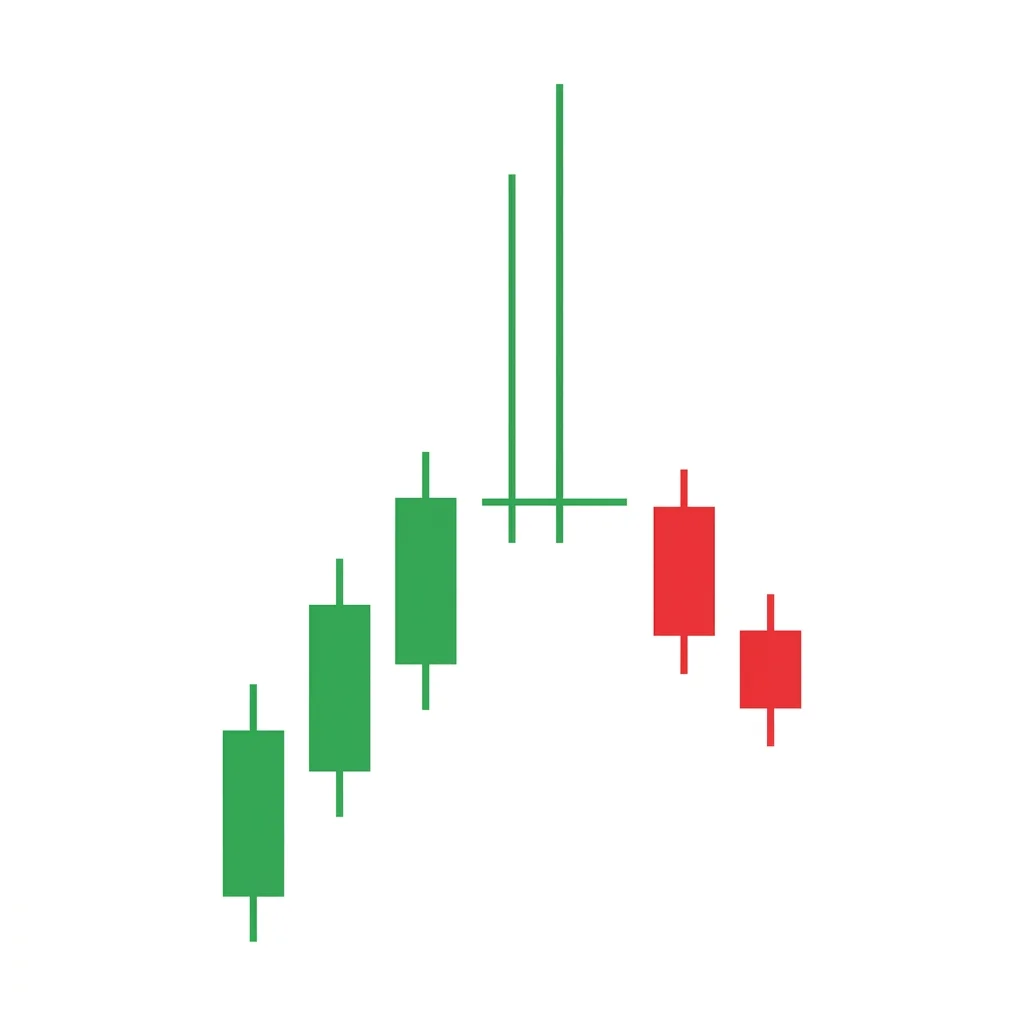
Northern Doji
The Northern Doji appears after an uptrend and signals that buying momentum may be exhausting. While it warns of potential reversal, it can also be a pause before continuation, making it a neutral alert rather than a directional signal.
Diff
Rel
neutralindecision1 candle
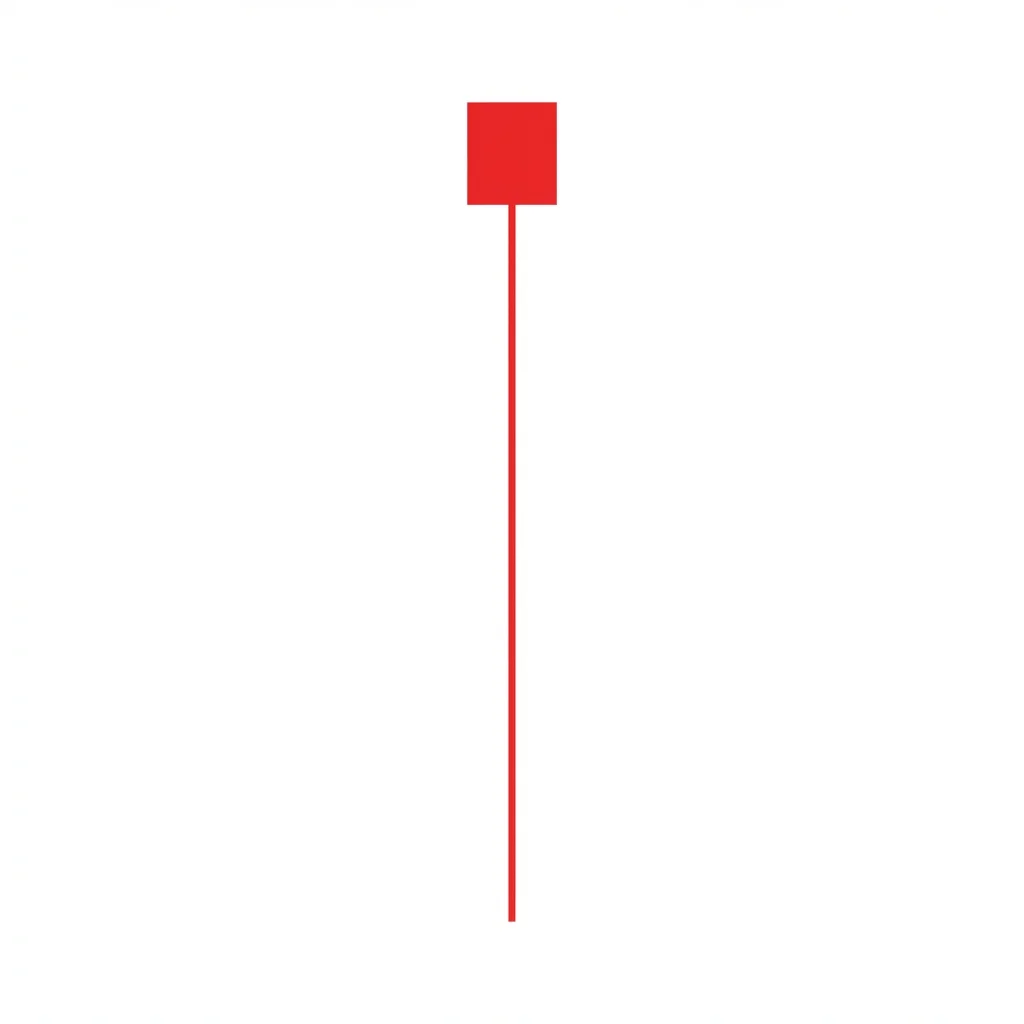
Paper Umbrella
Karakasa (唐傘)
The Paper Umbrella is a context-neutral candle with a small body at the top and a long lower shadow. It becomes a Hammer in downtrends (bullish) or a Hanging Man in uptrends (bearish), but without trend context it is a neutral indecision signal.
Diff
Rel
neutralindecision20 candles
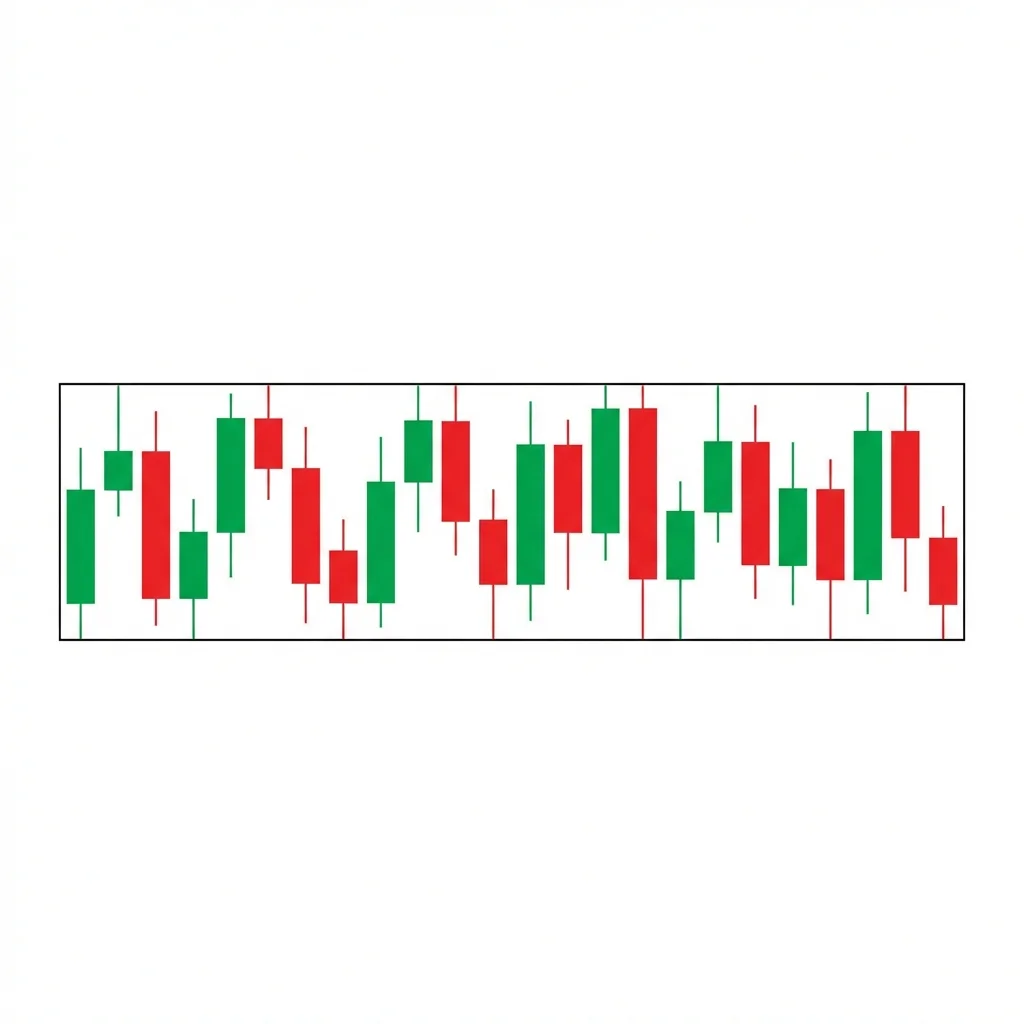
Rectangle
The Rectangle is a chart formation where price consolidates between parallel horizontal support and resistance levels, creating a box-like pattern that can break in either direction.
Diff
Rel
neutralindecision1 candle
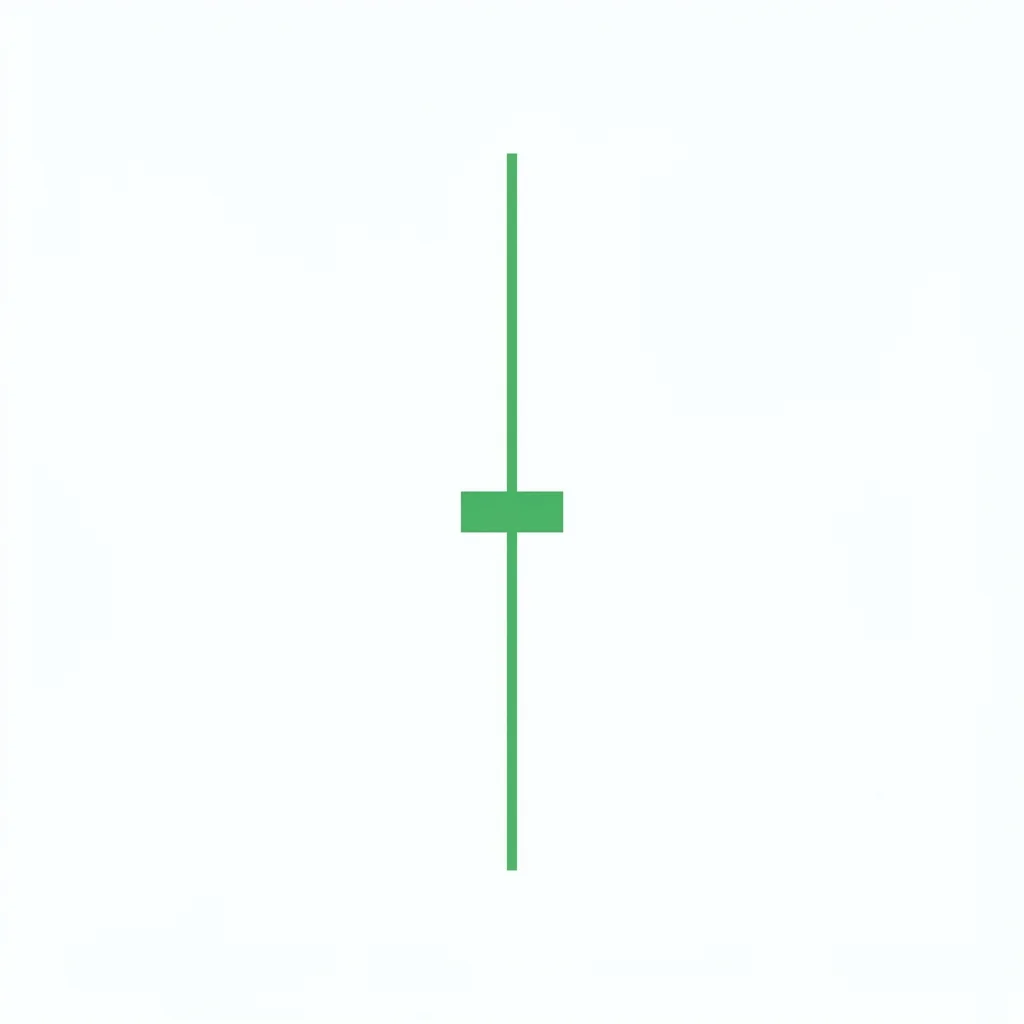
Rickshaw Man
Jinrikisha (人力車)
The Rickshaw Man is a specialized long-legged doji where the open and close are positioned exactly at the midpoint of the candle's range, representing the purest expression of market indecision with perfectly balanced shadows.
Diff
Rel
neutralindecision1 candle
Shooting Star Doji
Tohba (塔婆)
The Shooting Star Doji (Gravestone Doji) features a long upper shadow with the open and close at the session low, showing buyers drove prices up but sellers reversed all gains, creating a context-dependent signal that leans bearish in uptrends.
Diff
Rel
neutralindecision1 candle
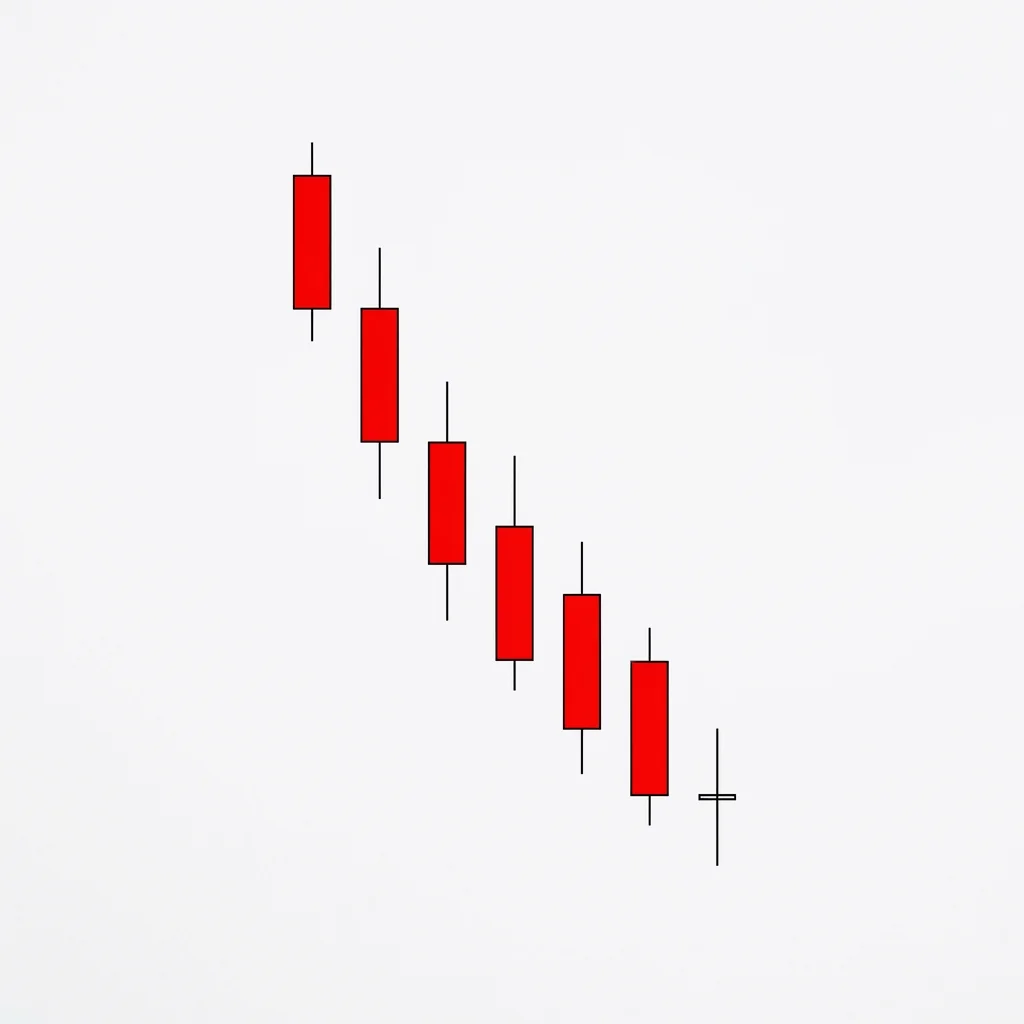
Southern Doji
The Southern Doji appears after a downtrend and signals that selling momentum may be exhausting. While it warns of potential reversal, it can also be a pause before continuation lower, making it a neutral alert requiring confirmation.
Diff
Rel
neutralindecision1 candle
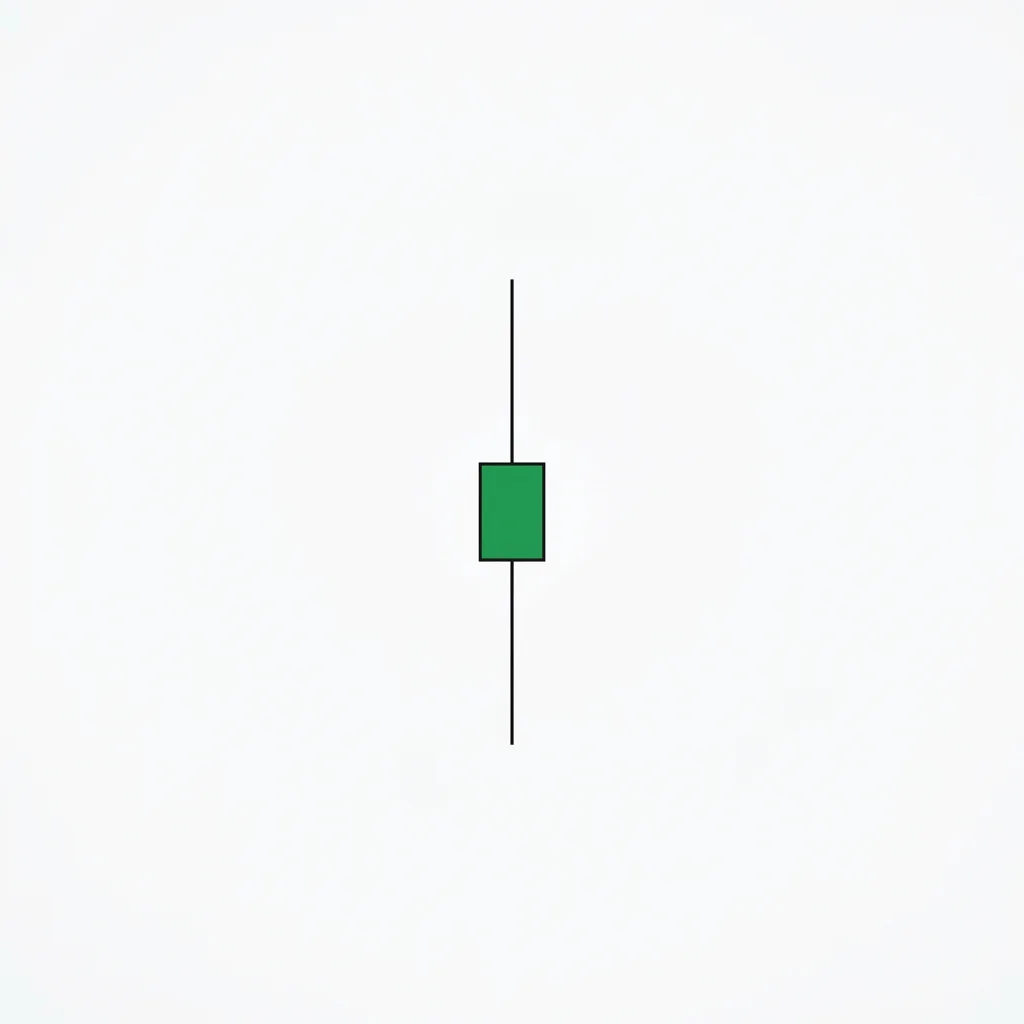
Spinning Top
Koma (独楽)
The Spinning Top is one of the most common candlestick patterns, featuring a small real body with shadows on both sides, indicating mild to moderate indecision where neither buyers nor sellers gained meaningful ground.
Diff
Rel
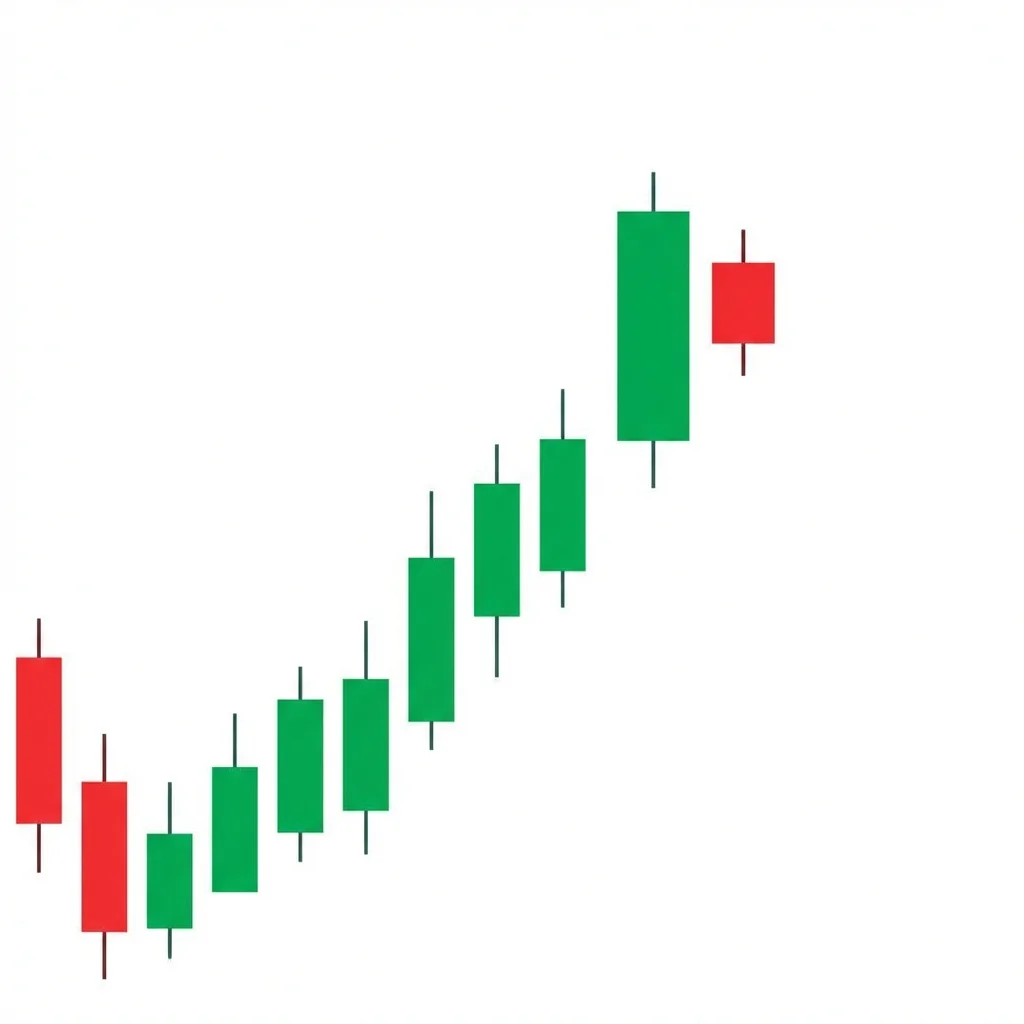
neutralindecision15 candles
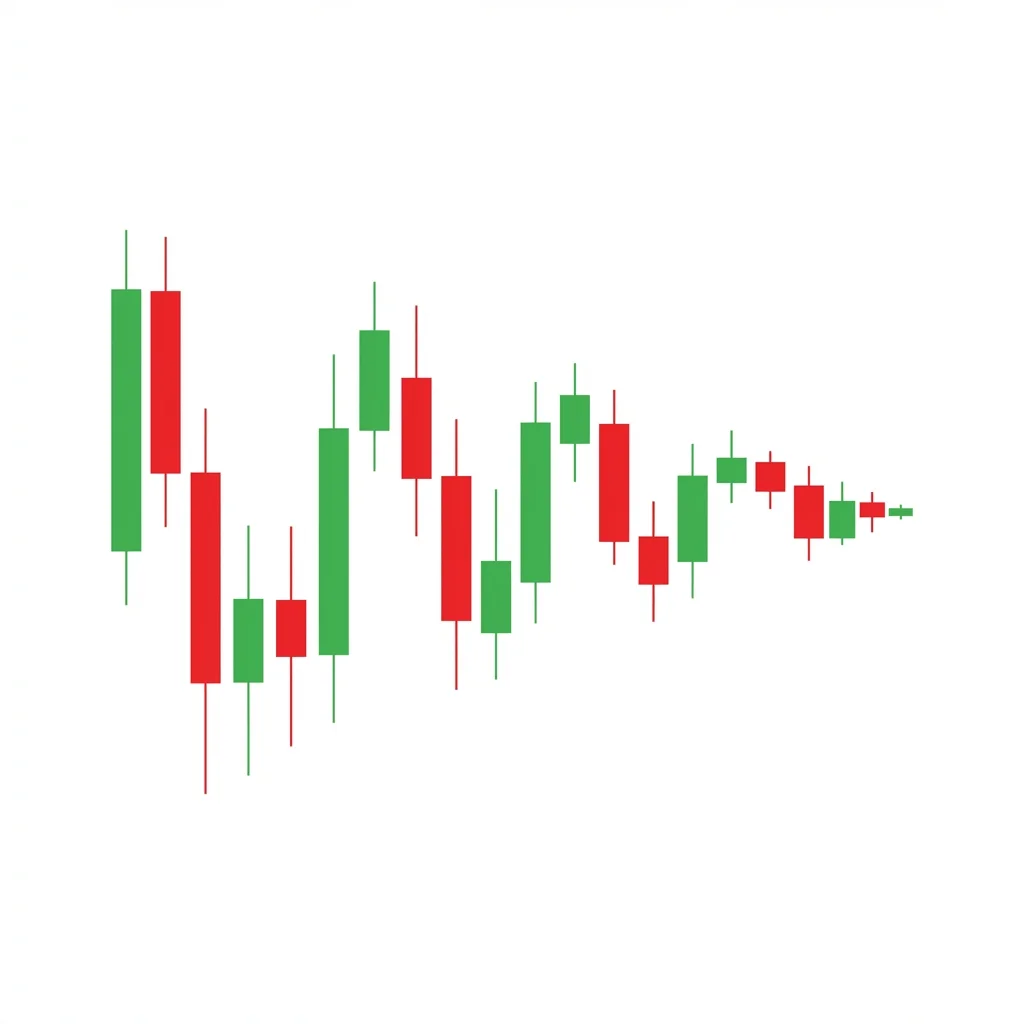
Squeeze Breakout
The Squeeze Breakout occurs when volatility compresses to extreme levels (tight Bollinger Bands or low ATR) before an explosive directional move, representing the market's transition from consolidation to trending.
Diff
Rel
neutralindecision20 candles
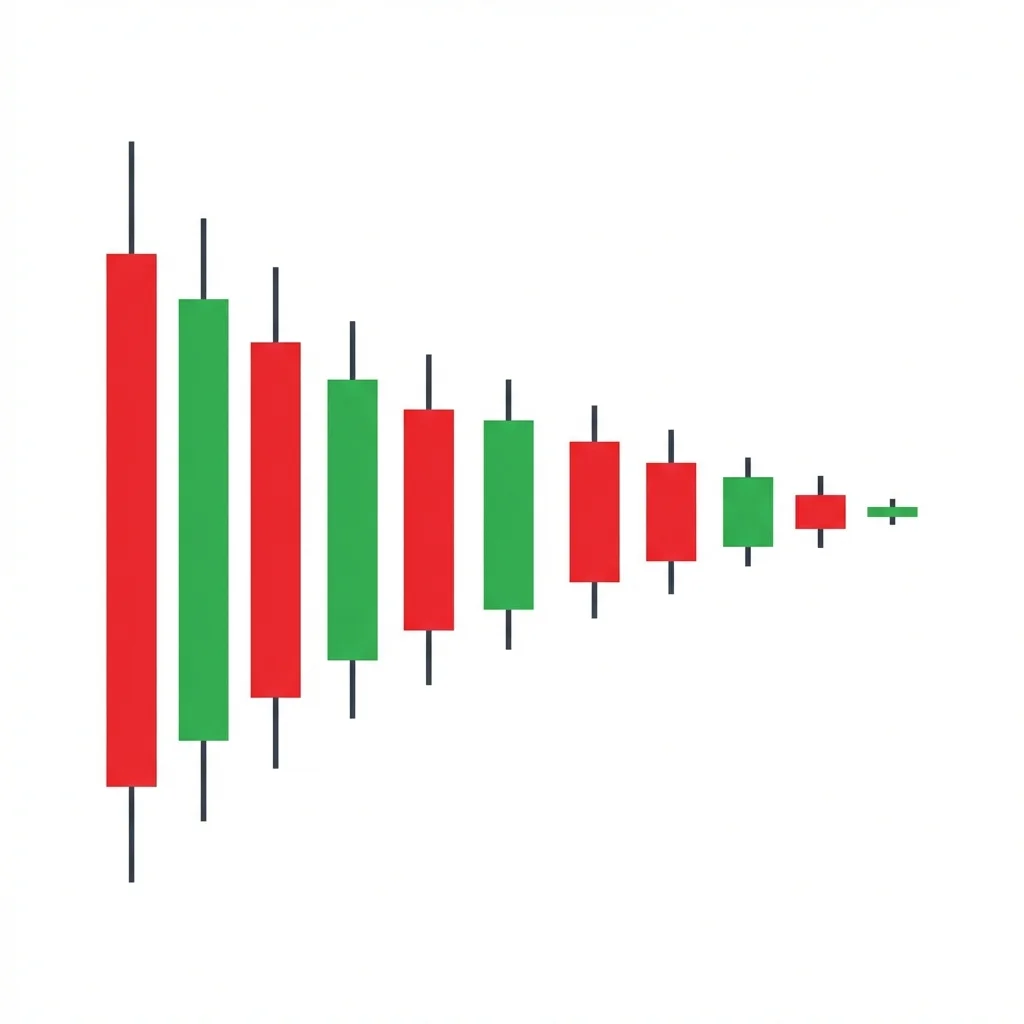
Symmetrical Triangle
The Symmetrical Triangle is a chart formation where converging trendlines of roughly equal slope create a coiling pattern, indicating a period of equilibrium that will resolve with an explosive breakout in either direction.
Diff
Rel
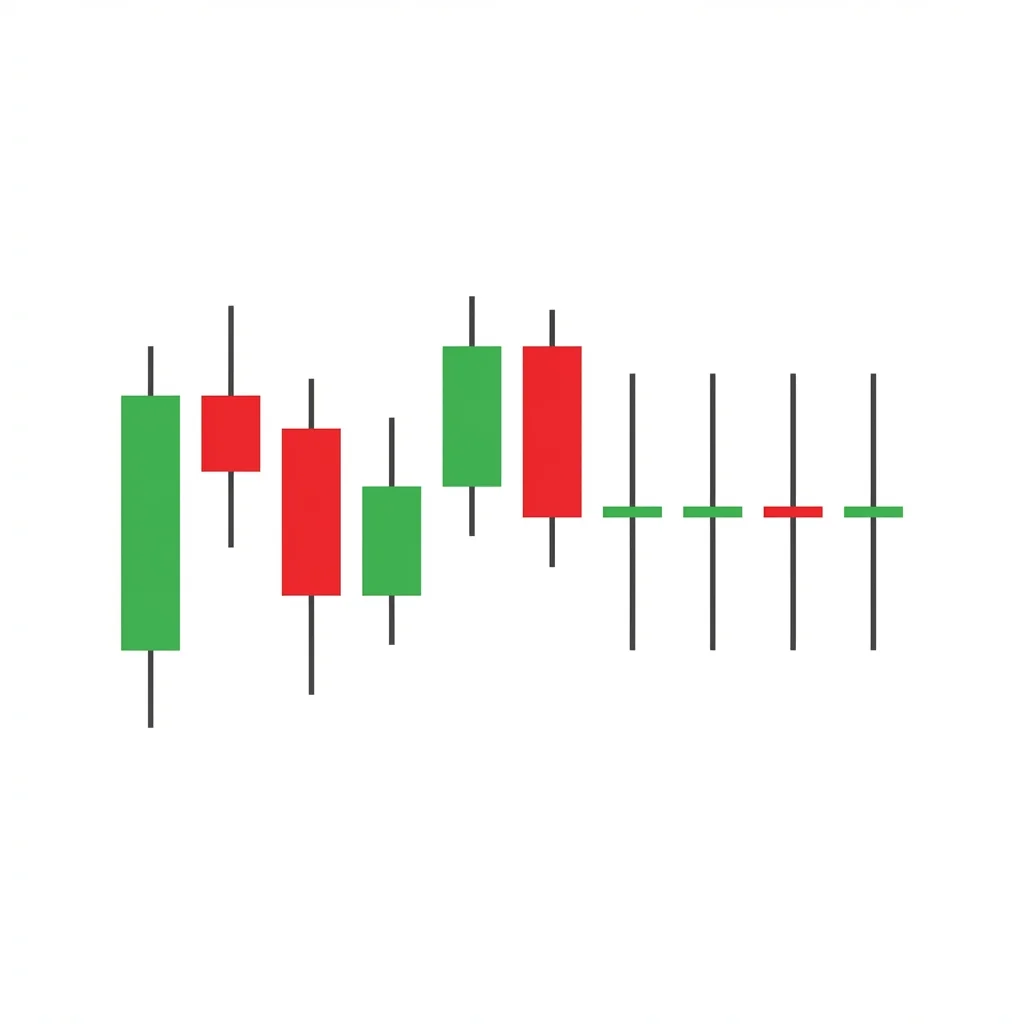
neutralindecision5 candles
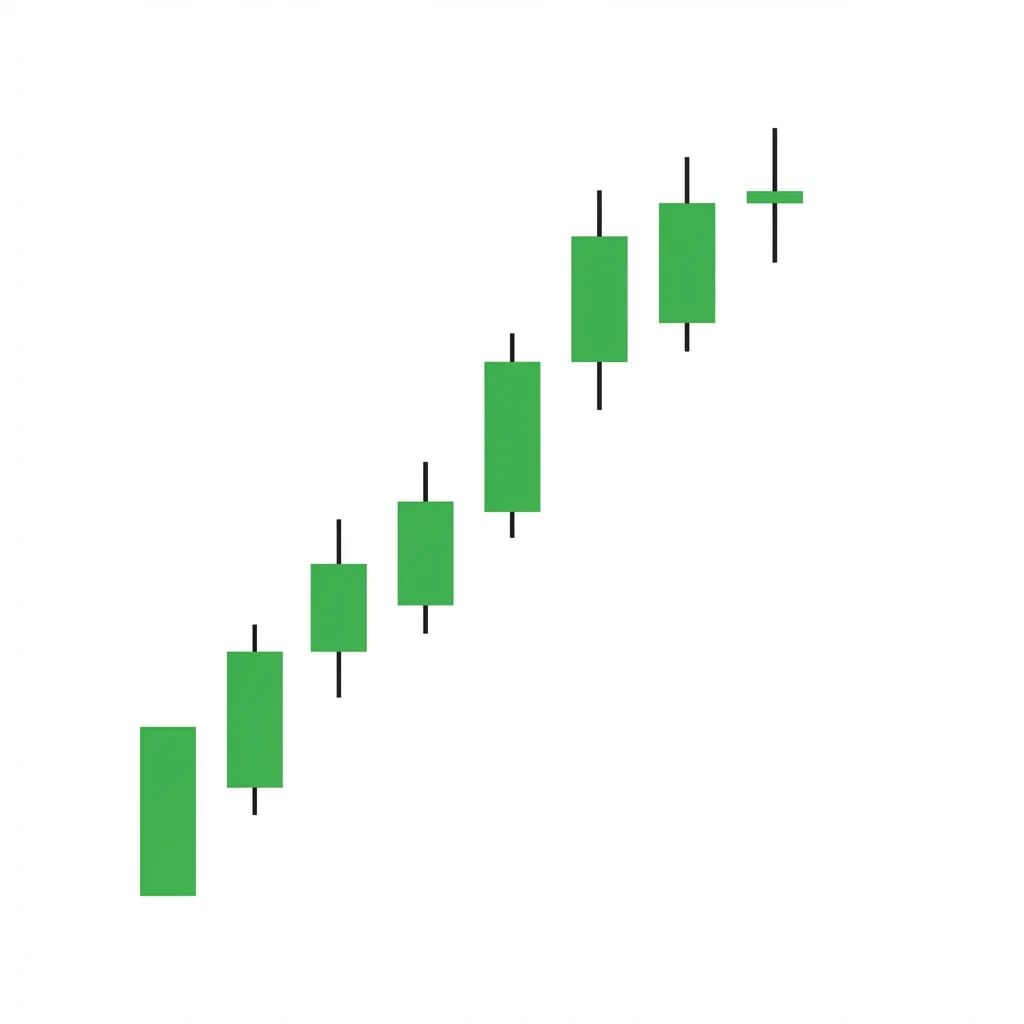
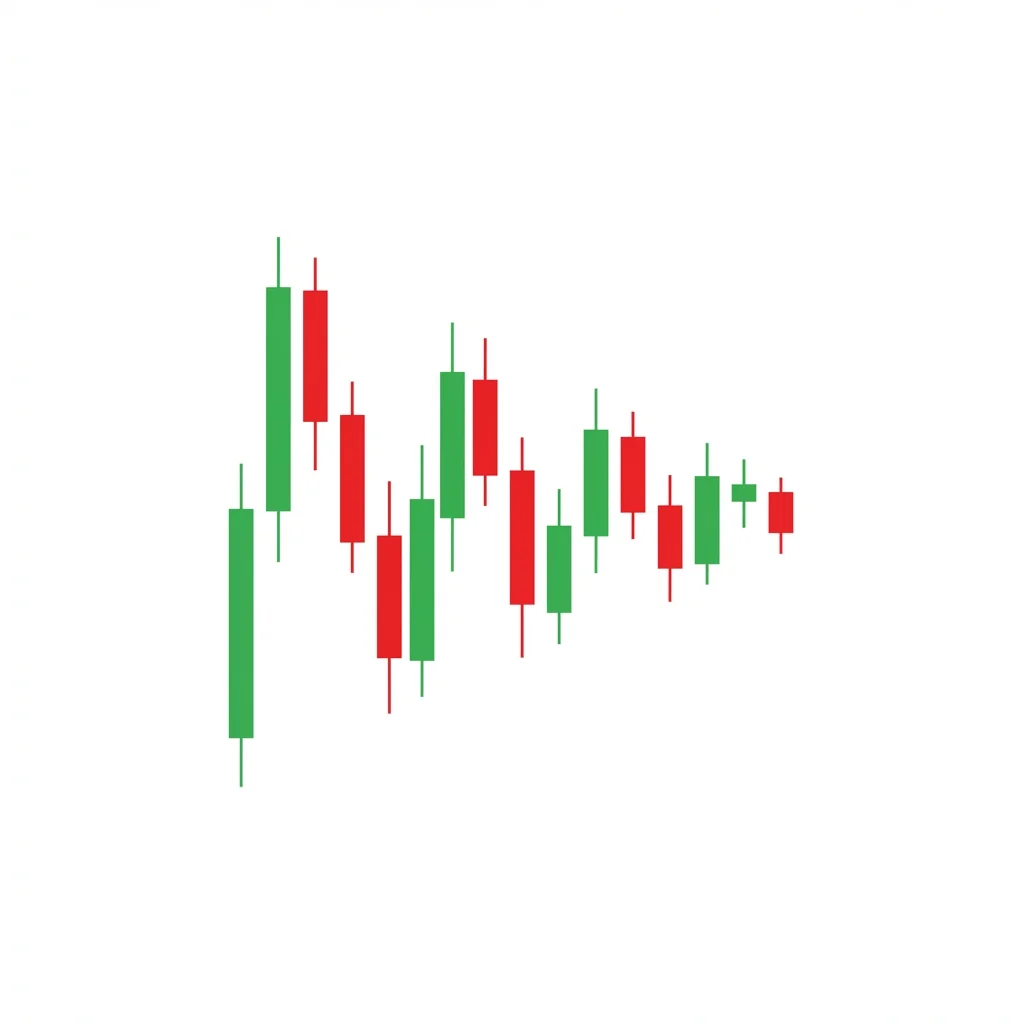
Tight Coil
The Tight Coil is a multi-candle pattern where each successive candle has a smaller range than the last, creating a coiled-spring effect that typically precedes an explosive directional breakout.
Diff
Rel
neutralindecision20 candles
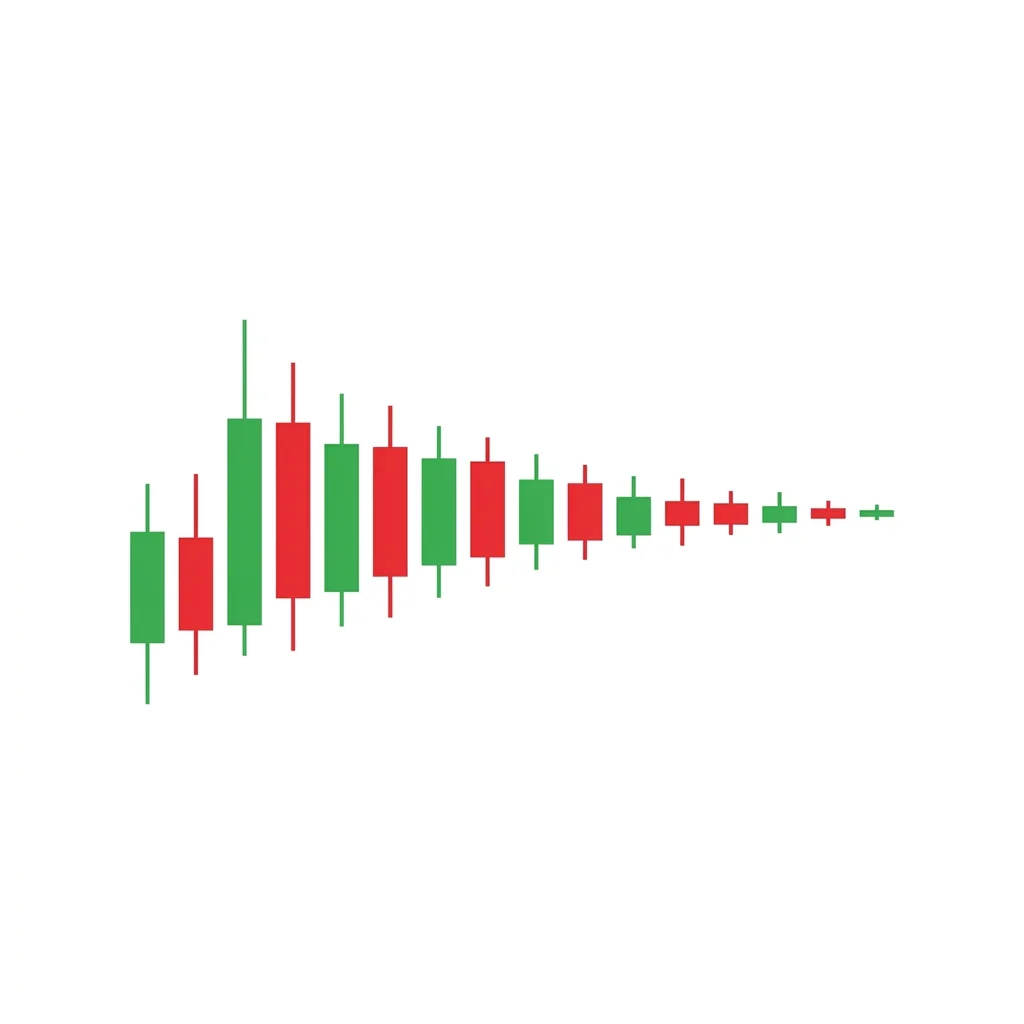
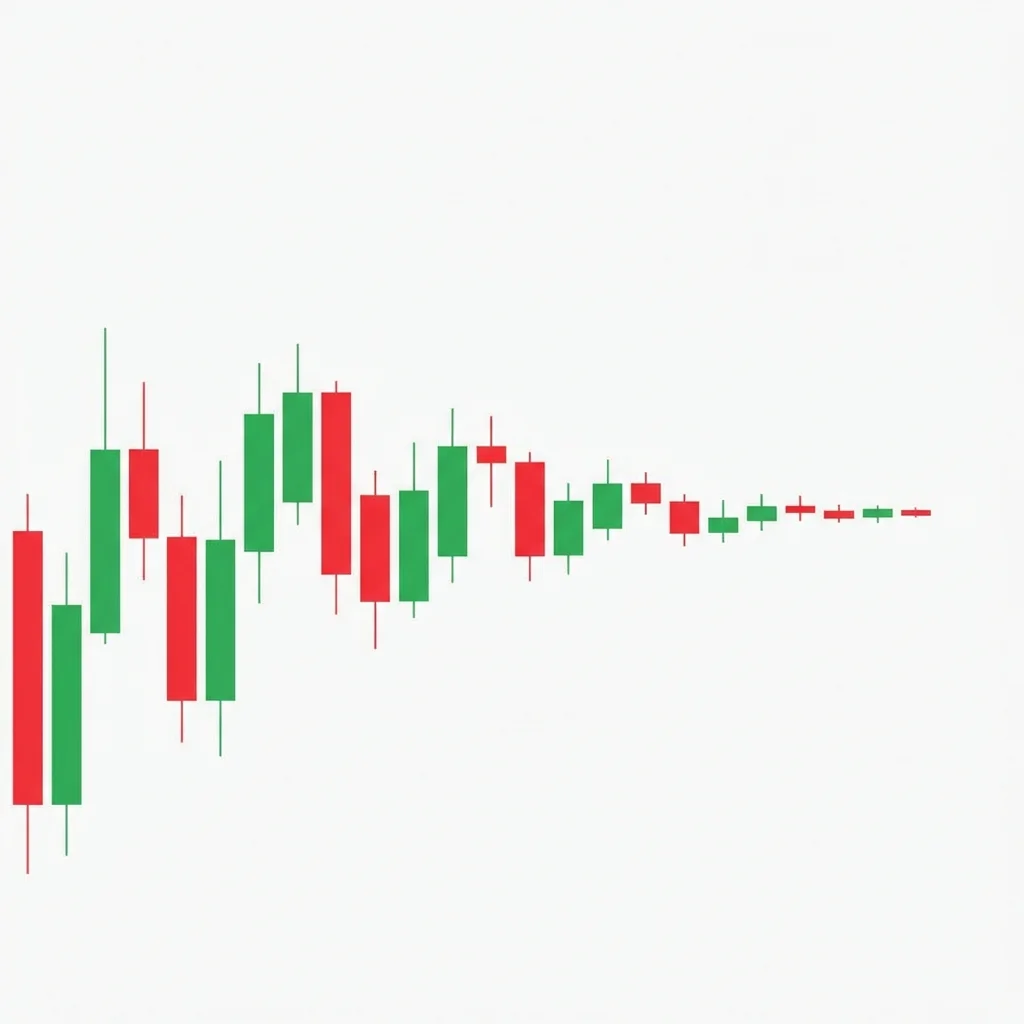
Volatility Contraction
The Volatility Contraction Pattern (VCP) shows progressively smaller price swings as ATR declines, signaling that the market is absorbing supply and preparing for a significant directional breakout.
Diff
Rel
neutralindecision15 candles
Wedge Apex
The Wedge Apex occurs when price reaches the convergence point of two trendlines that slope in the same direction, creating maximum compression that forces a breakout. The pattern is neutral at the apex because the breakout direction depends on context.
Diff
Rel