Loading patterns...
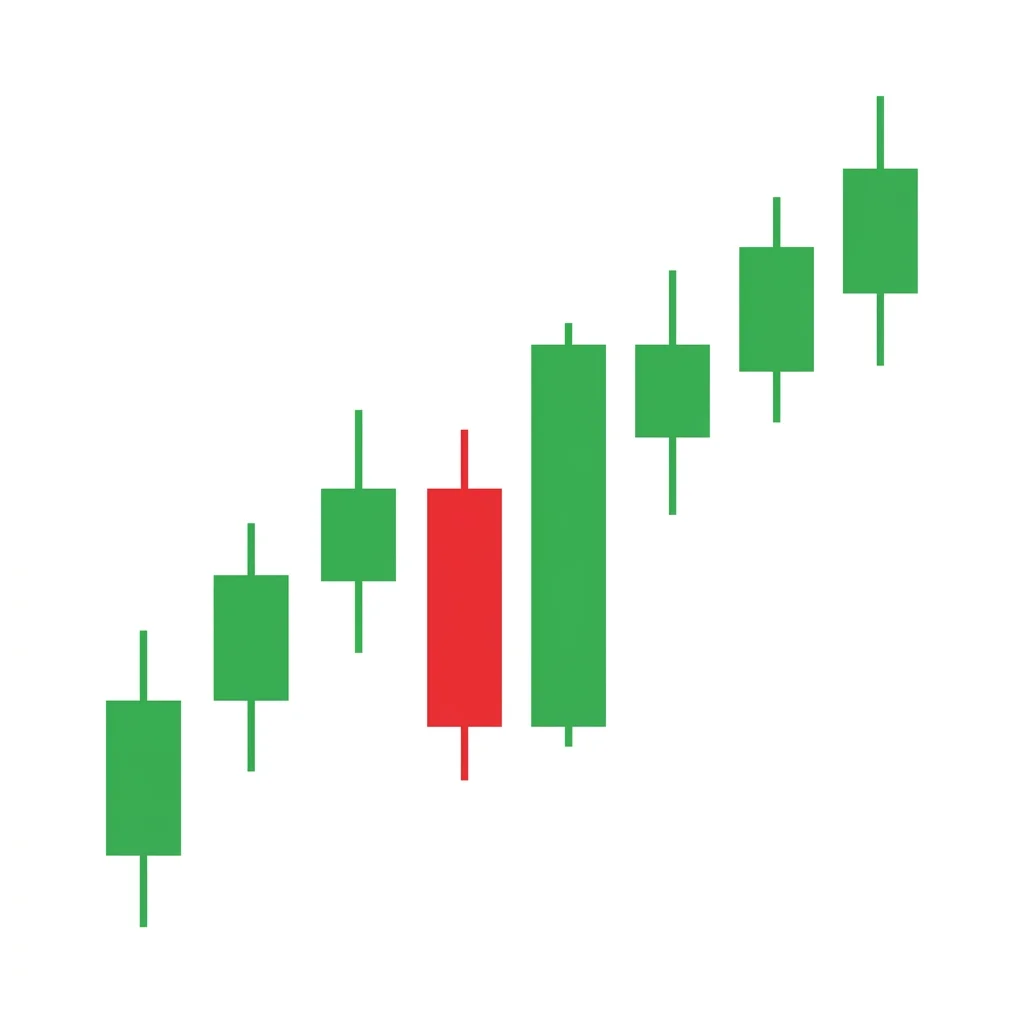
Bullish Patterns
Patterns signaling potential upward price movement.
81 patterns
Patterns signaling potential upward price movement.
Showing 81 of 81 patterns
bullishreversal3 candles
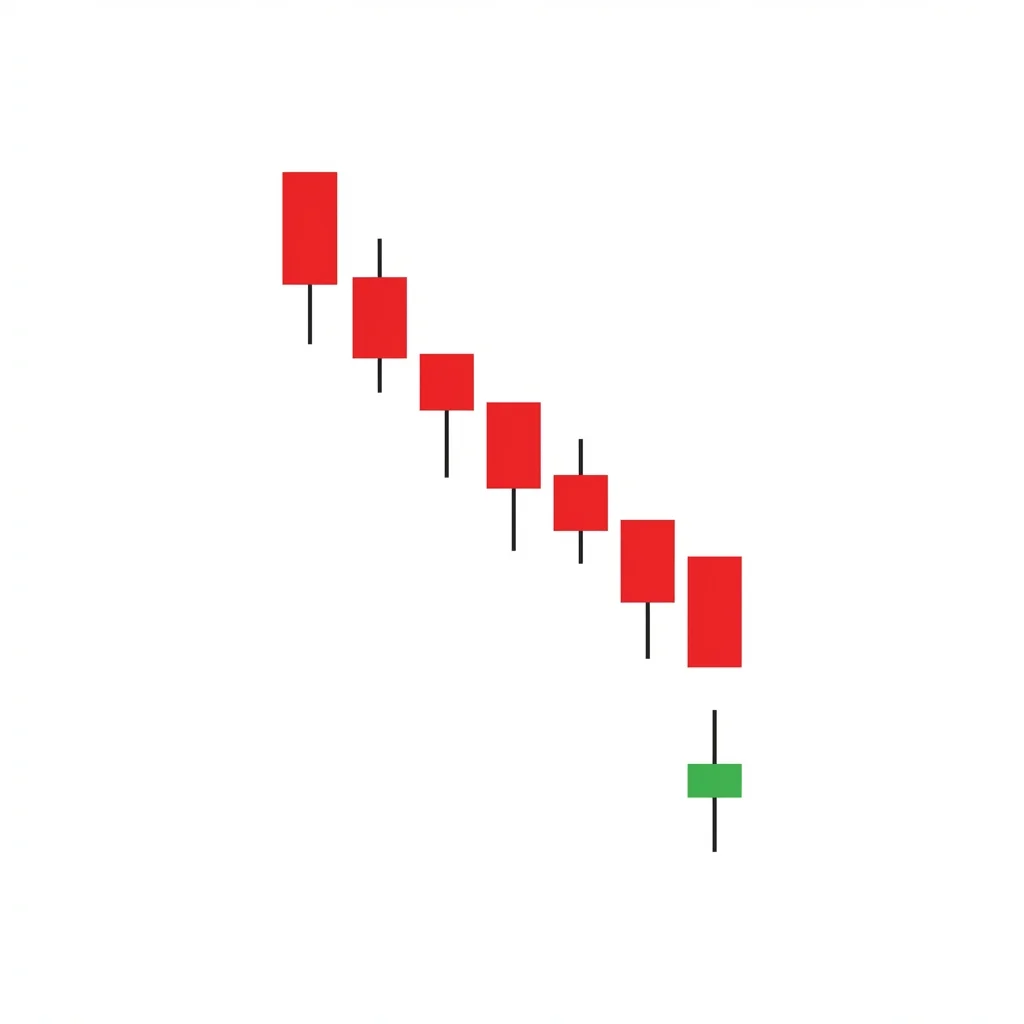
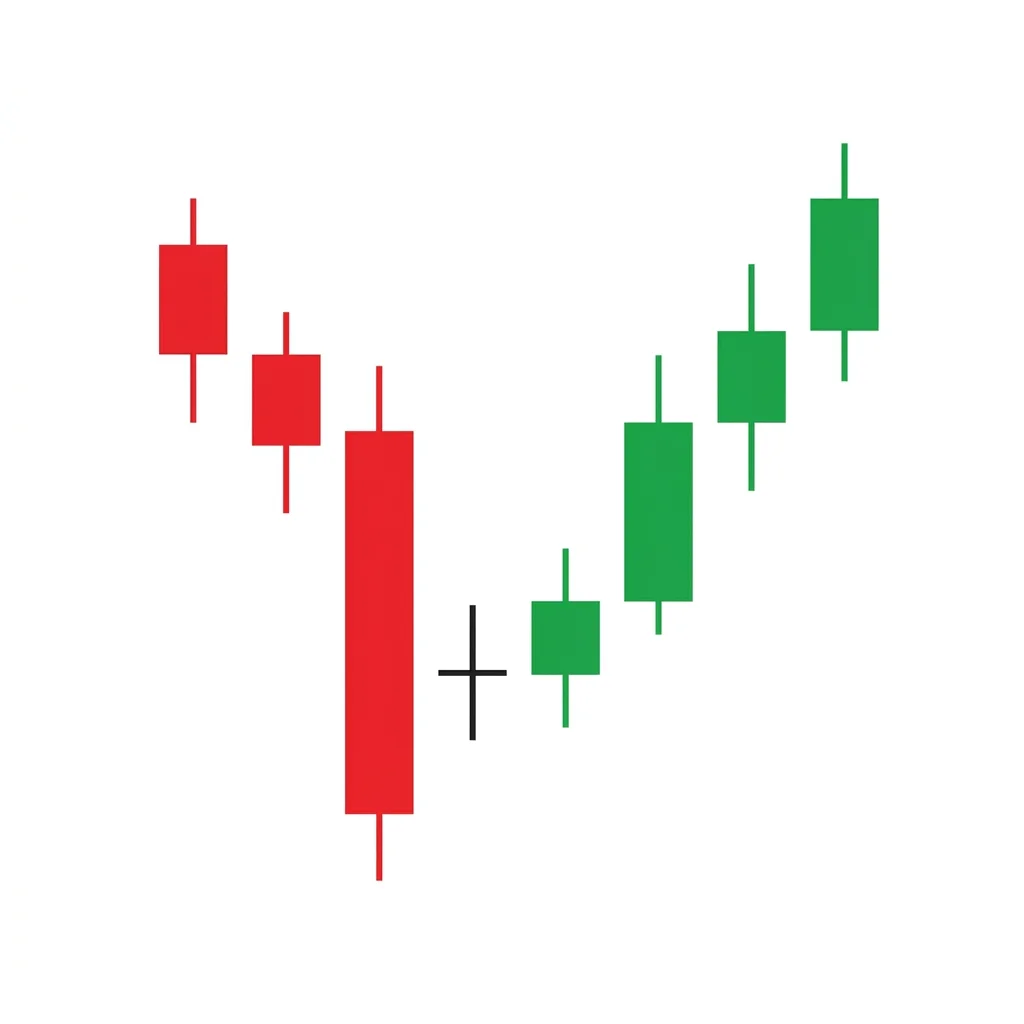
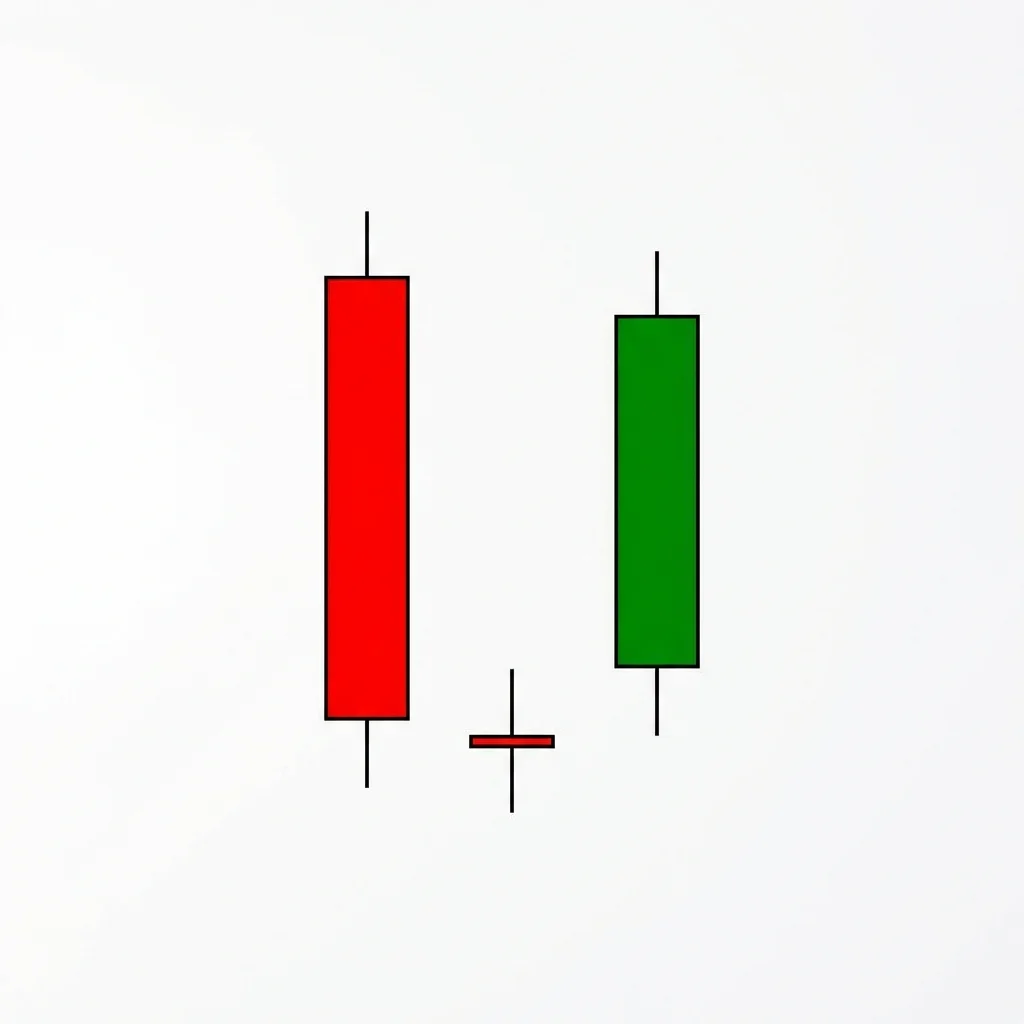
Bullish Abandoned Baby
Sutego Boshi
The Bullish Abandoned Baby is one of the rarest and most reliable reversal patterns in candlestick analysis. It features a doji completely isolated by gaps on both sides, signaling an abrupt shift from bearish to bullish sentiment.
Diff
Rel
bullishcontinuation15 candles
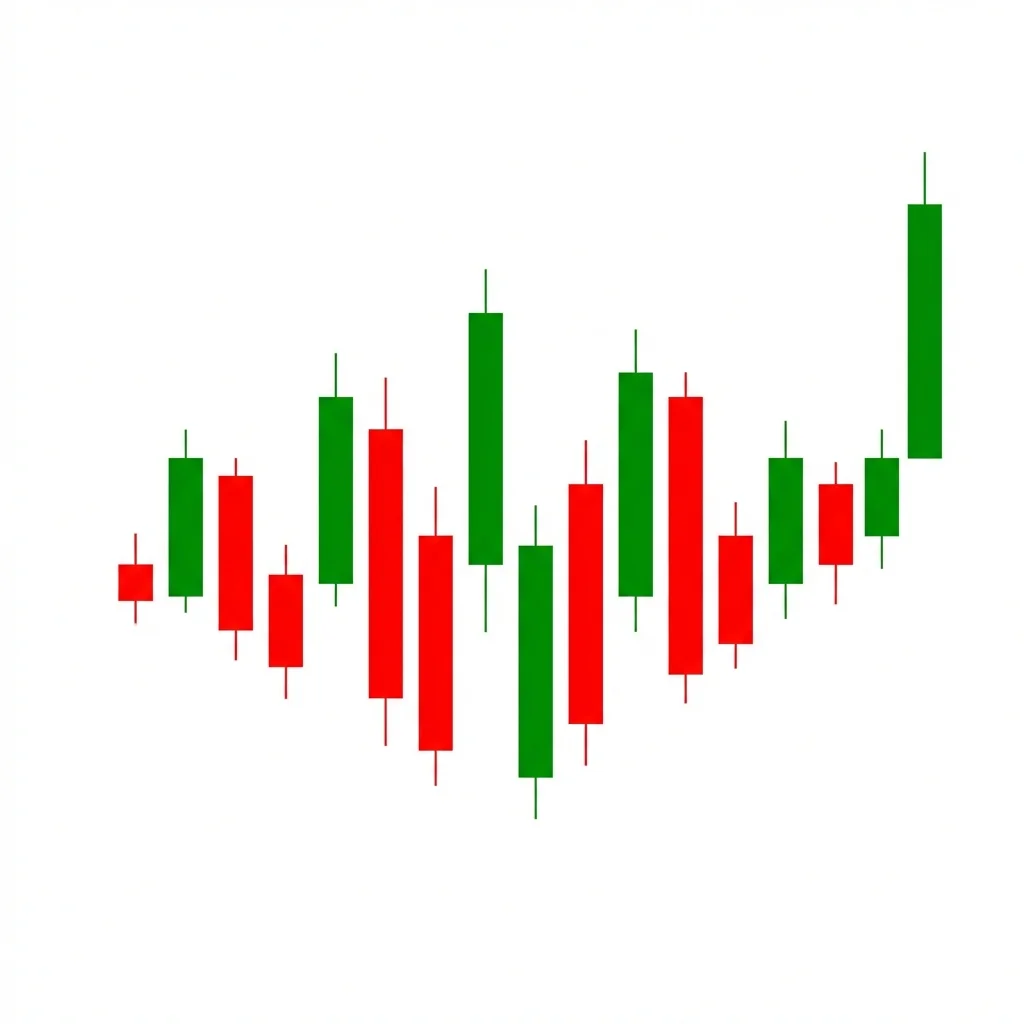
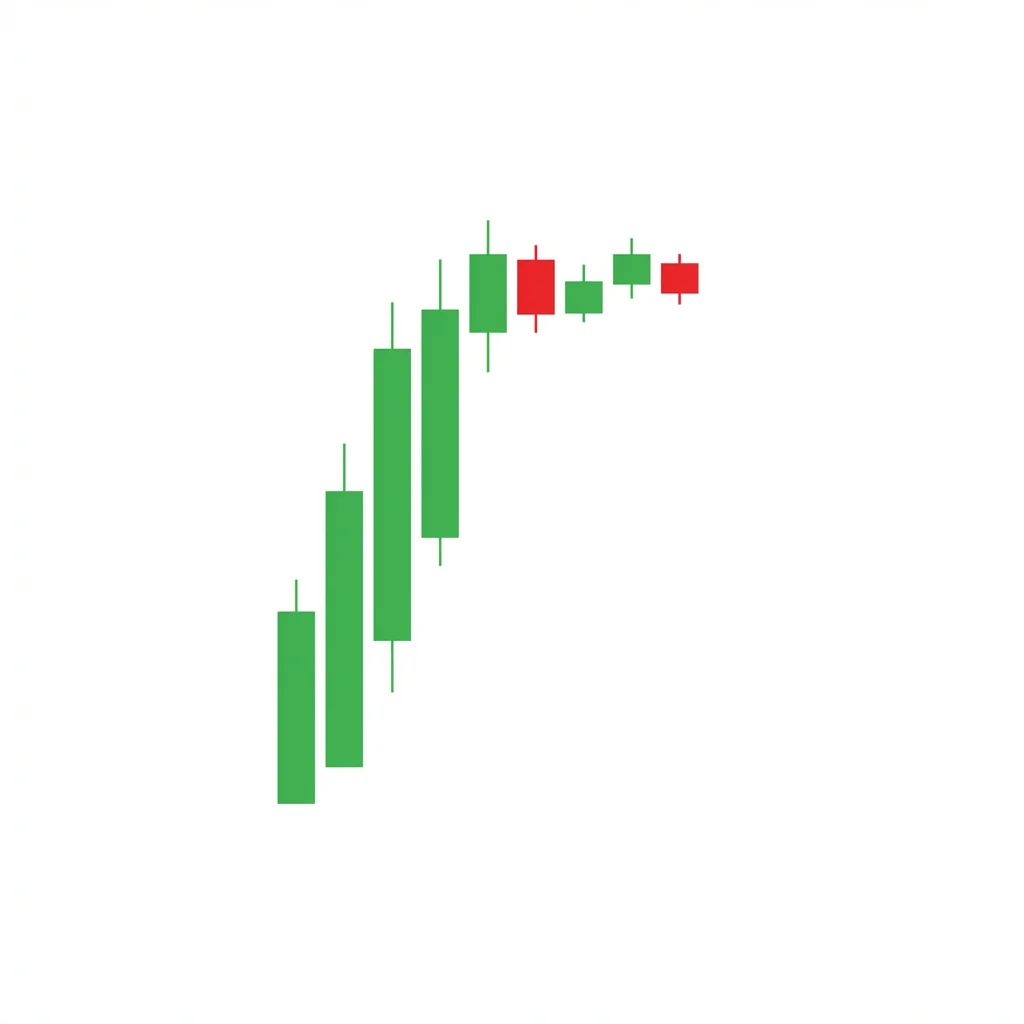
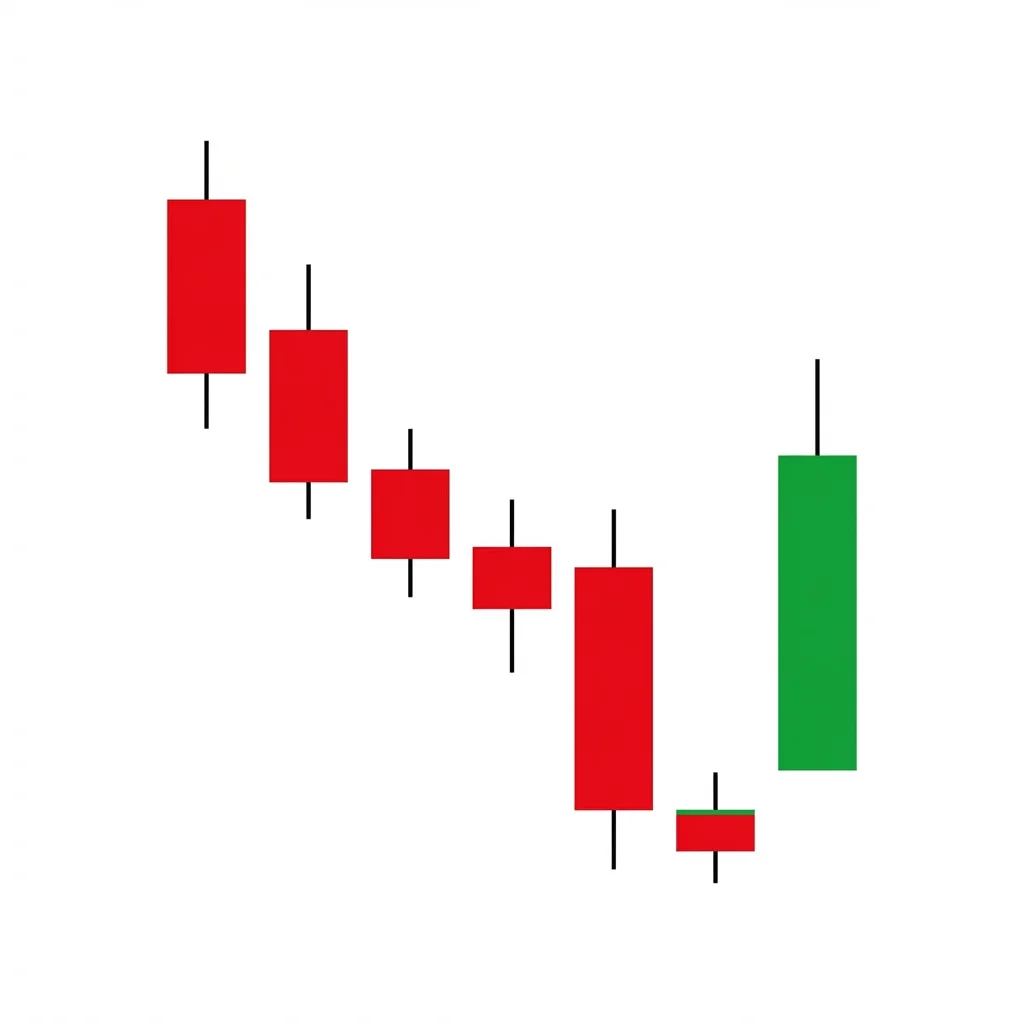
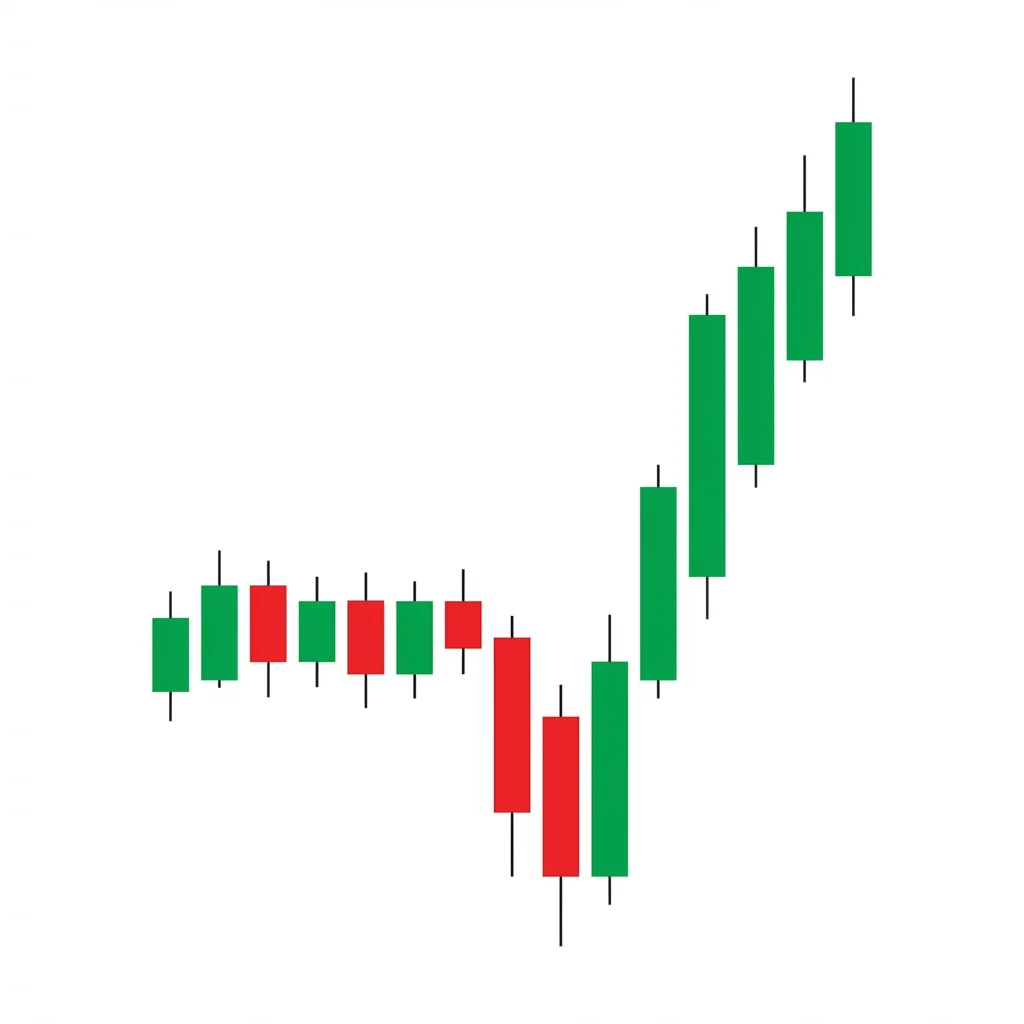
Bullish ABC Bounce
The Bullish ABC Bounce is a simple but powerful continuation pattern where price makes a three-wave corrective pullback within an uptrend before resuming higher. It is one of the most fundamental and frequently occurring patterns in all of technical analysis.
Diff
Rel
bullishreversal50 candles
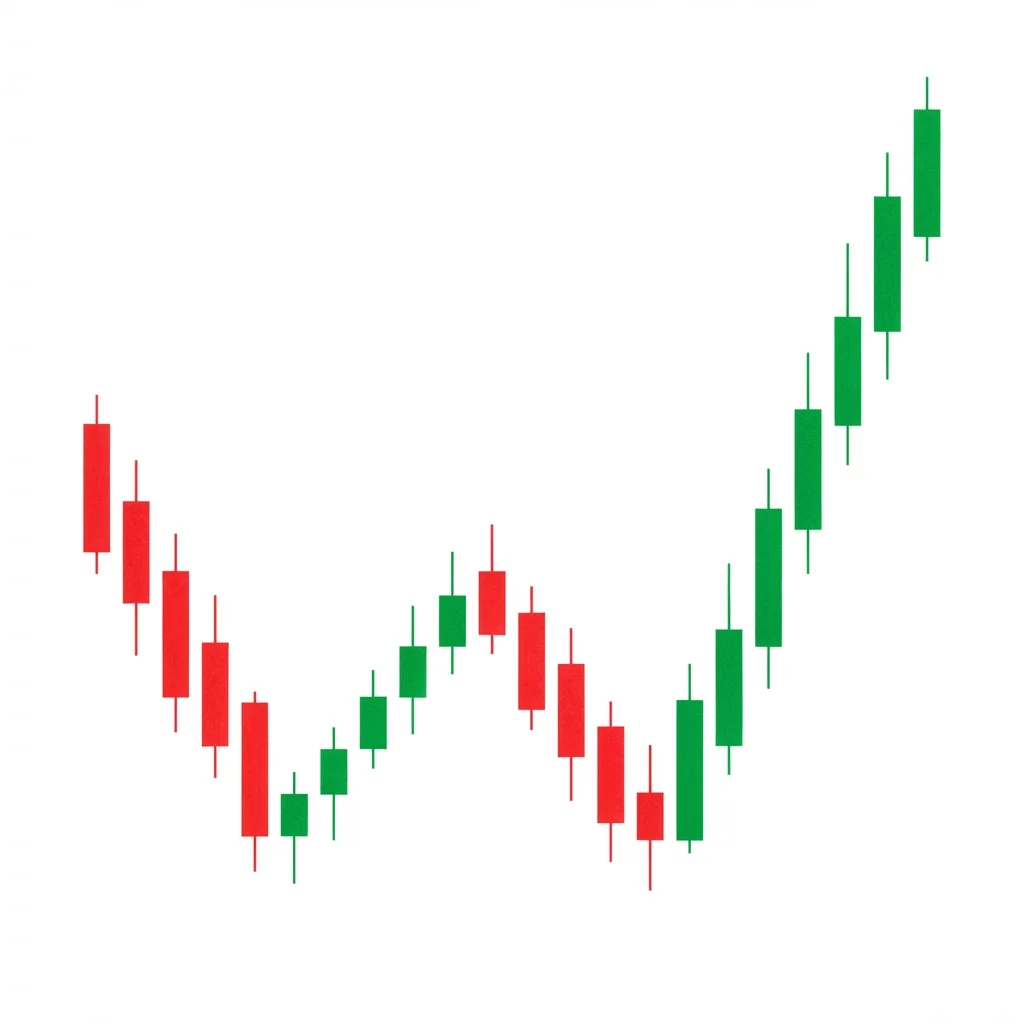
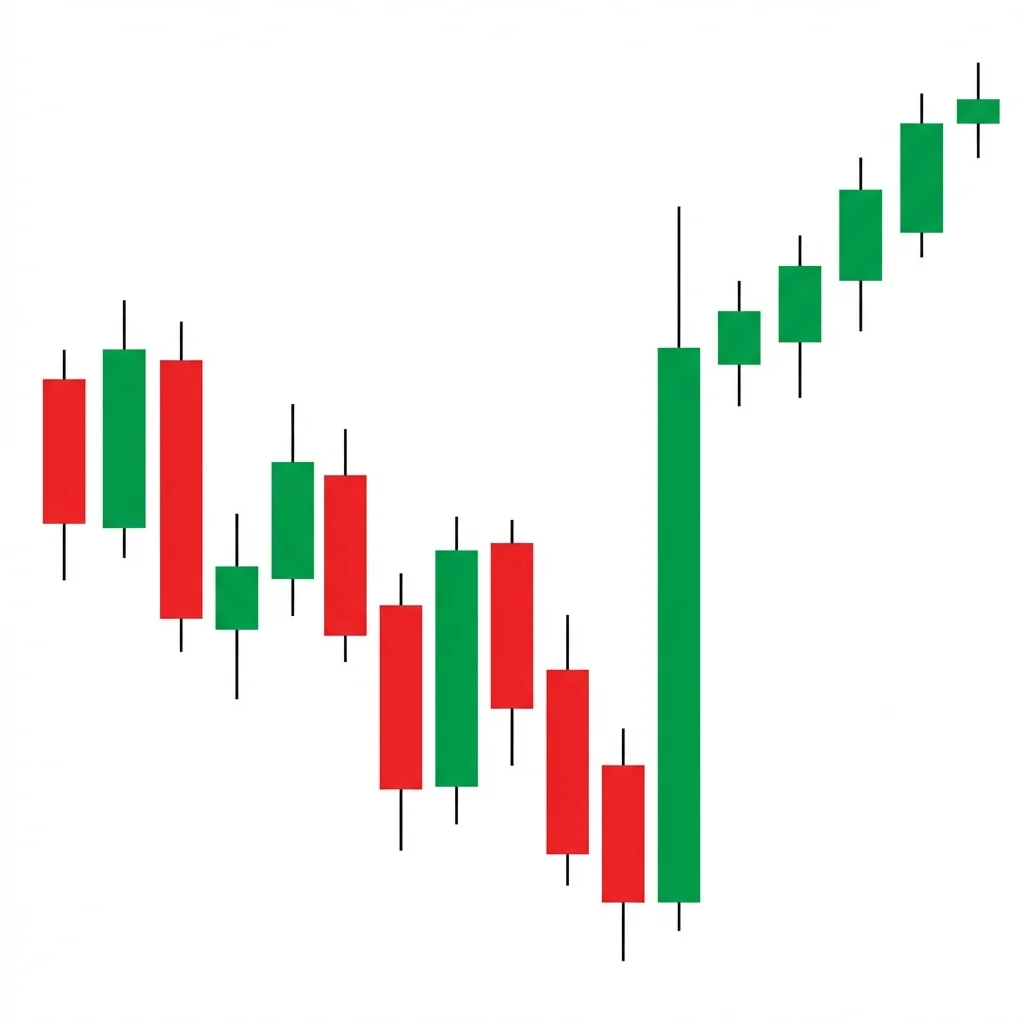
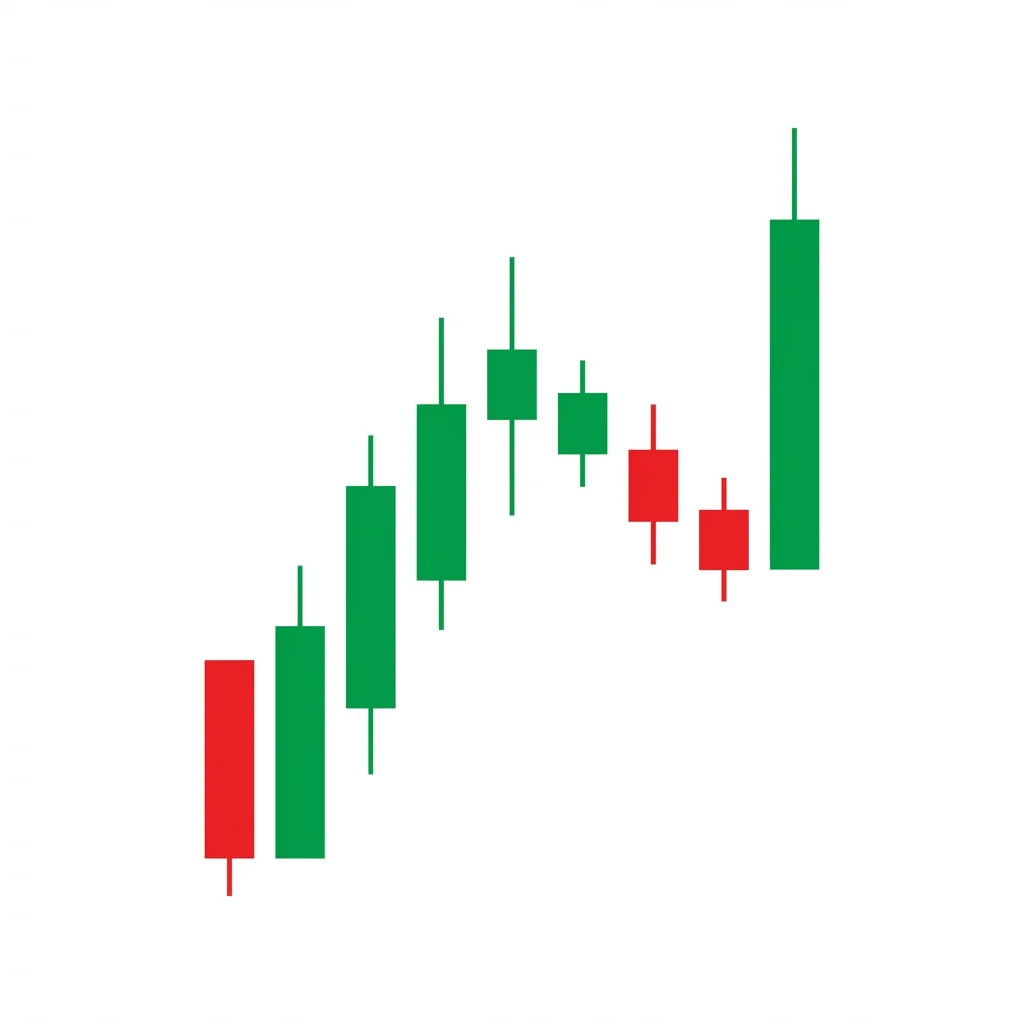
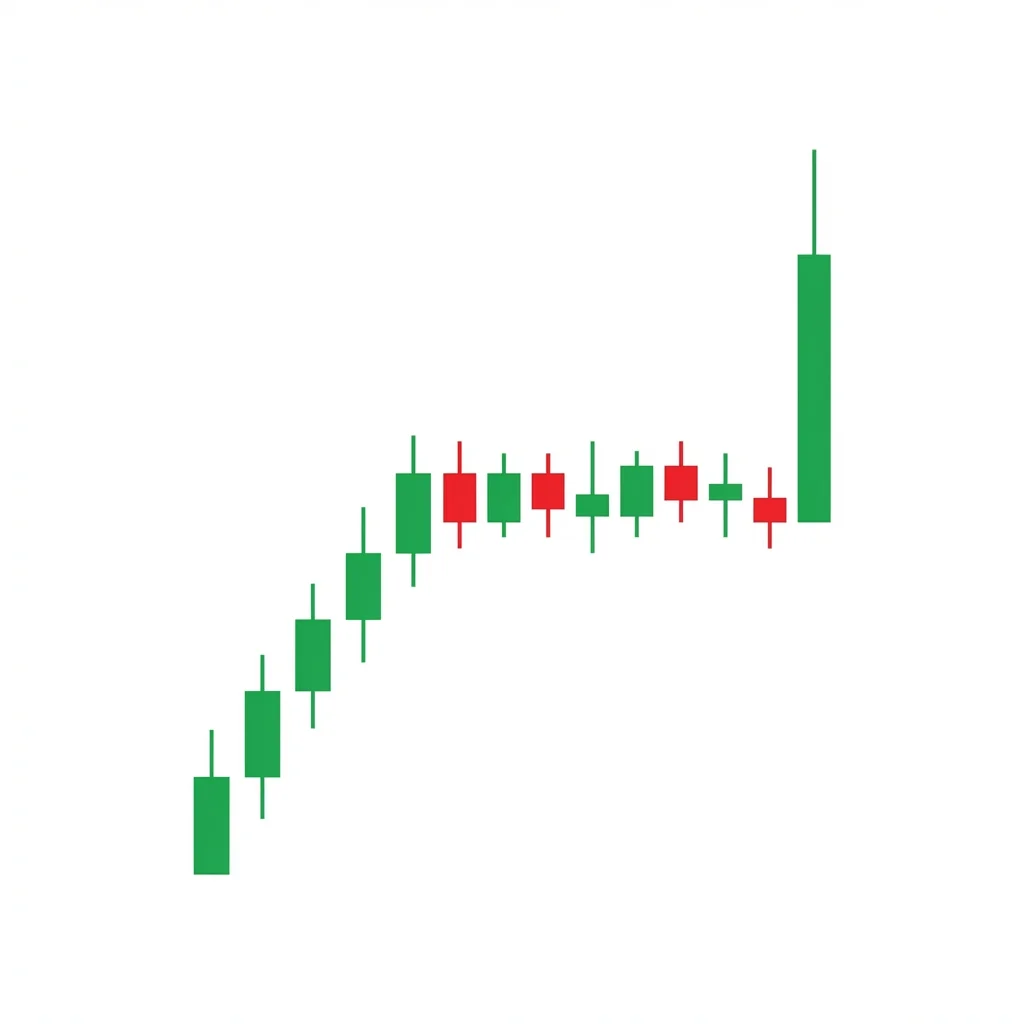
Bullish Accumulation
Bullish Accumulation is a Wyckoff-based pattern where institutional investors quietly build large positions over an extended period, creating a trading range before a powerful markup phase begins.
Diff
Rel
bullishcontinuation20 candles
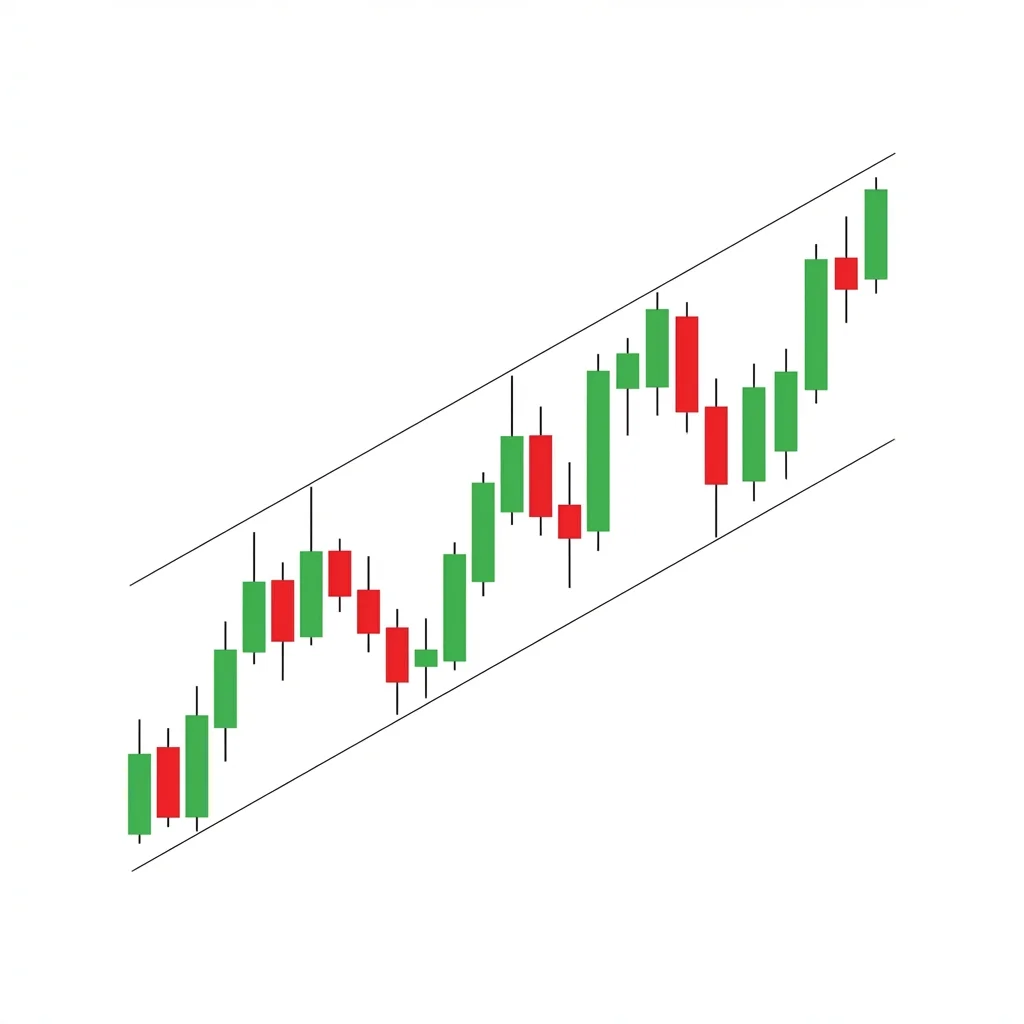
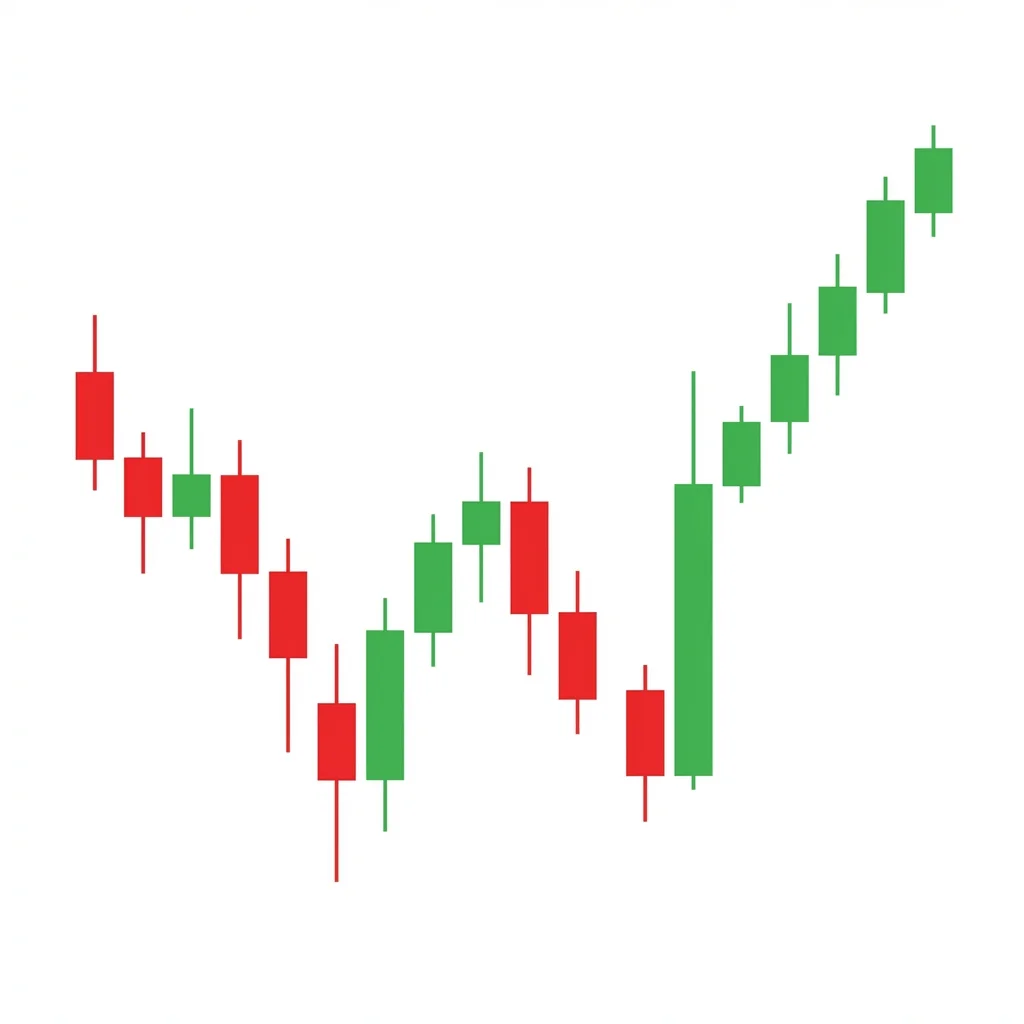
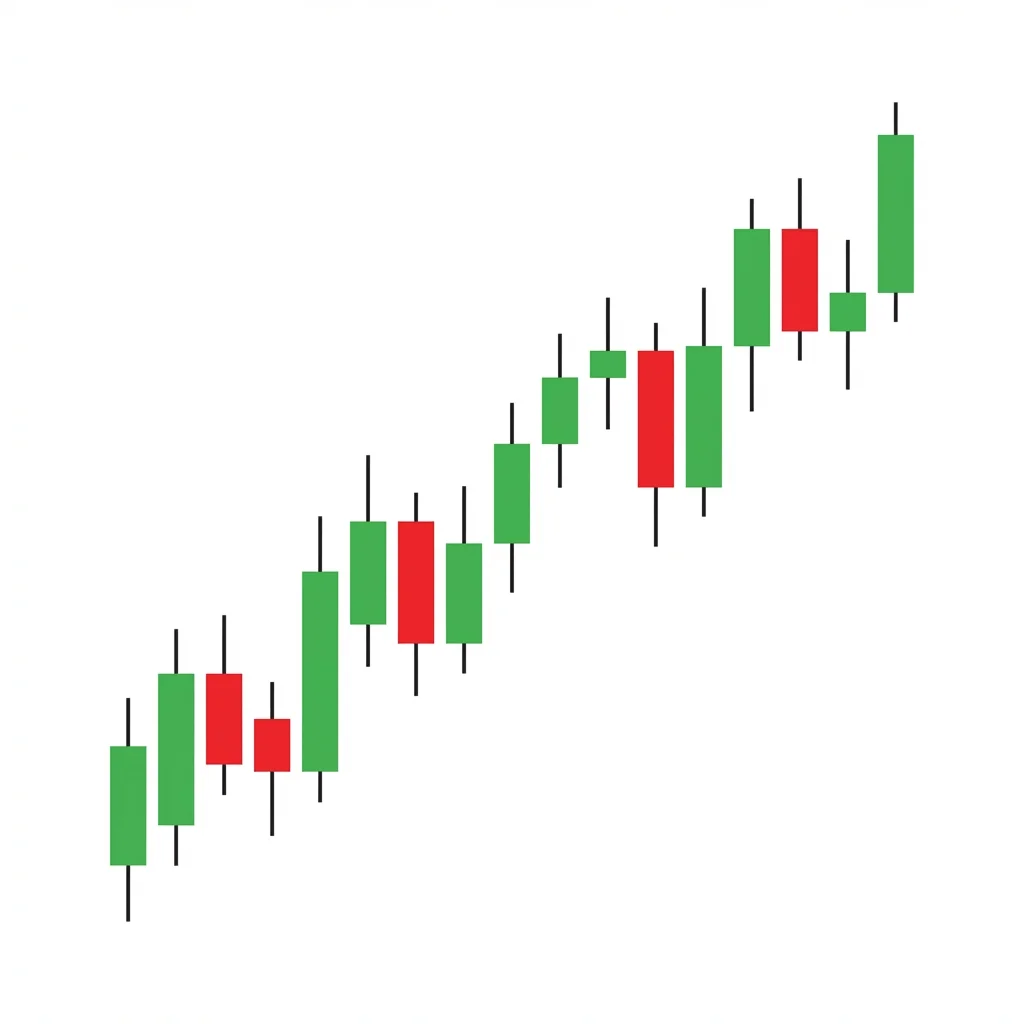
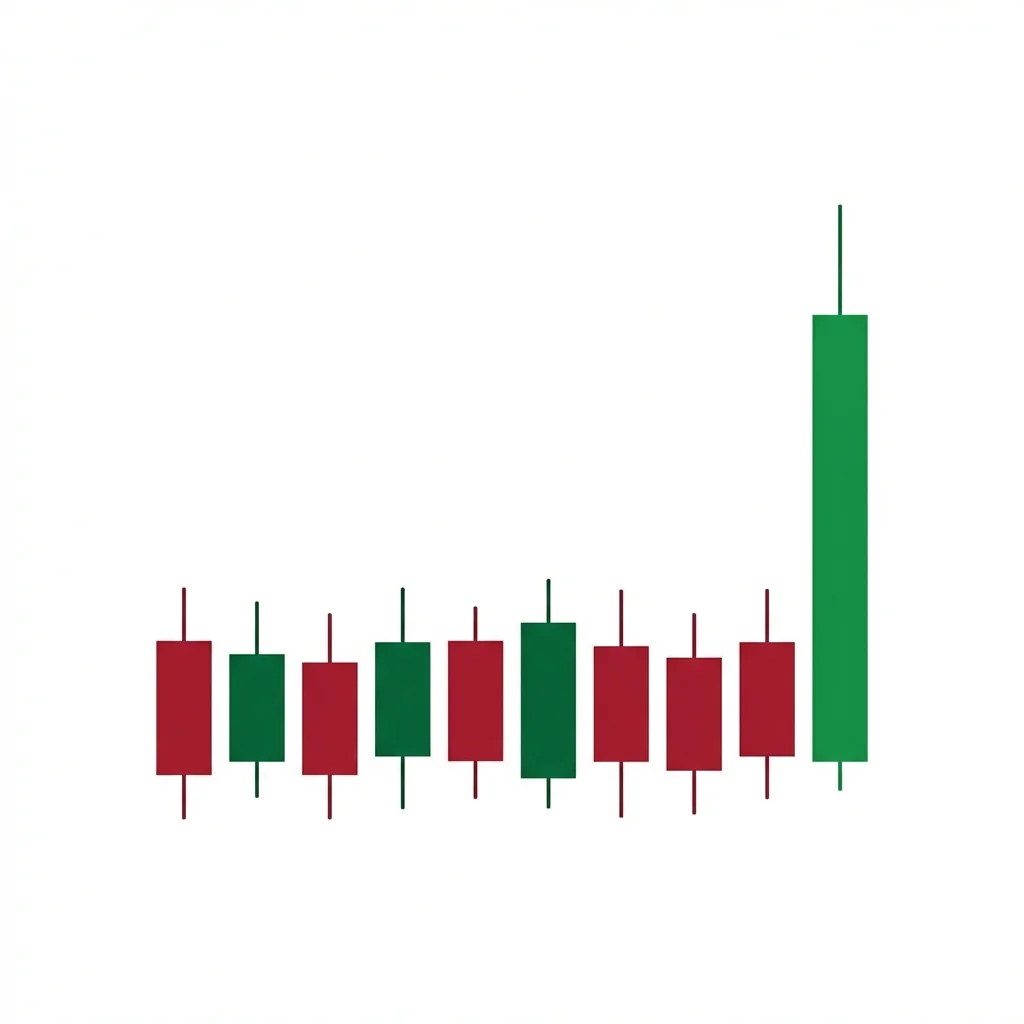
Bullish Ascending Channel
The Bullish Ascending Channel is a continuation pattern where price trends upward within two parallel trendlines, providing clear buy zones at the lower boundary and profit targets at the upper boundary.
Diff
Rel
bullishcontinuation20 candles
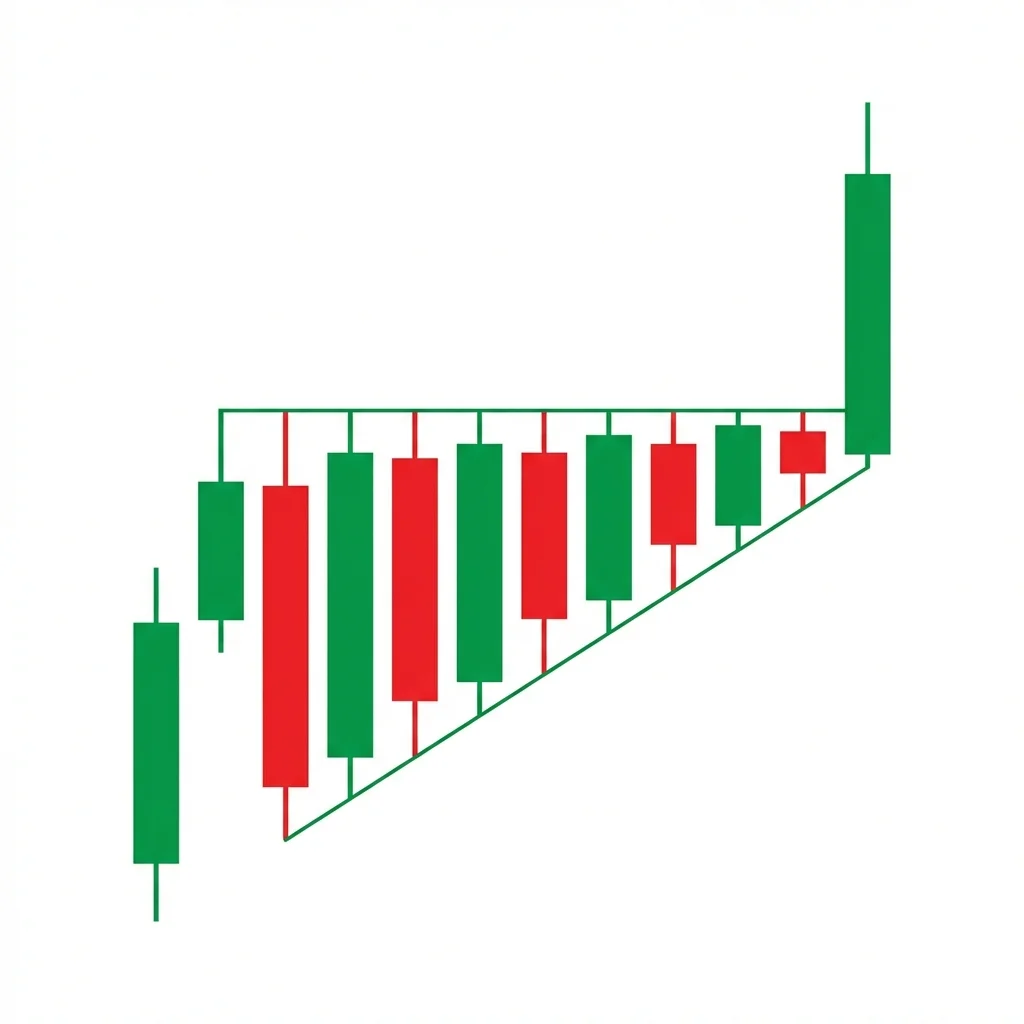
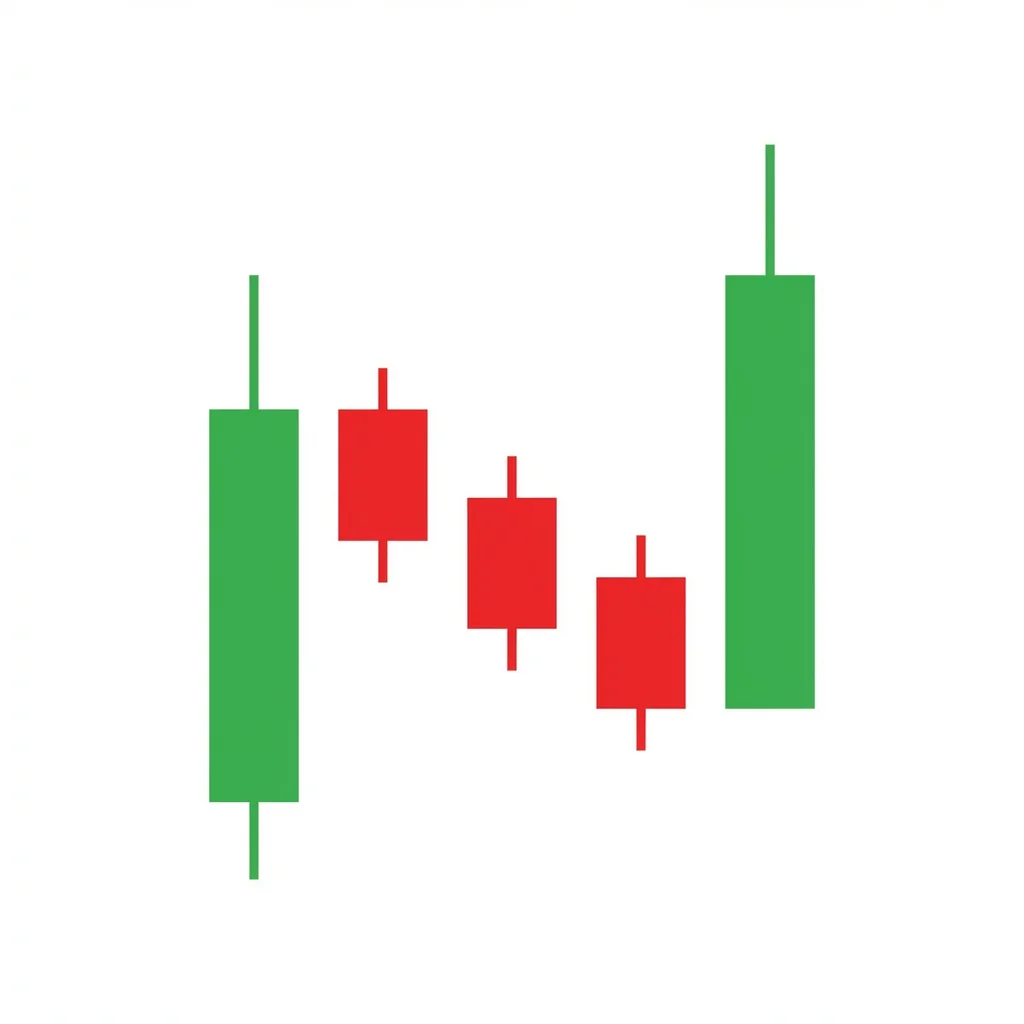
Bullish Ascending Triangle
The Bullish Ascending Triangle is a continuation pattern featuring flat resistance and rising support. Buyers are consistently willing to pay higher prices, compressing the range until a breakout above resistance triggers the next leg up.
Diff
Rel
bullishreversal5 candles
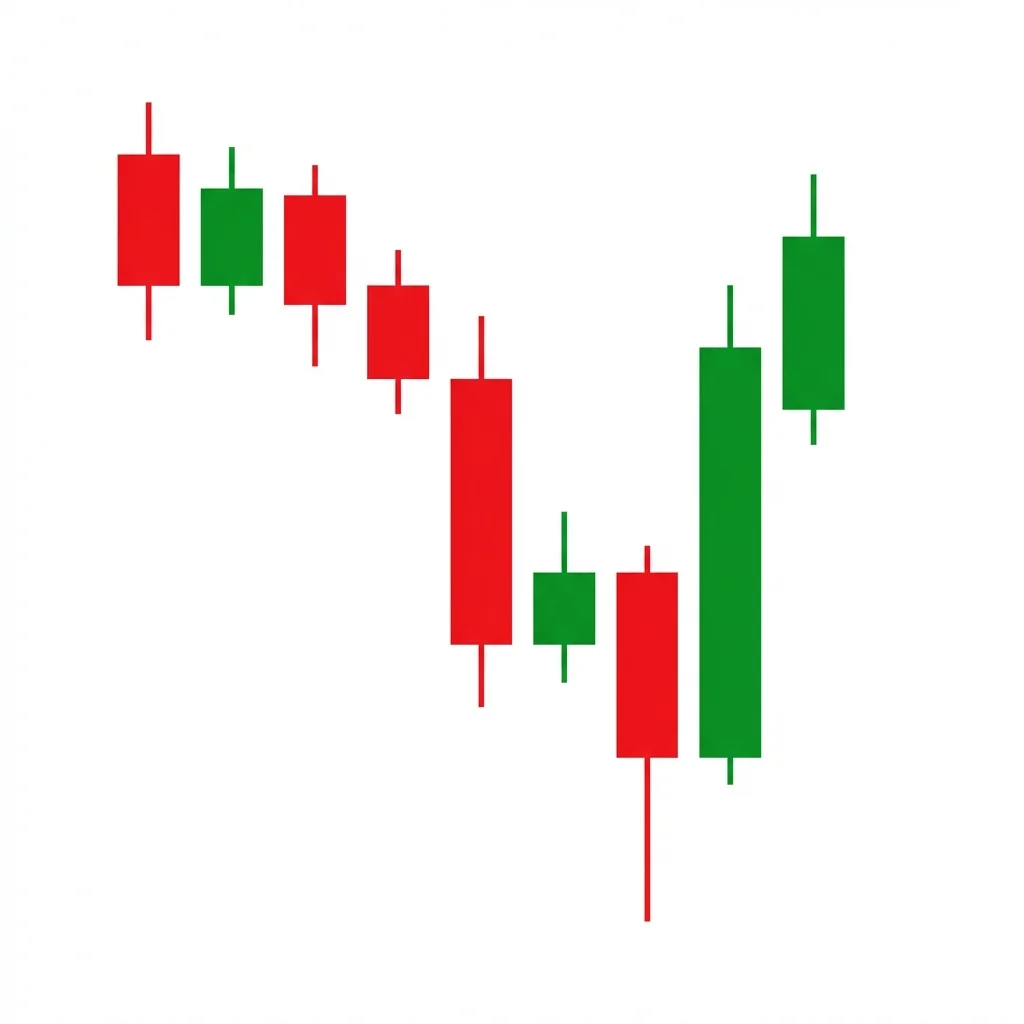
Bullish Bear Trap
A Bear Trap occurs when price breaks below a key support level, luring bears into short positions, only to reverse sharply higher. The trapped shorts are forced to cover, adding fuel to the bullish reversal.
Diff
Rel
bullishreversal1 candle
Bullish Belt Hold
Yorikiri
The Bullish Belt Hold is a single-candle reversal pattern that opens at the low of the session and rallies strongly to close near the high, signaling a potential shift from bearish to bullish control.
Diff
Rel
bullishreversal5 candles
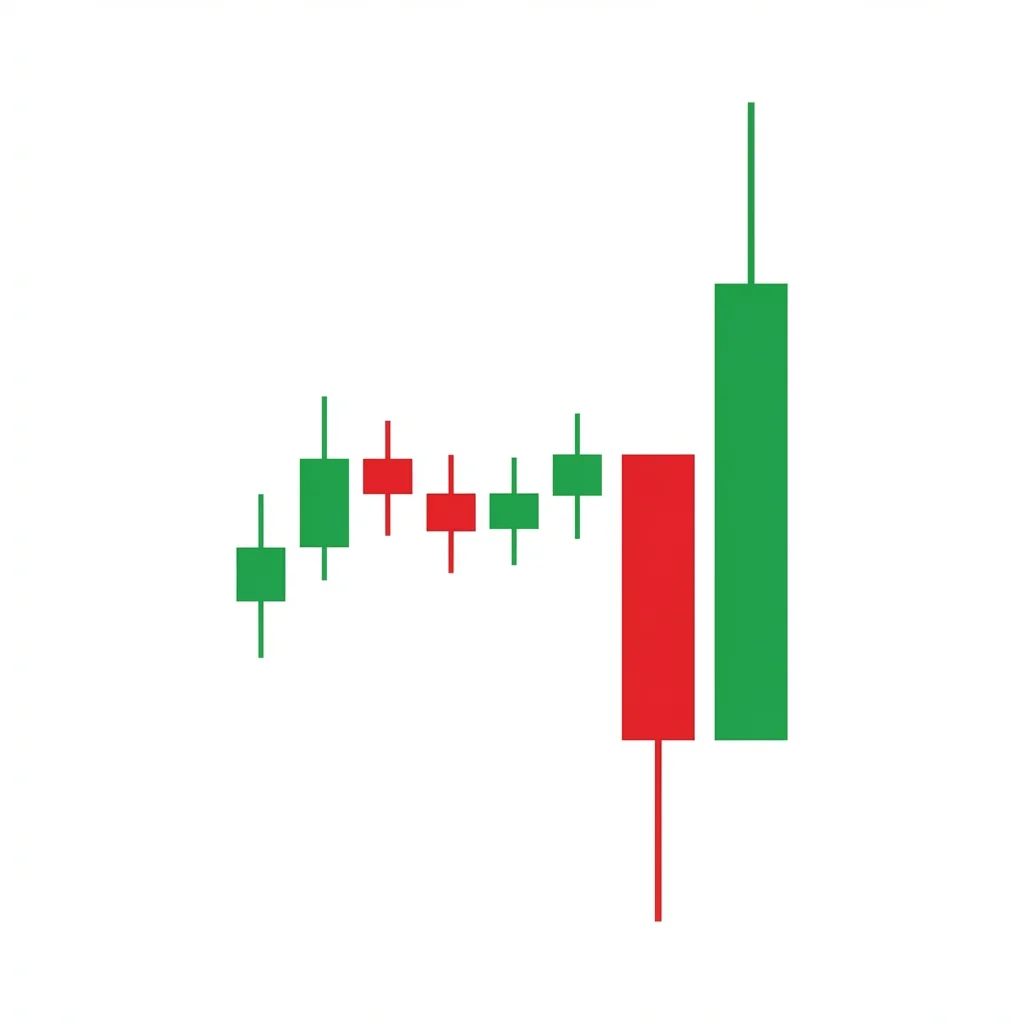
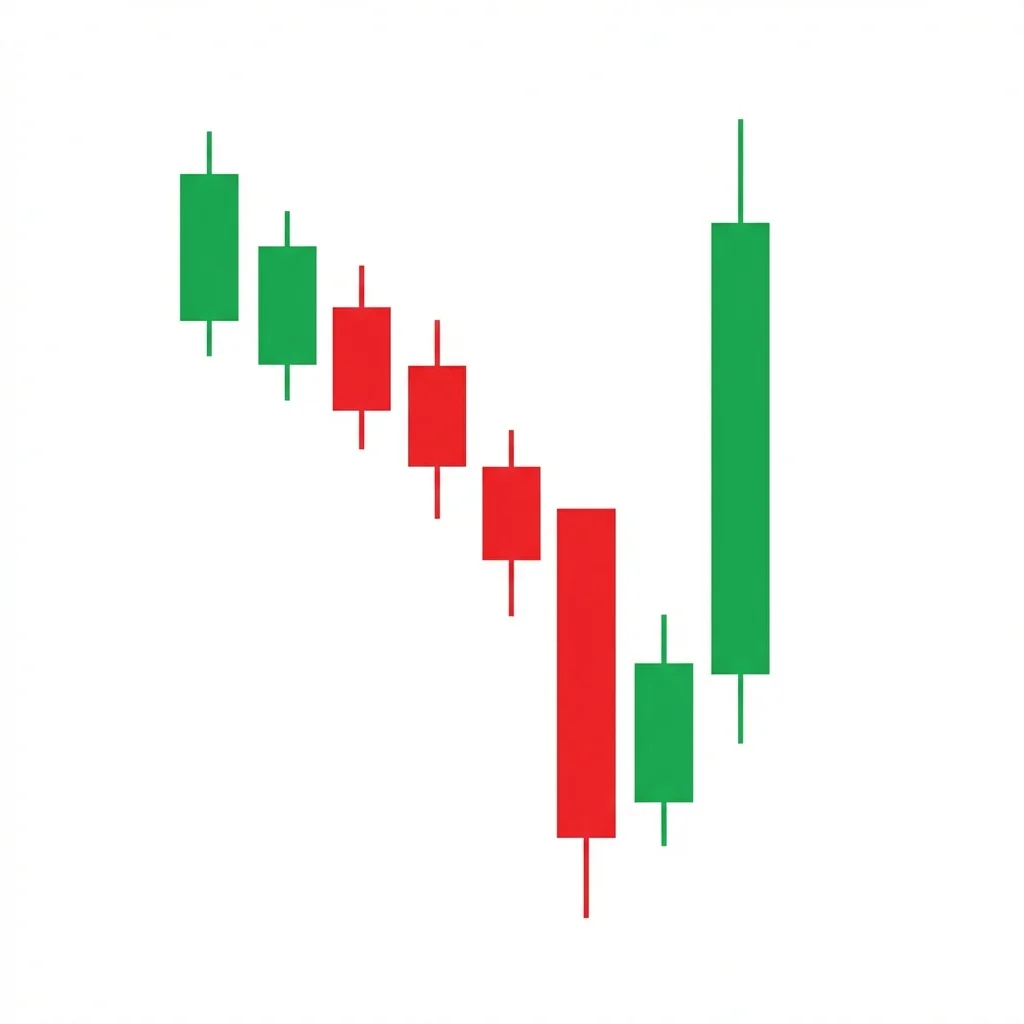
Bullish Breakaway
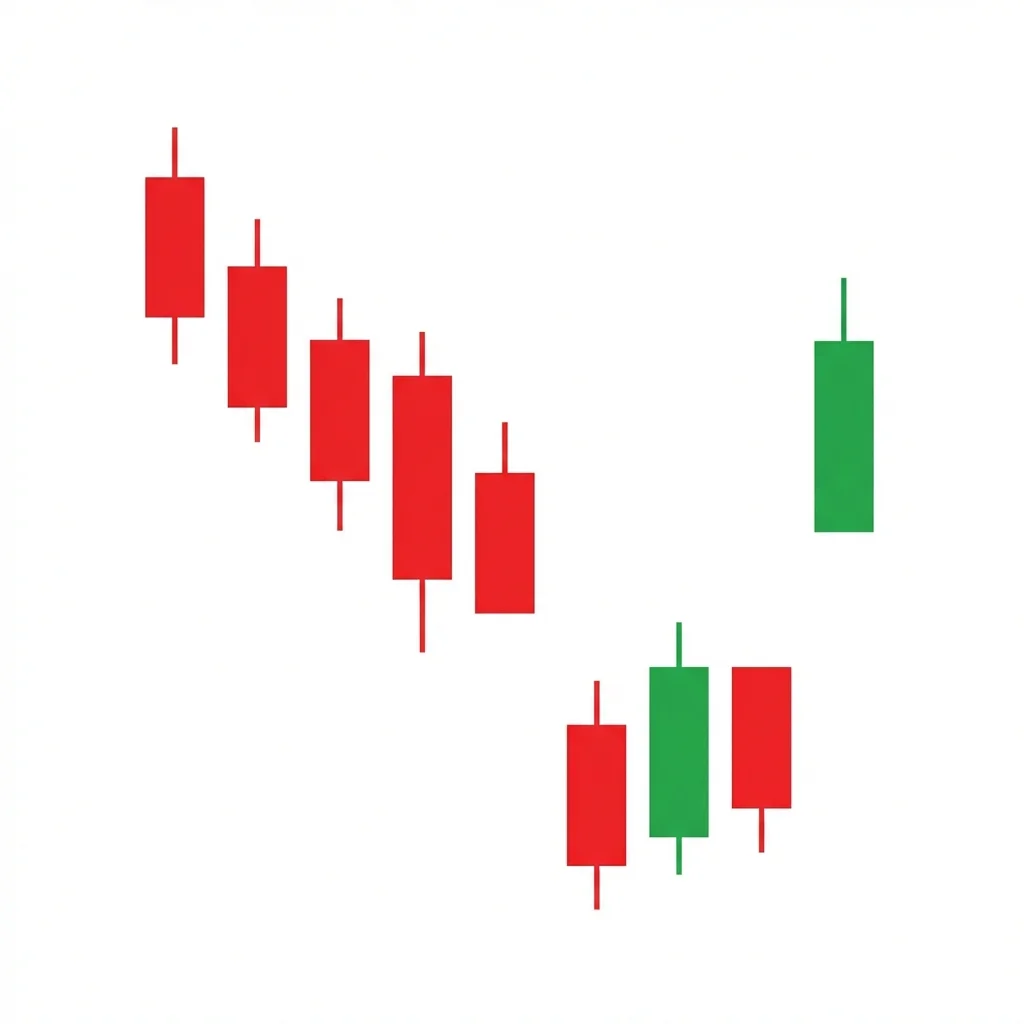
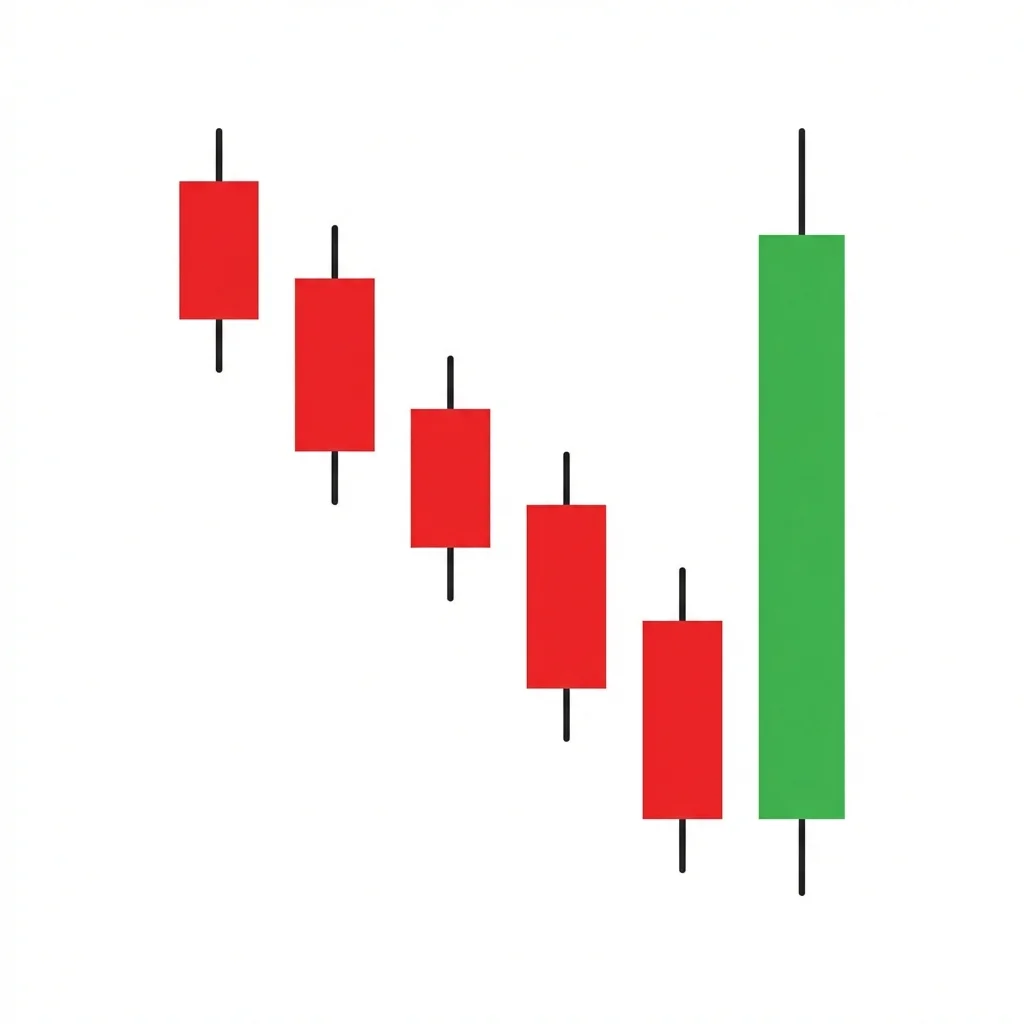
The Bullish Breakaway is a five-candle reversal pattern where a gap-down continuation is followed by progressively smaller candles and a strong bullish candle that reclaims the gap, signaling exhaustion of selling pressure.
Diff
Rel
bullishreversal30 candles
Bullish Broadening Bottom
The Bullish Broadening Bottom is an expanding volatility pattern where price makes successively wider swings. When it resolves with an upside breakout above the upper trendline, it signals a powerful reversal higher.
Diff
Rel
bullishreversal3 candles
Bullish Climax Reversal
The Bullish Climax Reversal occurs when extreme panic selling exhausts all remaining supply, creating a volume spike at the low that marks the turning point from bearish to bullish control.
Diff
Rel
bullishcontinuation1 candle
Bullish Closing Marubozu
Marubozu
The Bullish Closing Marubozu is a single-candle pattern where the close equals the session high (no upper shadow), signaling that buyers maintained control through the closing bell with zero pullback.
Diff
Rel
bullishreversal4 candles
Bullish Concealing Baby Swallow
Kotsubame Tsutsumi
The Bullish Concealing Baby Swallow is an extremely rare four-candle reversal pattern consisting of bearish marubozus where the third candle's upper shadow (the baby) is concealed by the fourth candle, signaling exhaustion of the downtrend.
Diff
Rel
bullishreversal2 candles
Bullish Confirmed Hammer
Karakasa
The Bullish Confirmed Hammer adds a confirmation candle to the classic hammer pattern, significantly improving reliability by proving that buyers who defended the lows maintained control into the next session.
Diff
Rel
bullishreversal2 candles
Bullish Counterattack Line
Deai Sen
The Bullish Counterattack Line is a two-candle reversal where a gap-down bullish candle rallies to close at exactly the same level as the previous bearish candle close, showing that buyers have matched sellers point for point.
Diff
Rel
bullishcontinuation40 candles
Bullish Cup and Handle
The Cup and Handle is one of the most reliable continuation patterns in technical analysis, featuring a rounded U-shaped base (cup) followed by a small pullback (handle) before a powerful breakout to new highs.
Diff
Rel
bullishreversal30 candles
Bullish Diamond Bottom
The Bullish Diamond Bottom is a complex reversal formation that transitions from expanding volatility to contracting volatility in a diamond shape, resolving with a bullish breakout as uncertainty transforms into directional conviction.
Diff
Rel
bullishreversal2 candles
Bullish Doji Star
Doji Boshi
The Bullish Doji Star is a two-candle pattern where a doji gaps below a bearish candle, signaling that selling momentum has stalled and a potential reversal is forming.
Diff
Rel
bullishreversal25 candles
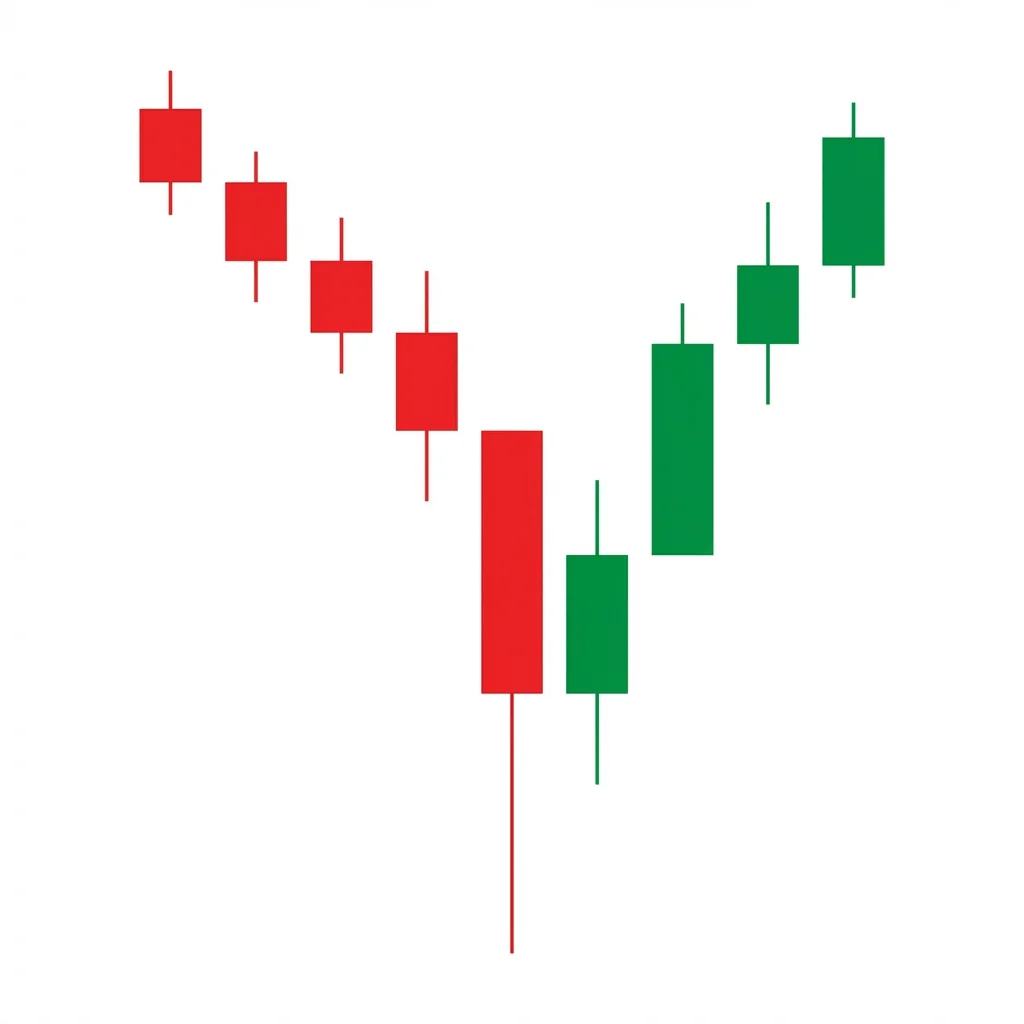
Bullish Double Bottom
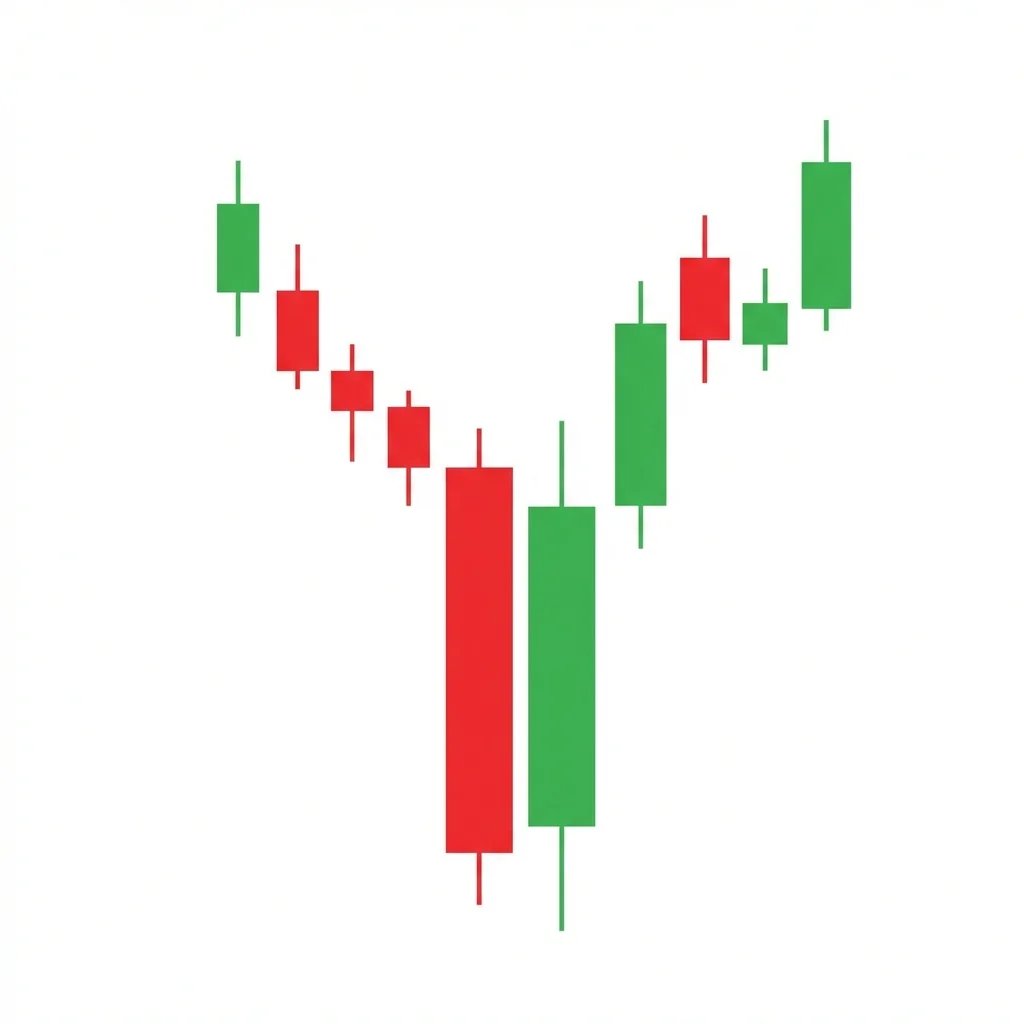
The Double Bottom is one of the most recognized reversal patterns, forming a W-shape where price tests a support level twice and bounces, signaling that sellers cannot push through and buyers are gaining control.
Diff
Rel
bullishreversal30 candles
Bullish Double Bottom Breakout
The Double Bottom Breakout focuses specifically on the confirmed neckline break of a double bottom pattern, which is the highest-conviction entry point with a clear measured move target and defined risk.
Diff
Rel
bullishreversal1 candle
Bullish Dragonfly Doji
Tonbo
The Dragonfly Doji is a powerful single-candle reversal signal where sellers push price significantly lower during the session, but buyers fight back to close at the opening level, creating a T-shaped candle that signals complete rejection of lower prices.
Diff
Rel
bullishreversal2 candles
Bullish Engulfing
Tsutsumi
The Bullish Engulfing is one of the most popular and reliable two-candle reversal patterns. A large bullish candle completely engulfs the prior bearish candle body, signaling a decisive shift from selling to buying control.
Diff
Rel
bullishcontinuation3 candles
Bullish Fair Value Gap
The Bullish Fair Value Gap (FVG) is a smart money concept identifying price imbalances where aggressive buying creates a gap between the first candle high and third candle low. Price often returns to this zone to fill the inefficiency before continuing higher.
Diff
Rel
bullishreversal20 candles
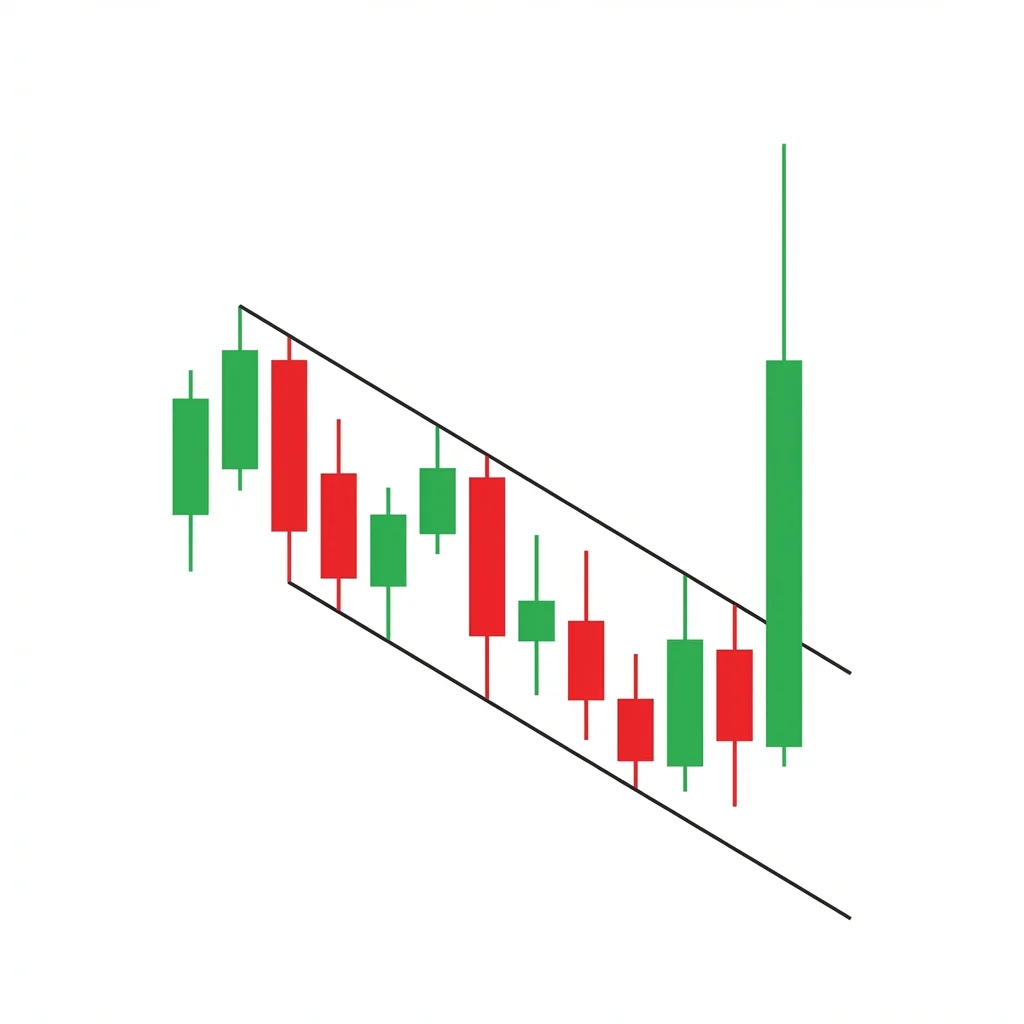
Bullish Falling Channel Break
The Falling Channel Break occurs when price breaks above the upper boundary of a descending parallel channel, signaling the end of the downtrend and the beginning of a new bullish phase.
Diff
Rel
bullishboth20 candles
Bullish Falling Wedge
The Falling Wedge is a bullish pattern with two converging downward-sloping trendlines. The narrowing range compresses energy that is released on an upside breakout, making it both a reversal pattern (after downtrends) and a continuation pattern (during uptrend corrections).
Diff
Rel
bullishcontinuation15 candles
Bullish Flag
The Bullish Flag is the quintessential continuation pattern: a sharp rally (pole) followed by a brief, tight consolidation (flag) before the next leg up. It represents a healthy pause in a strong uptrend.
Diff
Rel
bullishcontinuation3 candles
Bullish Gap and Go
The Gap and Go occurs when price gaps up on a catalyst, and instead of filling the gap, continues higher as momentum buying drives the stock to new levels throughout the session.
Diff
Rel
bullishreversal2 candles
Bullish Harami
Harami (孕み)
The Bullish Harami is a two-candle reversal pattern where a small bullish candle is entirely contained within the body of the preceding large bearish candle, signaling a potential end to a downtrend.
Diff
Rel
bullishreversal2 candles
Bullish Harami Cross
Harami Yose Sen (孕み寄せ線)
The Bullish Harami Cross is a two-candle reversal pattern where a doji forms within the body of a preceding large bearish candle, indicating strong indecision and a potential bottom.
Diff
Rel
bullishcontinuation30 candles
Bullish High Tight Flag
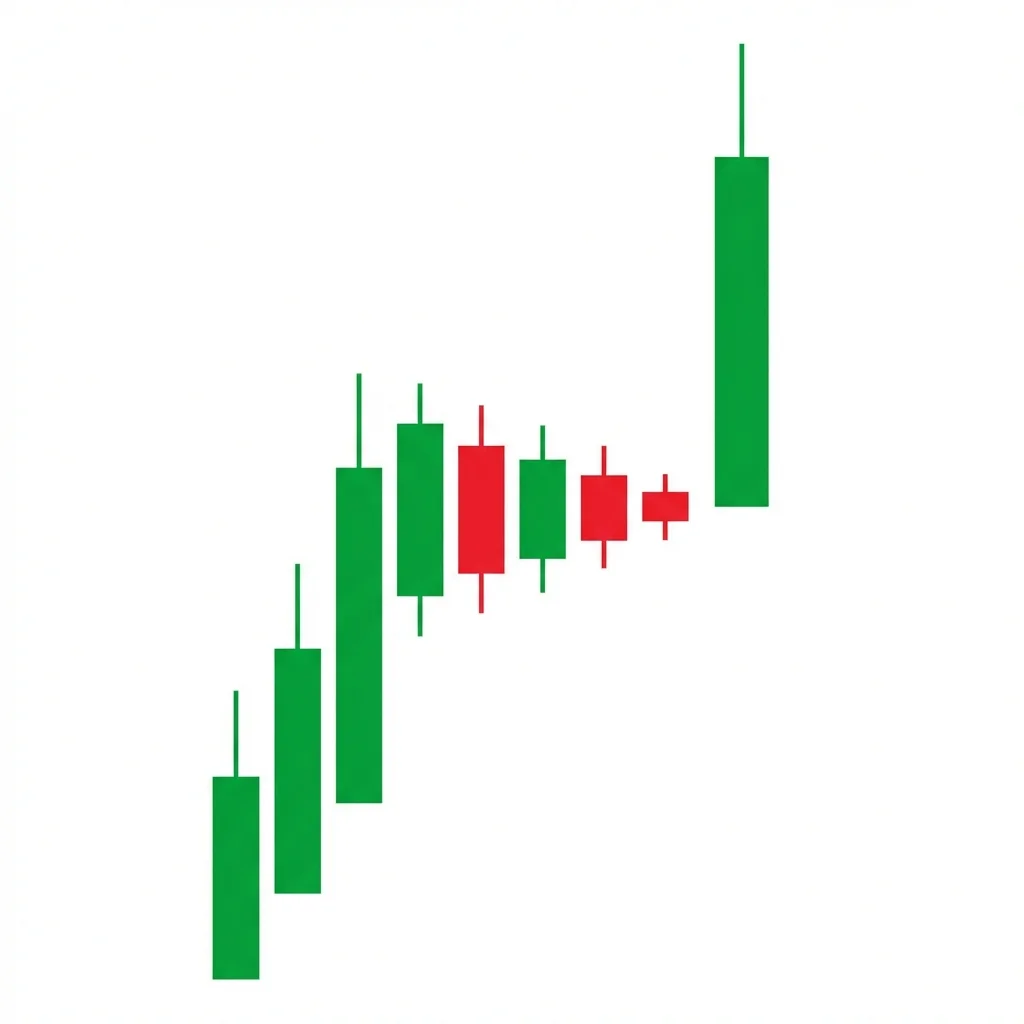
The High Tight Flag is one of the rarest and most powerful bullish continuation patterns. It features a stock that doubles in price quickly, then consolidates in a very tight range before breaking out to potentially double again.
Diff
Rel
bullishcontinuation10 candles
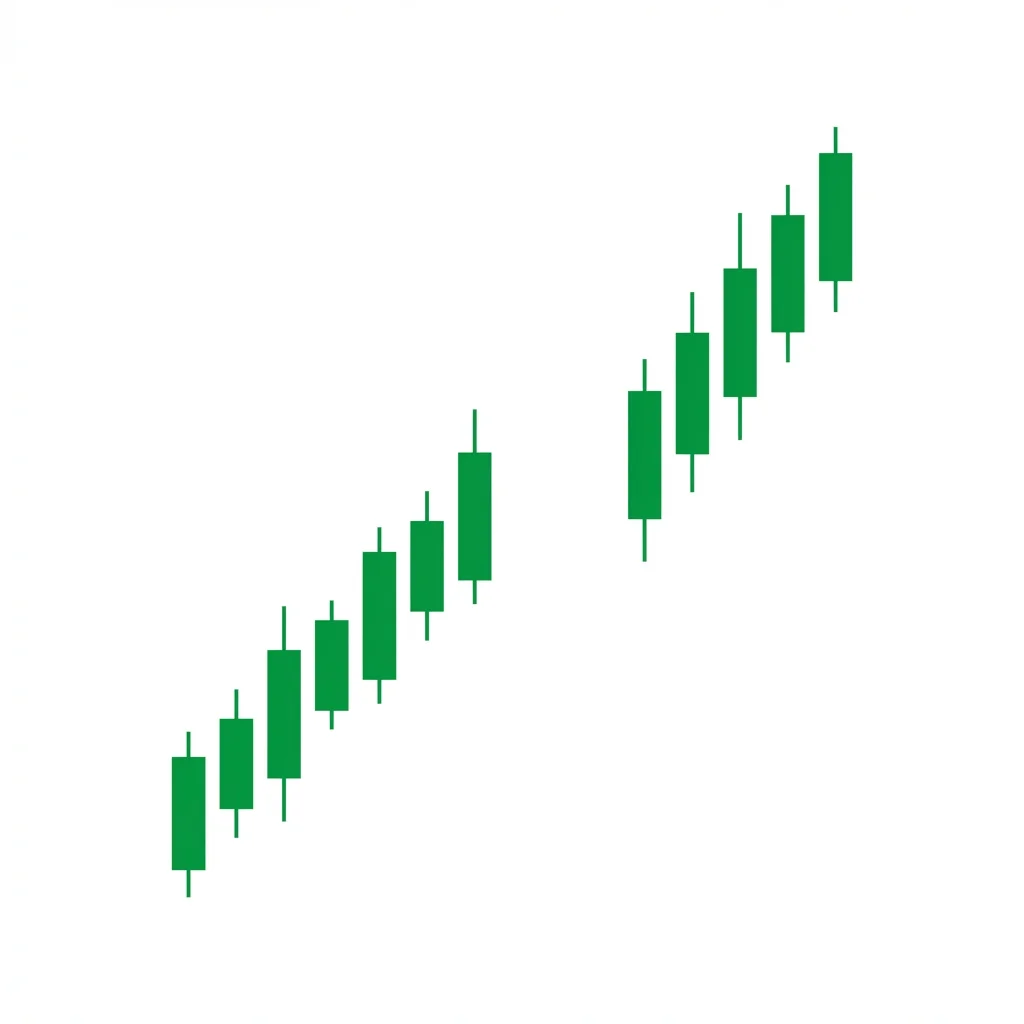
Bullish Higher Lows
The Higher Lows pattern is the most fundamental bullish structure, showing that buyers are willing to step in at progressively higher prices, indicating strengthening demand and a healthy uptrend.
Diff
Rel
bullishreversal4 candles
Bullish Hikkake
The Bullish Hikkake is a deceptive pattern that traps sellers with a false downside breakout of an inside bar, then reverses sharply higher as trapped shorts are forced to cover.
Diff
Rel
bullishcontinuation3 candles
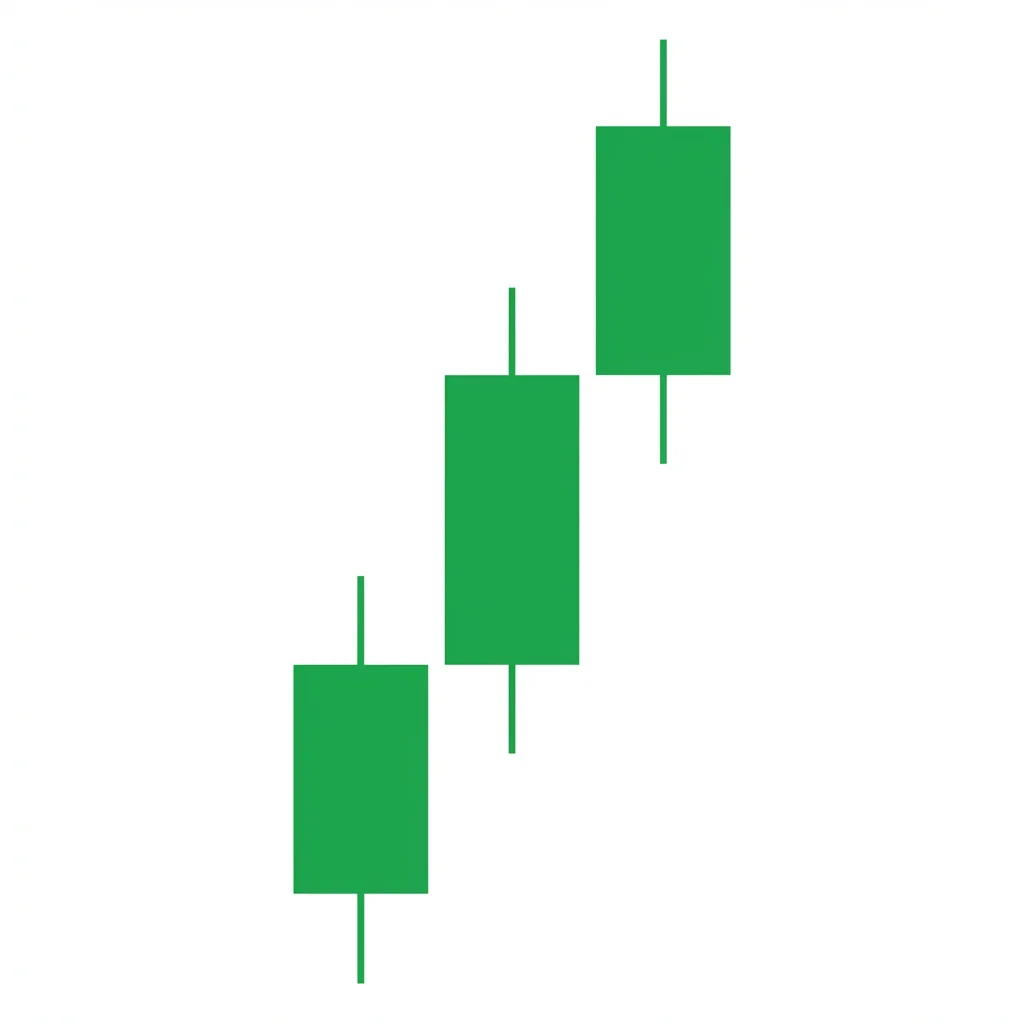
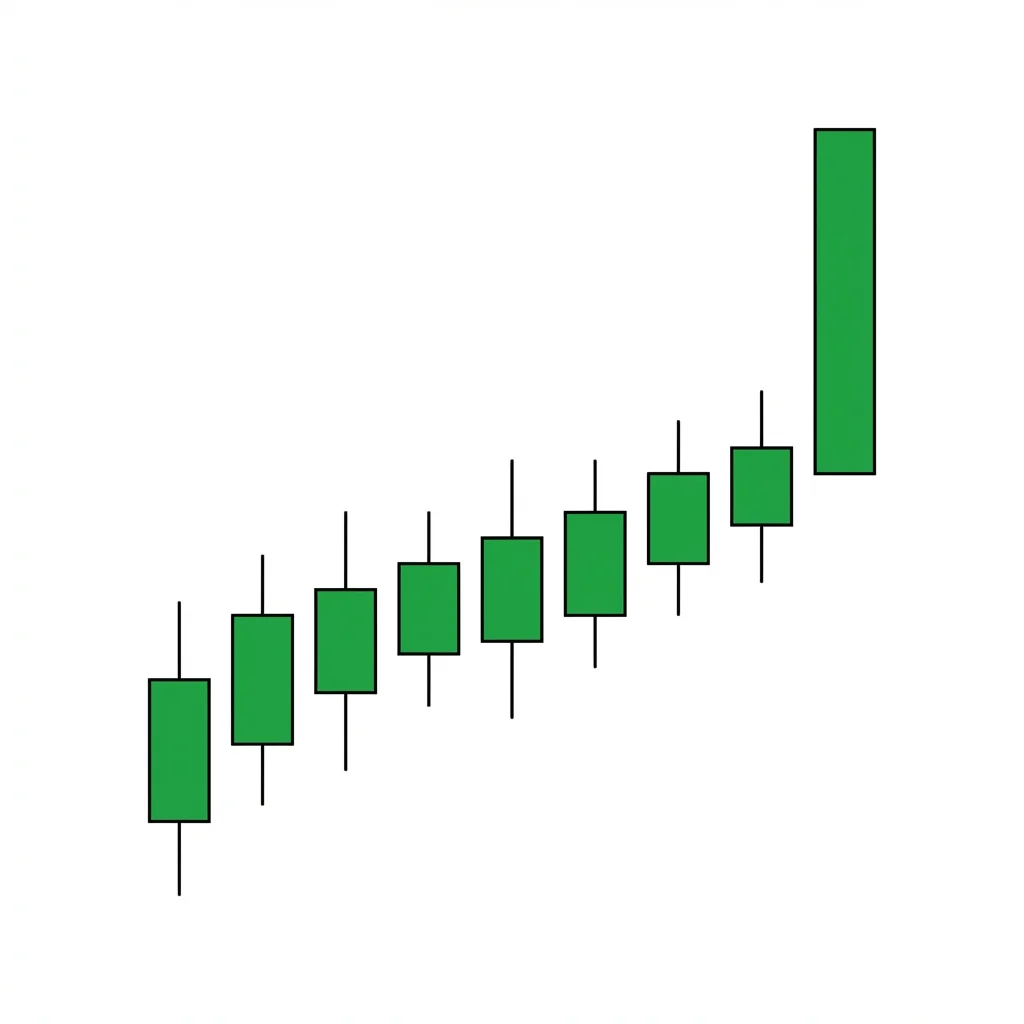
Bullish Identical Three Whites
Sanpei (三平)
Identical Three Whites is a variation of Three White Soldiers where the three bullish candles are of similar size, each opening at the prior close, indicating steady and controlled buying pressure.
Diff
Rel
bullishcontinuation40 candles
Bullish IHS Neckline Retest
The IHS Neckline Retest is a high-probability continuation entry after an inverse head and shoulders breakout. Price pulls back to test the broken neckline as new support, offering a second chance entry with a tighter stop.
Diff
Rel
bullishreversal50 candles
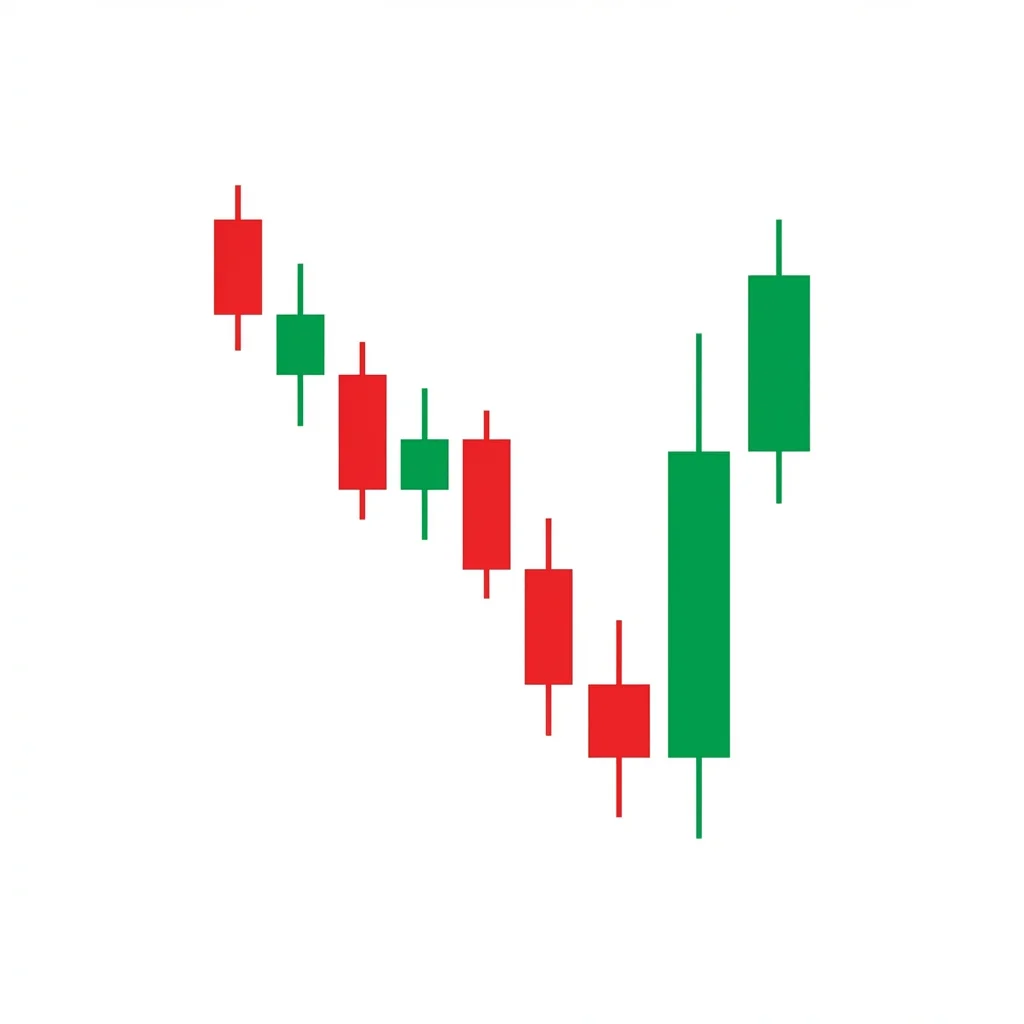
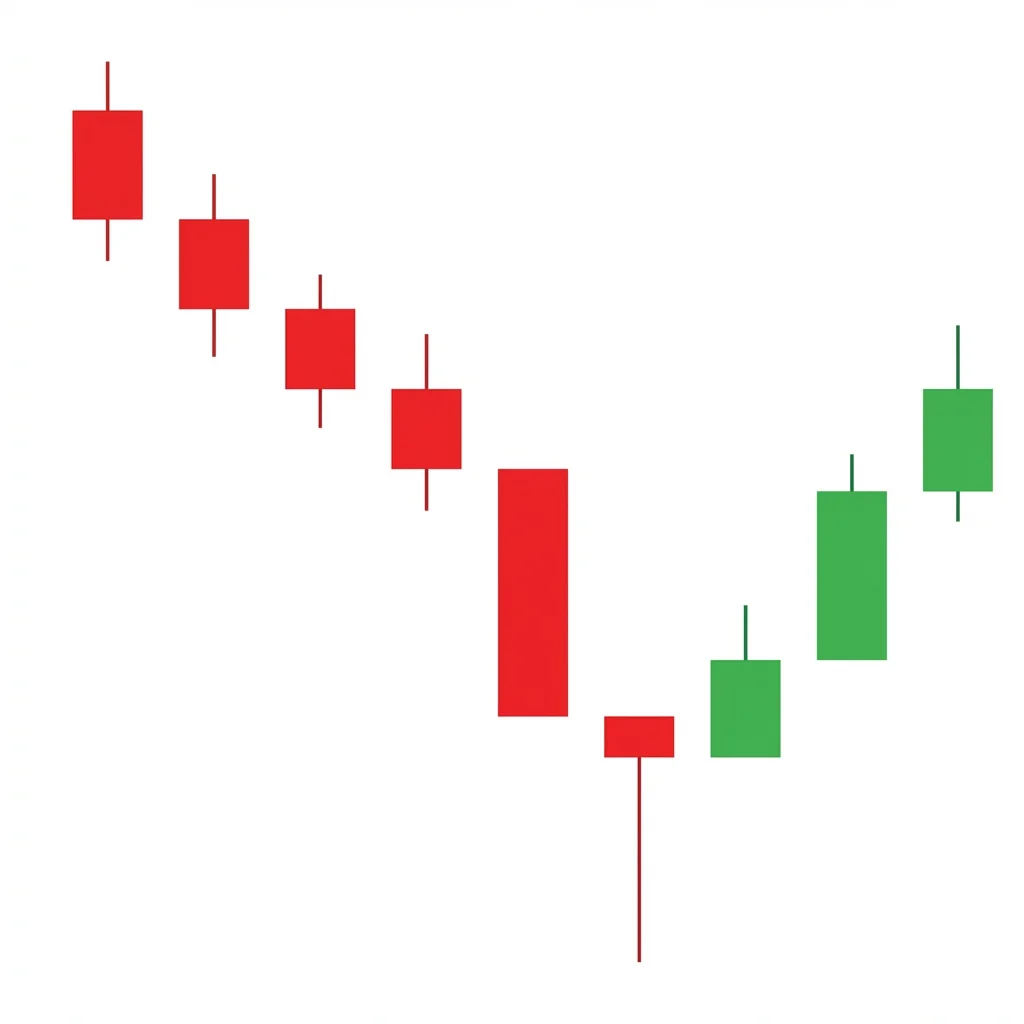
Bullish Inverse Head and Shoulders
The Inverse Head and Shoulders is one of the most reliable bullish reversal patterns, featuring three troughs with the middle one (head) being the deepest, signaling a major transition from a downtrend to an uptrend.
Diff
Rel
bullishreversal1 candle
Bullish Inverted Hammer
Tohba (倒バ)
The Inverted Hammer is a single-candle bullish reversal pattern appearing at the bottom of downtrends. Its long upper shadow shows buyers attempted to push price higher, hinting that the selling pressure may be ending.
Diff
Rel
bullishreversal5 candles
Bullish Island Reversal
The Bullish Island Reversal is a powerful gap-based reversal pattern where price gaps down to form an isolated cluster, then gaps back up, leaving behind an 'island' of price action that signals a dramatic shift in sentiment.
Diff
Rel
bullishreversal1 candle
Bullish Key Reversal
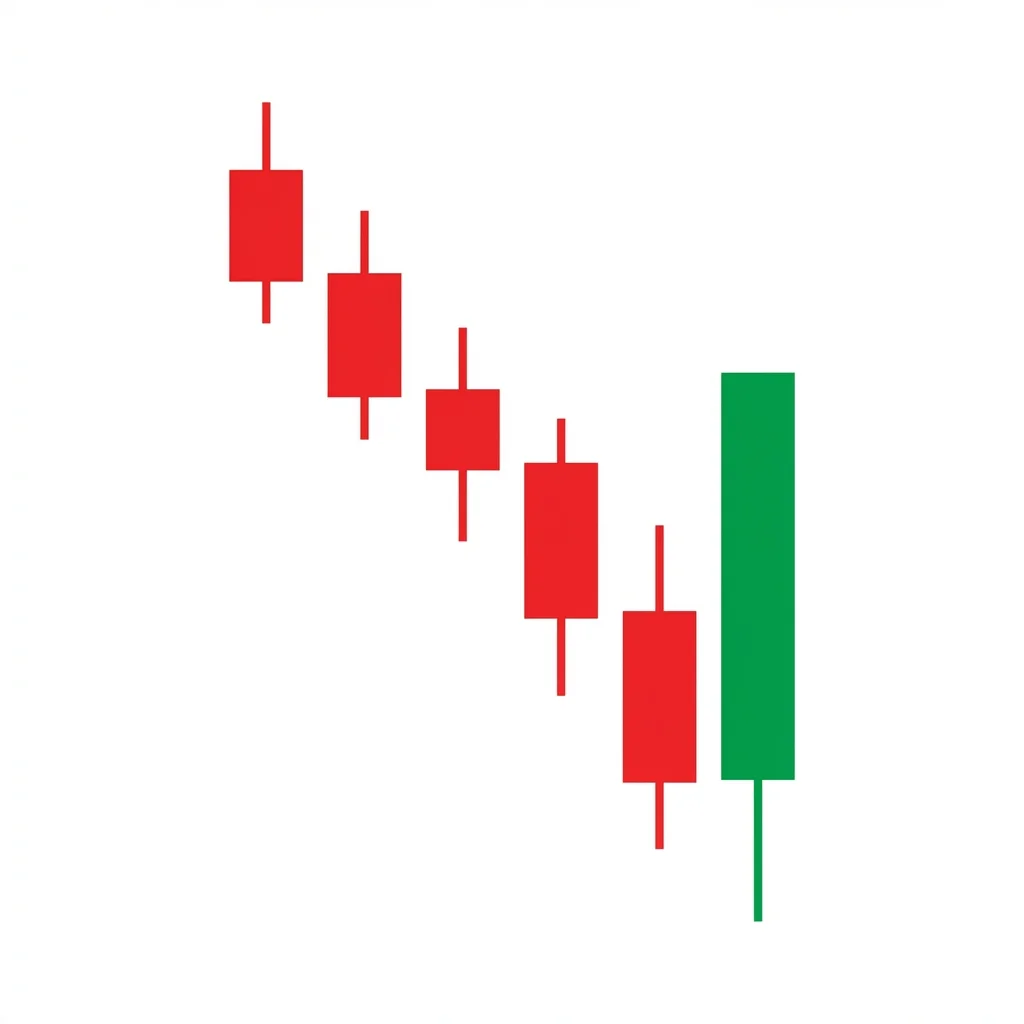
A Bullish Key Reversal occurs when price makes a new low during a downtrend but reverses to close above the prior bar's high on heavy volume, signaling a dramatic single-day shift in control from sellers to buyers.
Diff
Rel
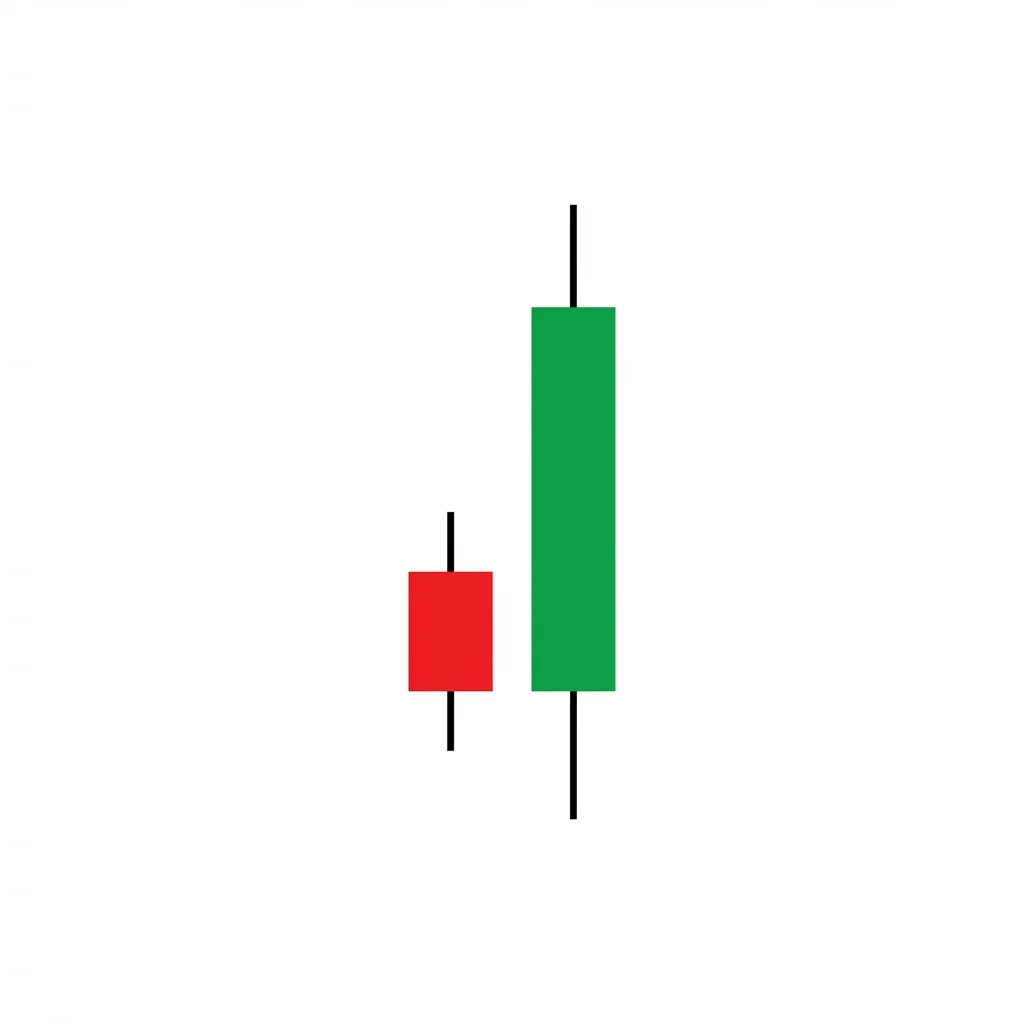
bullishreversal2 candles
Bullish Kicker
Keri Ashi (蹴り足)
The Bullish Kicker is one of the strongest two-candle reversal patterns. A bearish candle is followed by a bullish candle that gaps up to open at or above the prior candle's open, signaling an immediate and powerful shift in sentiment.
Diff
Rel
bullishreversal5 candles
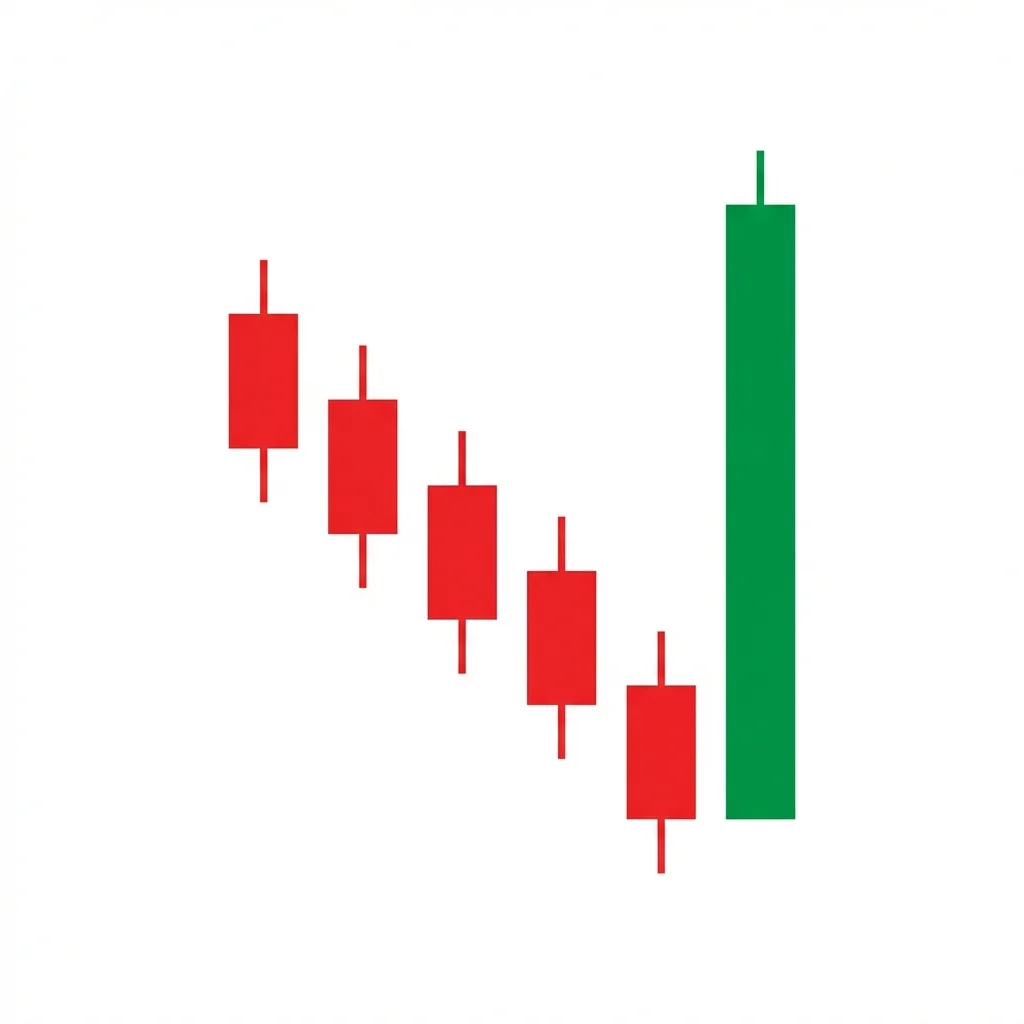
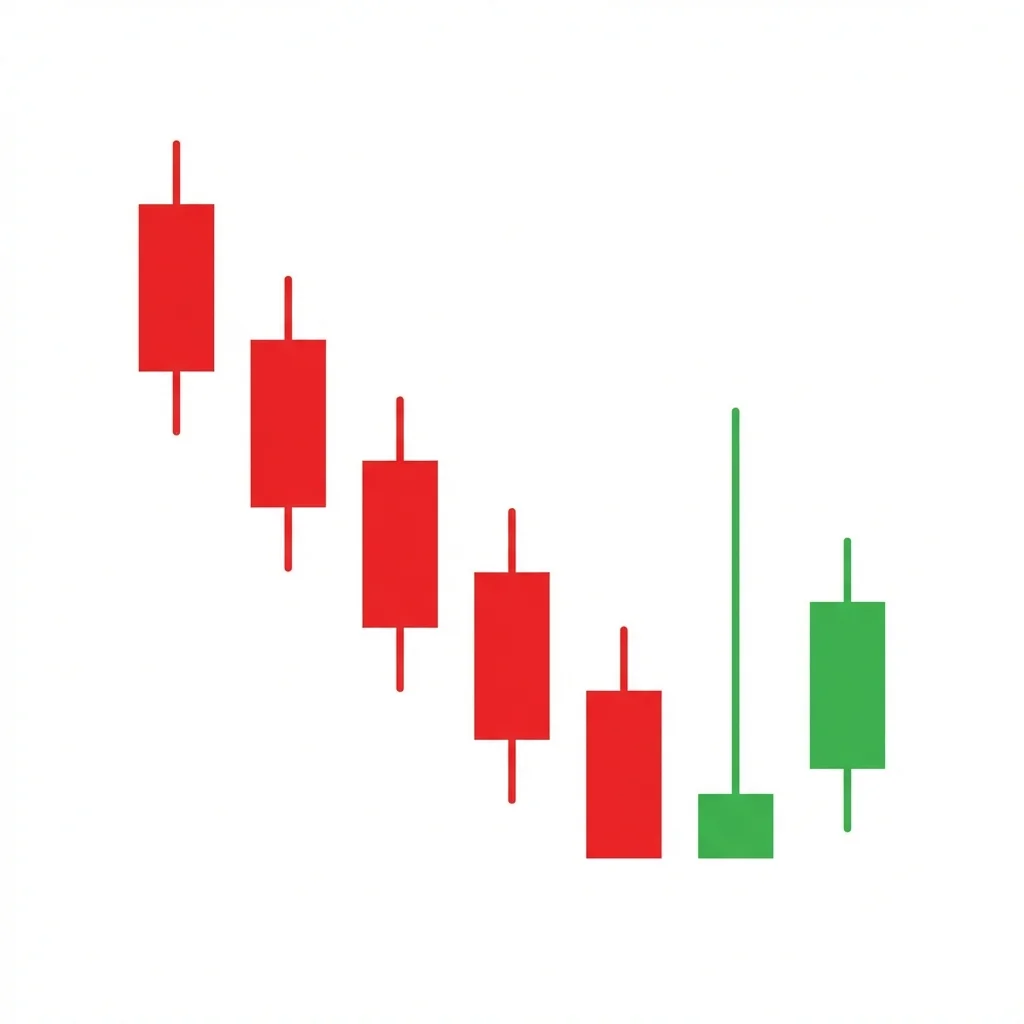
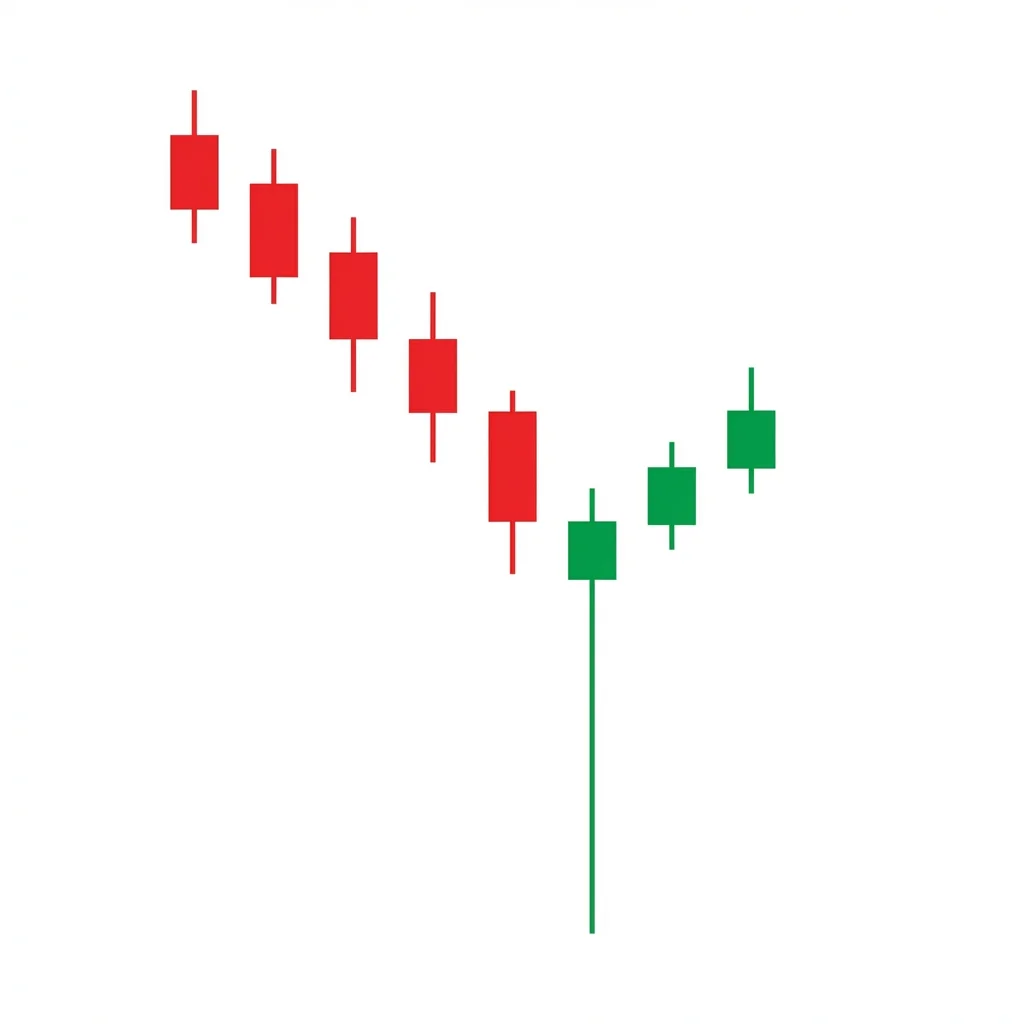
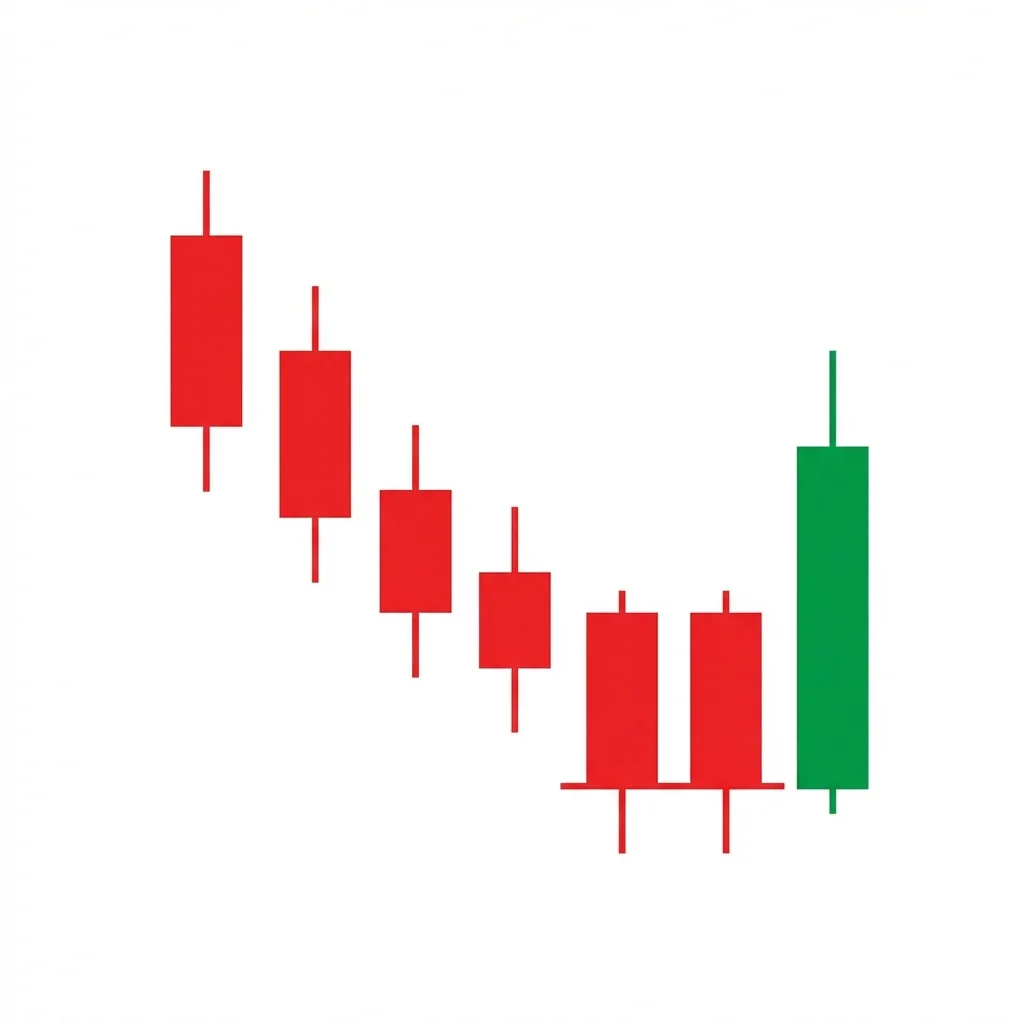
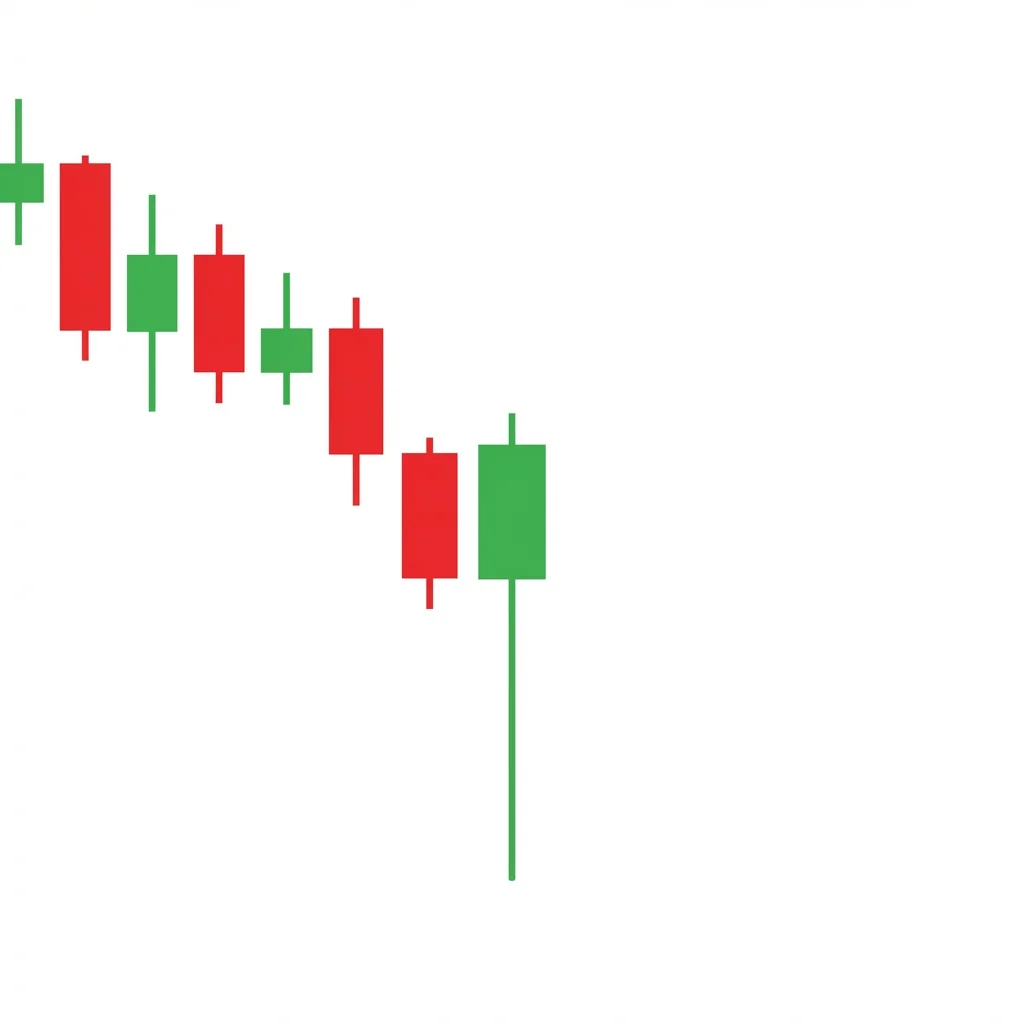
Bullish Ladder Bottom
Hashigo Gaeshi
The Ladder Bottom is a five-candle bullish reversal pattern where three descending bearish candles are followed by an exhaustion signal and a confirming bullish candle, resembling climbing down and then back up a ladder.
Diff
Rel
bullishreversal2 candles
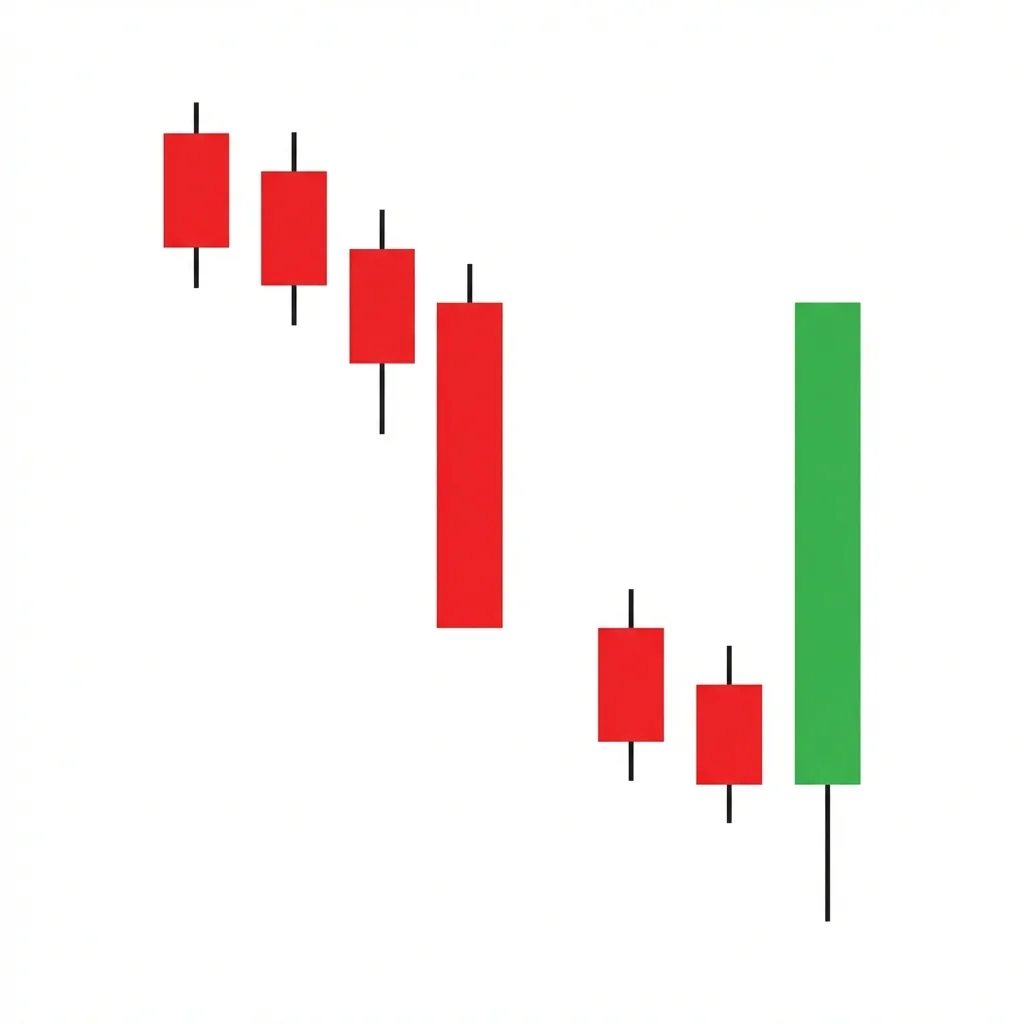
Bullish Last Engulfing Bottom
The Last Engulfing Bottom is a contrarian pattern where a bearish engulfing candle at the bottom of a downtrend turns out to be the final bearish push before a reversal — the bears' 'last gasp.'
Diff
Rel
bullishcontinuation15 candles
Bullish Last Kiss
The Last Kiss is a breakout pullback pattern where price returns to test a broken resistance level as new support one final time before continuing the advance — the 'last kiss goodbye' before leaving the old range behind.
Diff
Rel
bullishreversal1 candle
Bullish Long Lower Shadow
A candle with a long lower shadow signals that buyers aggressively rejected lower prices during the session, pushing price back up from the lows. This buying pressure suggests a potential bottom or support level.
Diff
Rel
bullishreversal10 candles
Bullish Market Structure Break
A Bullish Market Structure Break (MSB/BOS) occurs when price in a downtrend breaks above the most recent swing high, signaling that the series of lower highs has ended and a potential trend reversal is underway.
Diff
Rel
bullishcontinuation1 candle
Bullish Marubozu
Marubozu (丸坊主)
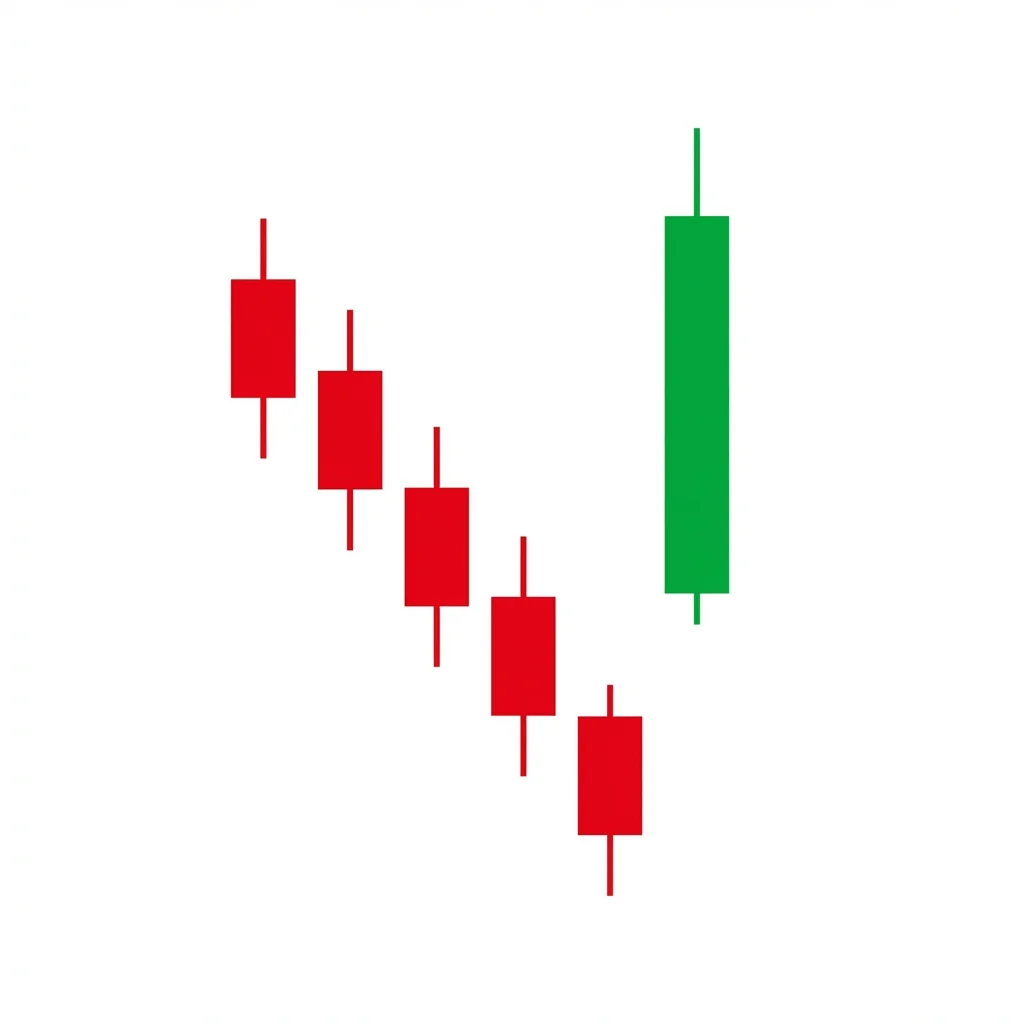
The Bullish Marubozu is a single candle with no shadows — it opens at the low and closes at the high, representing complete buyer dominance throughout the entire session with no seller resistance.
Diff
Rel
bullishcontinuation5 candles
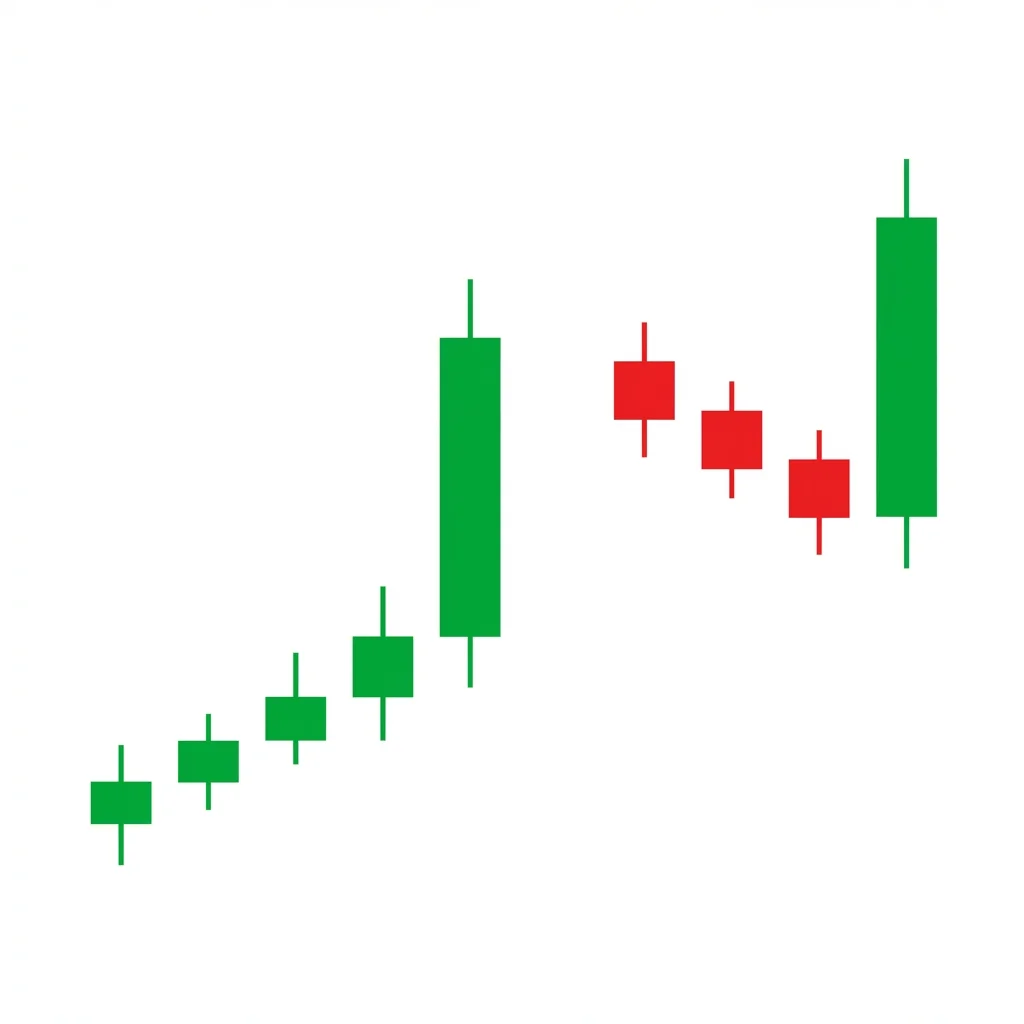
Bullish Mat Hold
Uwate Sanpoo Ohdatekomi
The Mat Hold is a five-candle bullish continuation pattern where a strong bullish candle is followed by a brief, shallow pullback of small bearish candles, then a final bullish candle resumes the advance — indicating the trend remains intact.
Diff
Rel
bullishreversal2 candles
Bullish Matching Low
Kenuki (毛抜き底の変形)
The Matching Low is a two-candle bullish reversal pattern where two consecutive bearish candles close at the same price, indicating a support level that sellers cannot breach.
Diff
Rel
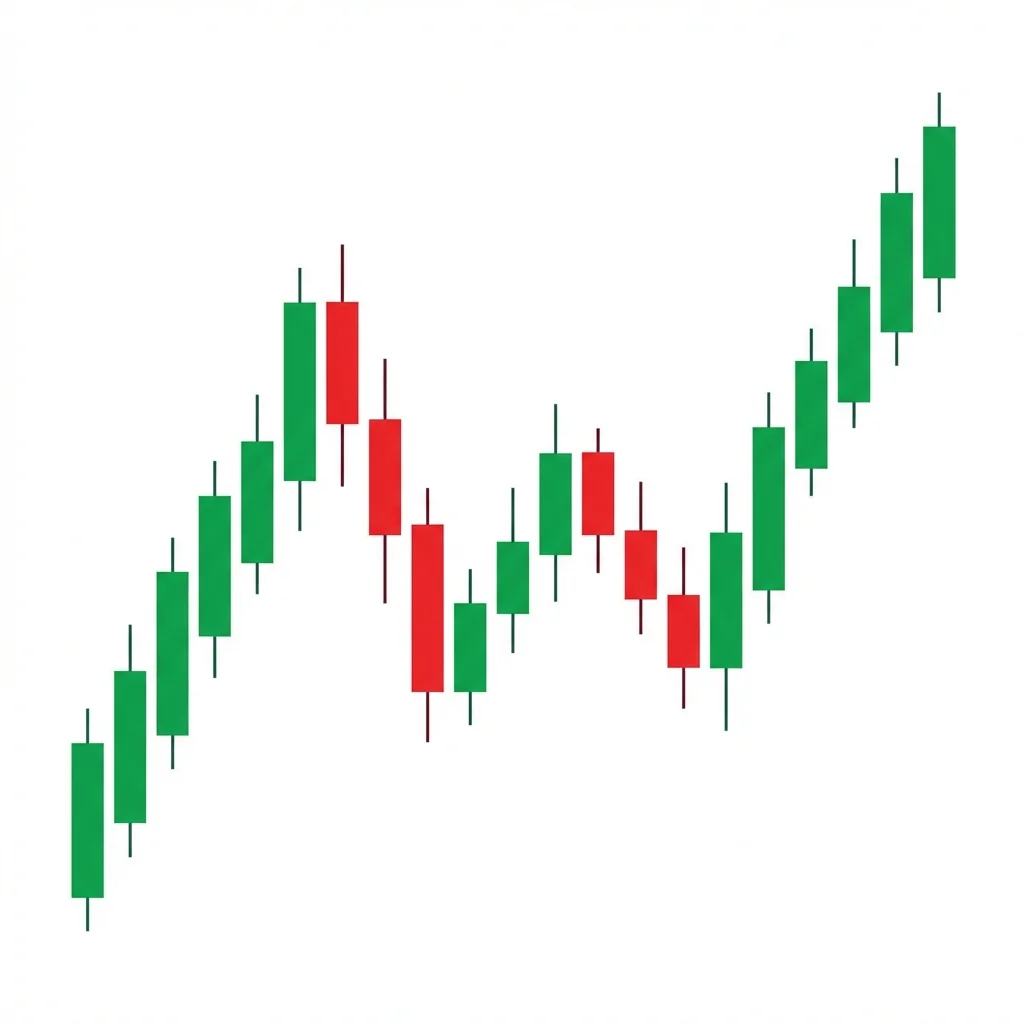
bullishcontinuation20 candles
Bullish Measured Move Up
The Measured Move Up is a bullish pattern where two rally legs of approximately equal length are separated by a correction, allowing traders to project the second leg's target by measuring the first leg's distance.
Diff
Rel
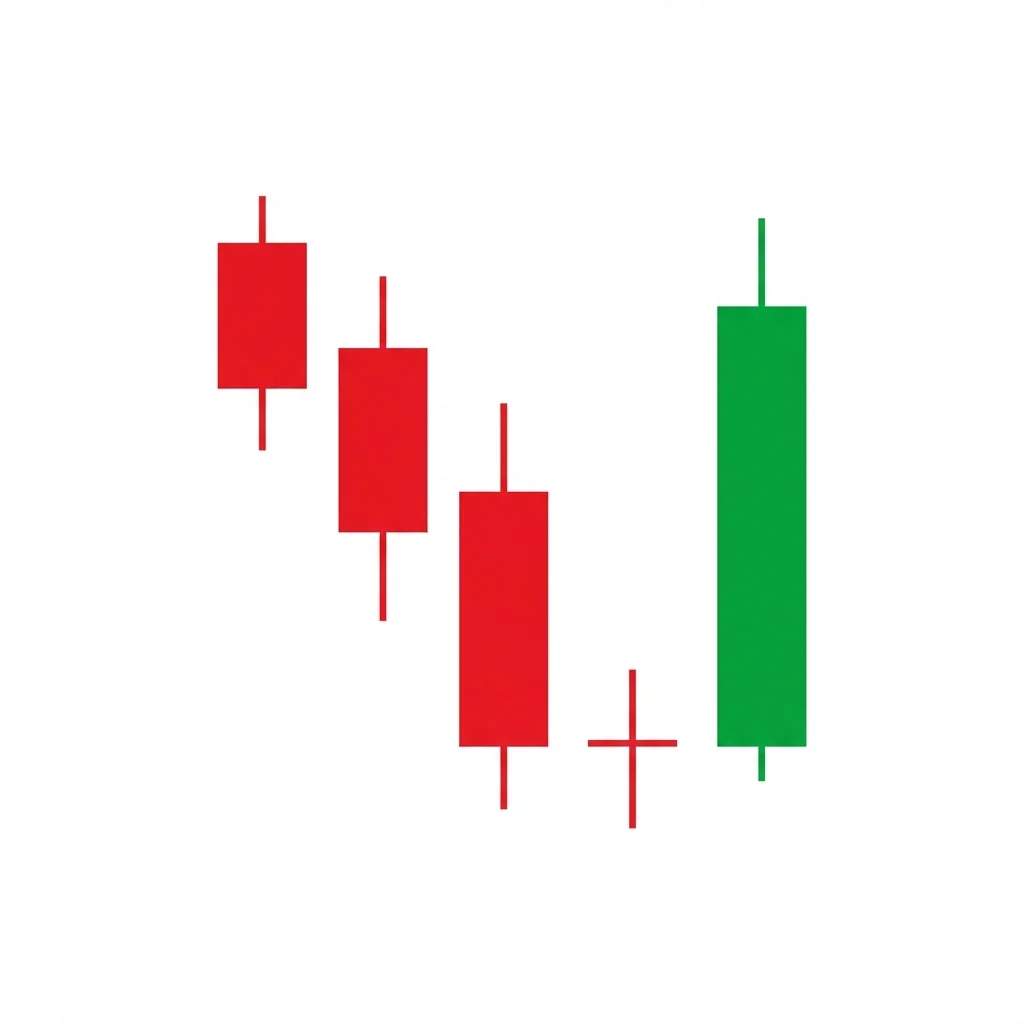
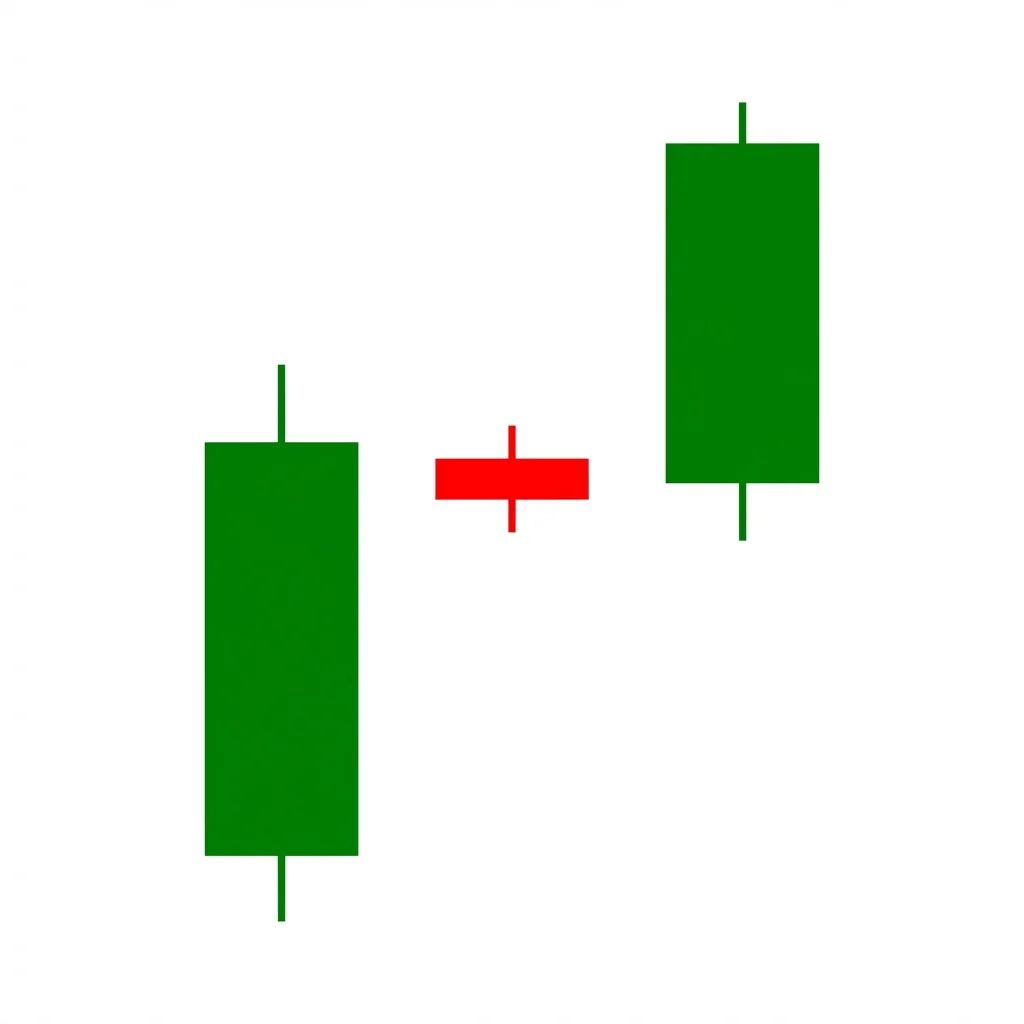
bullishreversal3 candles
Bullish Morning Doji Star
Ake no Myojyo Doji
The Morning Doji Star is a three-candle bullish reversal pattern where a bearish candle, a gapped-down doji, and a strong bullish candle combine to signal a decisive bottom — more powerful than the standard Morning Star due to the doji's complete indecision signal.
Diff
Rel
bullishreversal3 candles
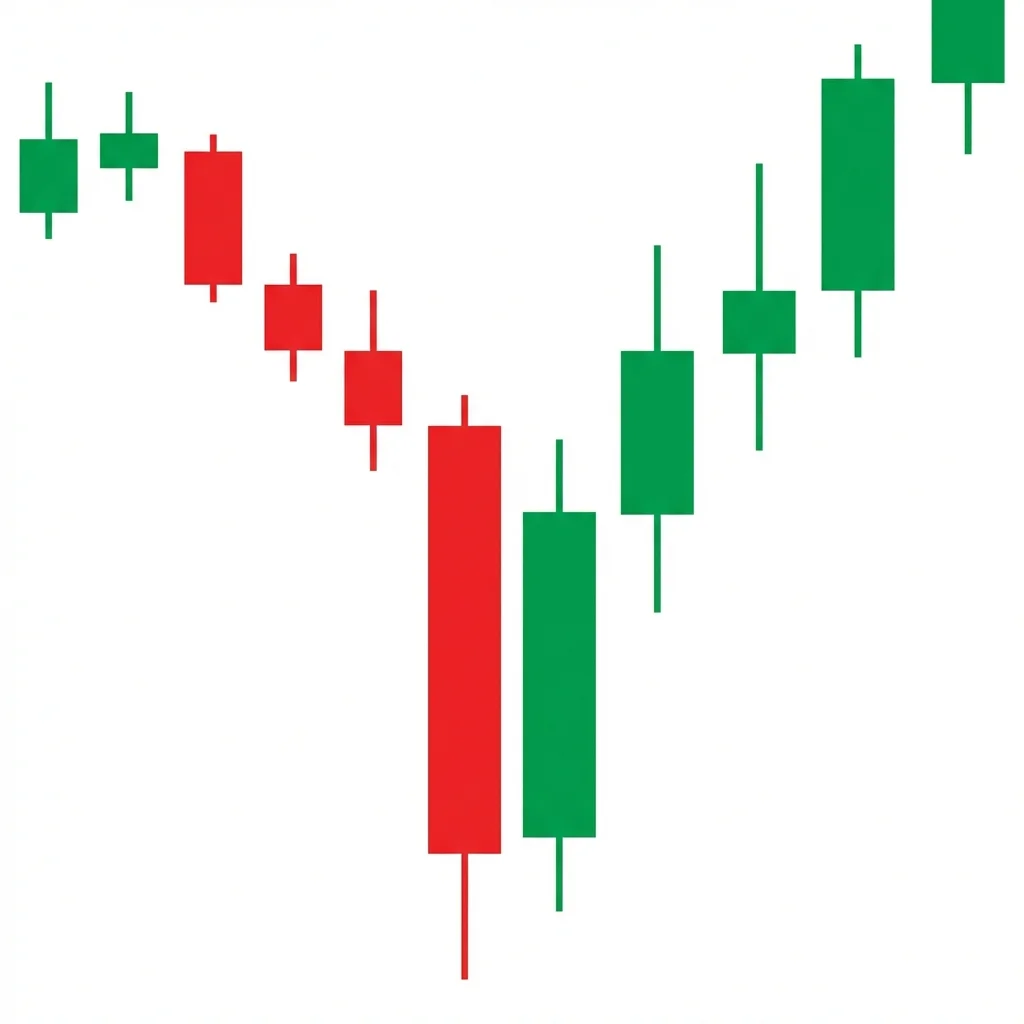
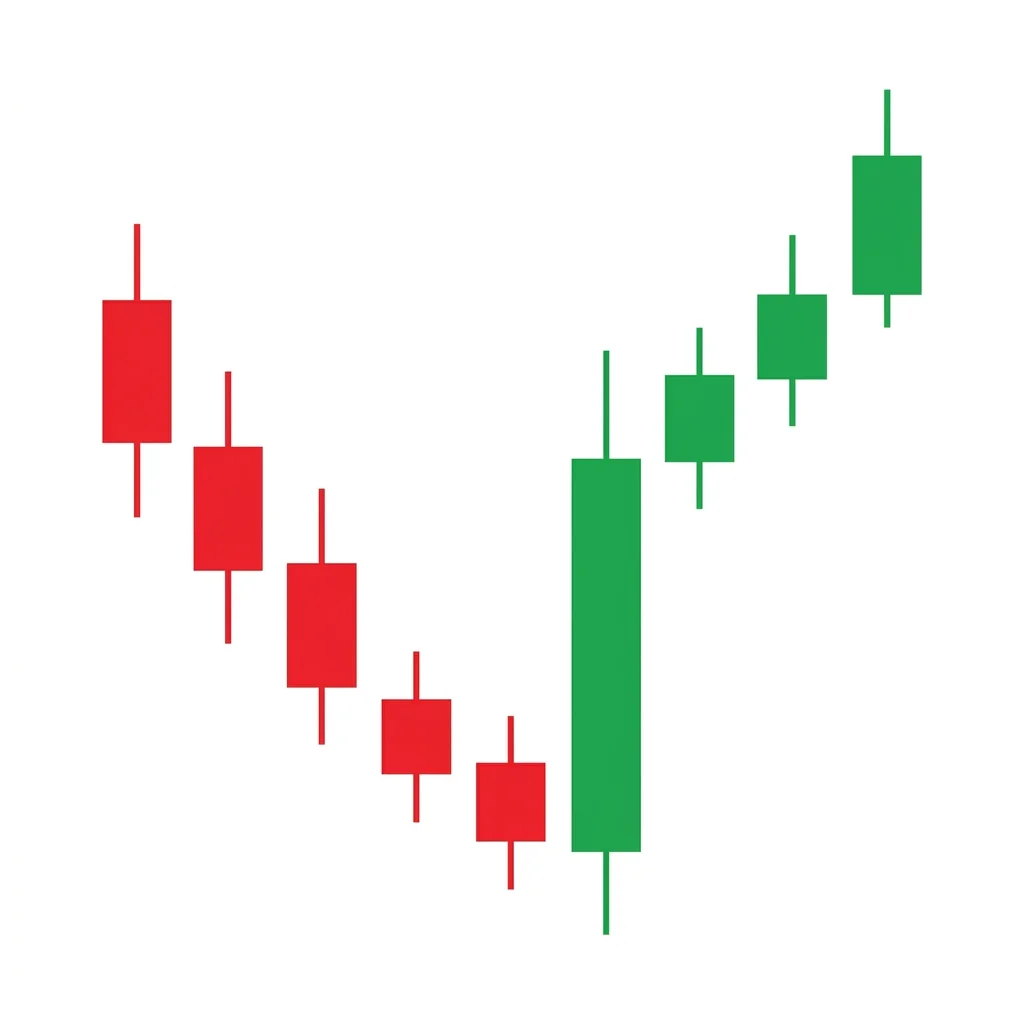
Bullish Morning Star
Ake no Myojyo (明けの明星)
The Morning Star is a three-candle bullish reversal pattern consisting of a large bearish candle, a small star candle showing indecision, and a large bullish candle confirming the reversal. It is one of the most widely recognized and reliable bottom reversal signals.
Diff
Rel
bullishreversal3 candles
Bullish Morning Star Gap
The Morning Star Gap is an enhanced version of the Morning Star where the star candle is isolated by gaps on both sides, creating a more powerful reversal signal. This double-gap structure is essentially an island reversal within a morning star framework.
Diff
Rel

bullishcontinuation1 candle
Bullish Opening Marubozu
Yoritsuki Marubozu
The Opening Marubozu is a bullish candle with no lower shadow — the open IS the low — showing that from the moment the session opened, buyers were in control and never let price trade below the open.
Diff
Rel
bullishreversal5 candles
Bullish Order Block
A Bullish Order Block is the last bearish candle before a strong upside displacement. It marks where institutional buying occurred, and when price returns to this zone, it often bounces as institutions defend their entry level.
Diff
Rel
bullishreversal2 candles
Bullish Outside Reversal
The Bullish Outside Reversal is a two-bar pattern where the second bar has a wider range than the first, trading both below its low and above its high before closing bullish. This dramatic range expansion signals a powerful shift from bearish to bullish control.
Diff
Rel
bullishcontinuation15 candles
Bullish Pennant
The Bullish Pennant is a continuation pattern featuring a sharp advance (flagpole) followed by a brief triangular consolidation (pennant), before price breaks out and continues higher with a measured move equal to the flagpole.
Diff
Rel
bullishreversal2 candles
Bullish Piercing Line
Kirikomi (切り込み線)
The Piercing Line is a two-candle bullish reversal pattern where a bearish candle is followed by a bullish candle that opens below the low and 'pierces' above the midpoint of the first candle's body, showing strong buying recovery.
Diff
Rel
bullishreversal2 candles
Bullish Pipe Bottom
The Pipe Bottom is a two-candle bullish reversal pattern featuring two adjacent candles with long lower shadows at similar levels, resembling parallel pipes. The double rejection of lower prices creates a powerful support floor signaling a potential bottom.
Diff
Rel
bullishreversal3 candles
Bullish Power of Three
The Bullish Power of Three (AMD) is an ICT concept describing a three-phase market cycle: accumulation in a range, manipulation below the range to grab liquidity, followed by distribution as price rallies aggressively higher.
Diff
Rel
bullishcontinuation20 candles
Bullish Reaccumulation
Bullish Reaccumulation is a Wyckoff continuation pattern where institutions pause an uptrend to absorb supply and build additional positions within a trading range before continuing the markup phase.
Diff
Rel
bullishcontinuation10 candles
Bullish Rectangle Breakout
The Bullish Rectangle Breakout is a continuation pattern where price consolidates between horizontal support and resistance before breaking above the upper boundary to resume the uptrend.
Diff
Rel
bullishcontinuation5 candles
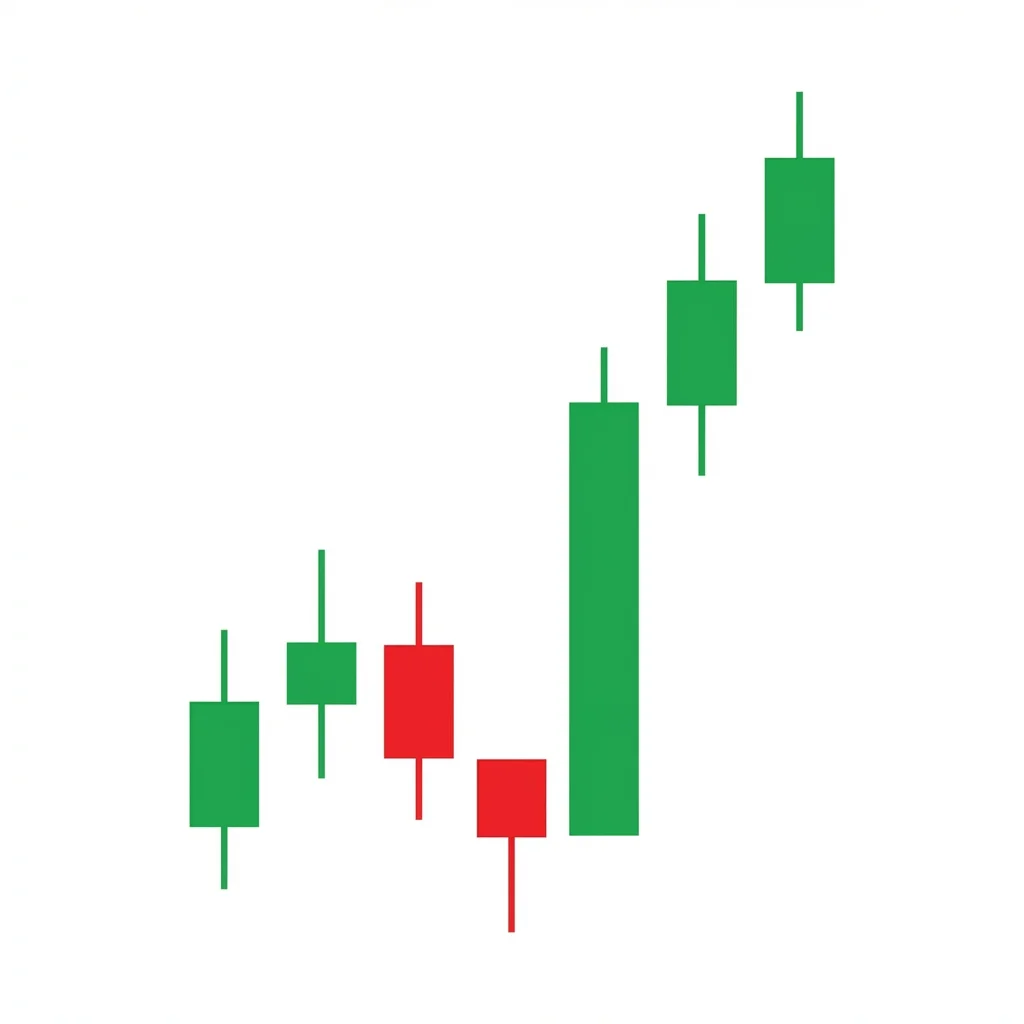
Bullish Rising Three Methods
Uwa Banare Sanpoo Ohdatekomi
The Rising Three Methods is a five-candle bullish continuation pattern where a long bullish candle is followed by three small bearish candles within its range, then a final bullish candle closes above the first, confirming the uptrend will continue.
Diff
Rel
bullishcontinuation2 candles
Bullish Rising Window
Mado (窓)
The Bullish Rising Window is a gap-up pattern where the second candle's low is entirely above the first candle's high, creating a visible window (gap) that acts as future support and signals trend continuation.
Diff
Rel
bullishreversal30 candles
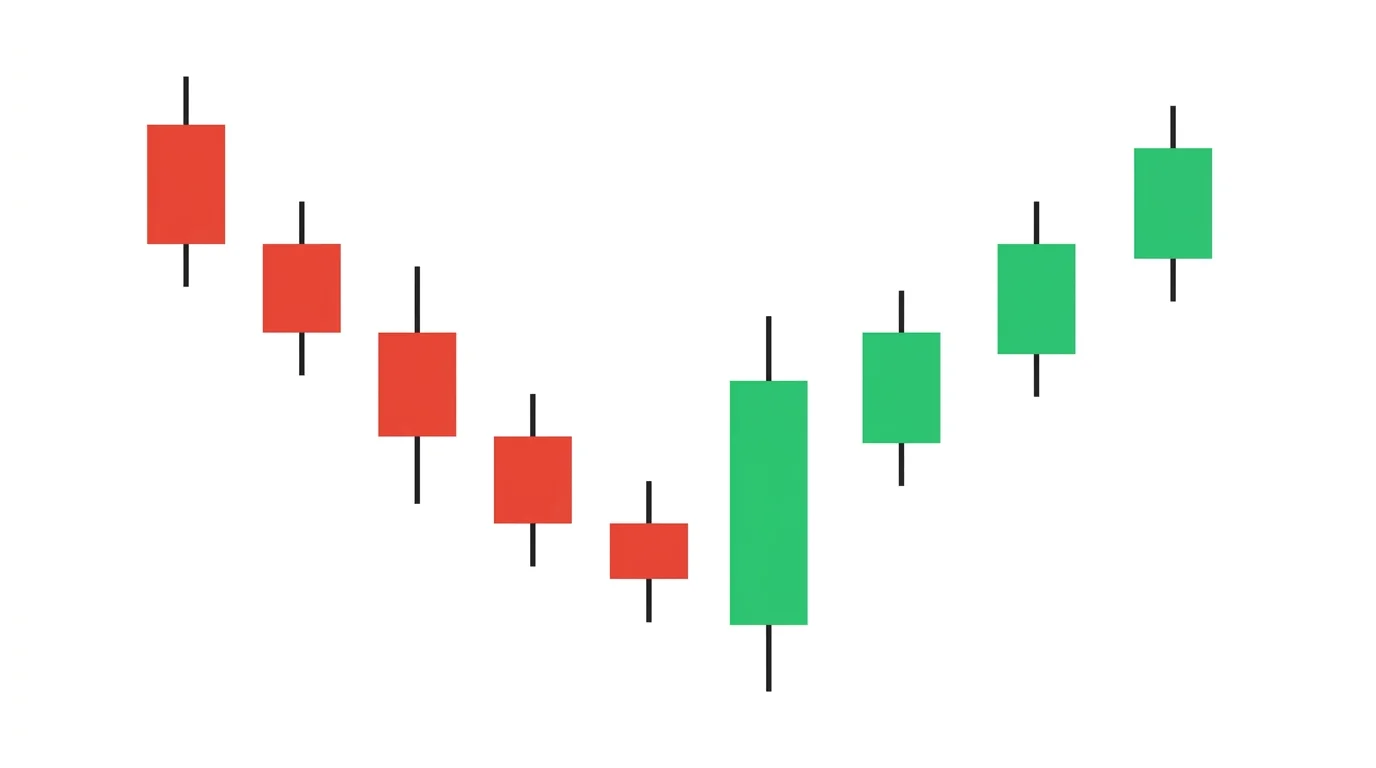
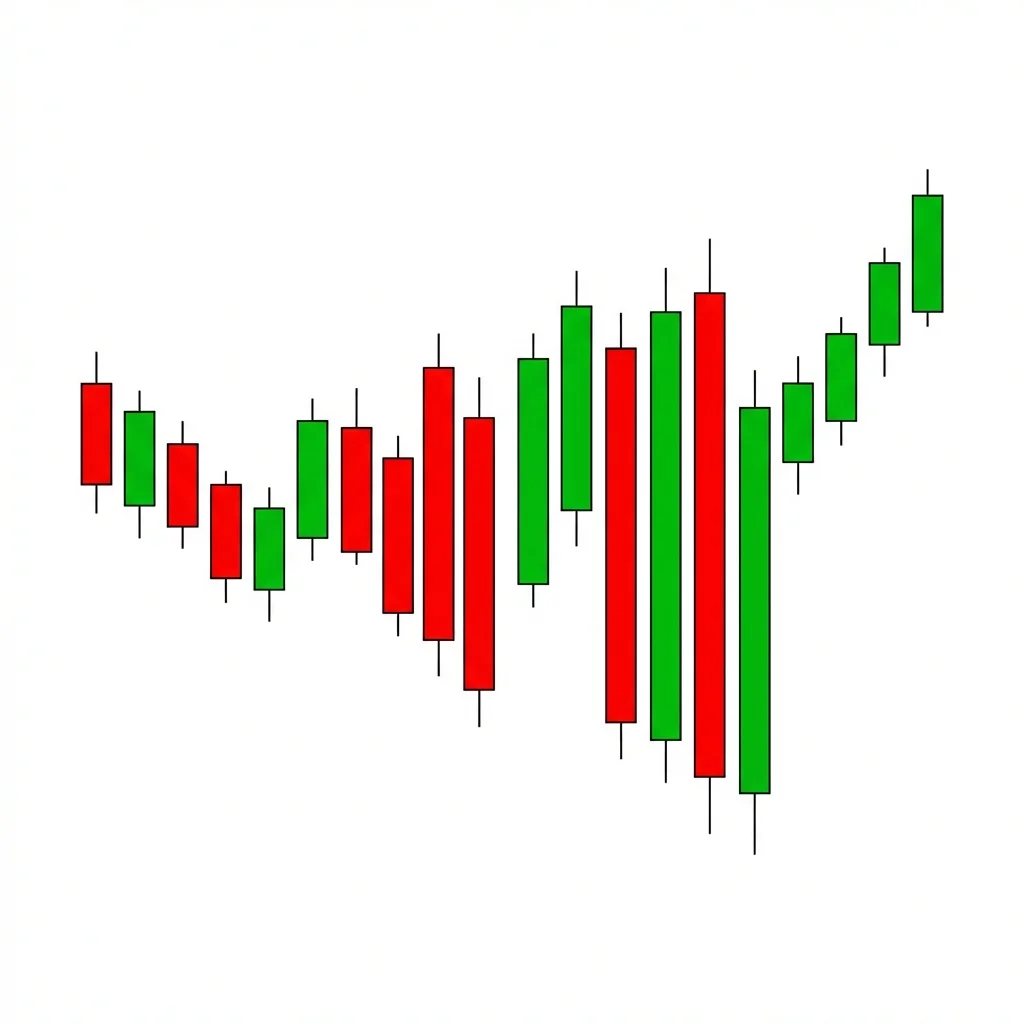
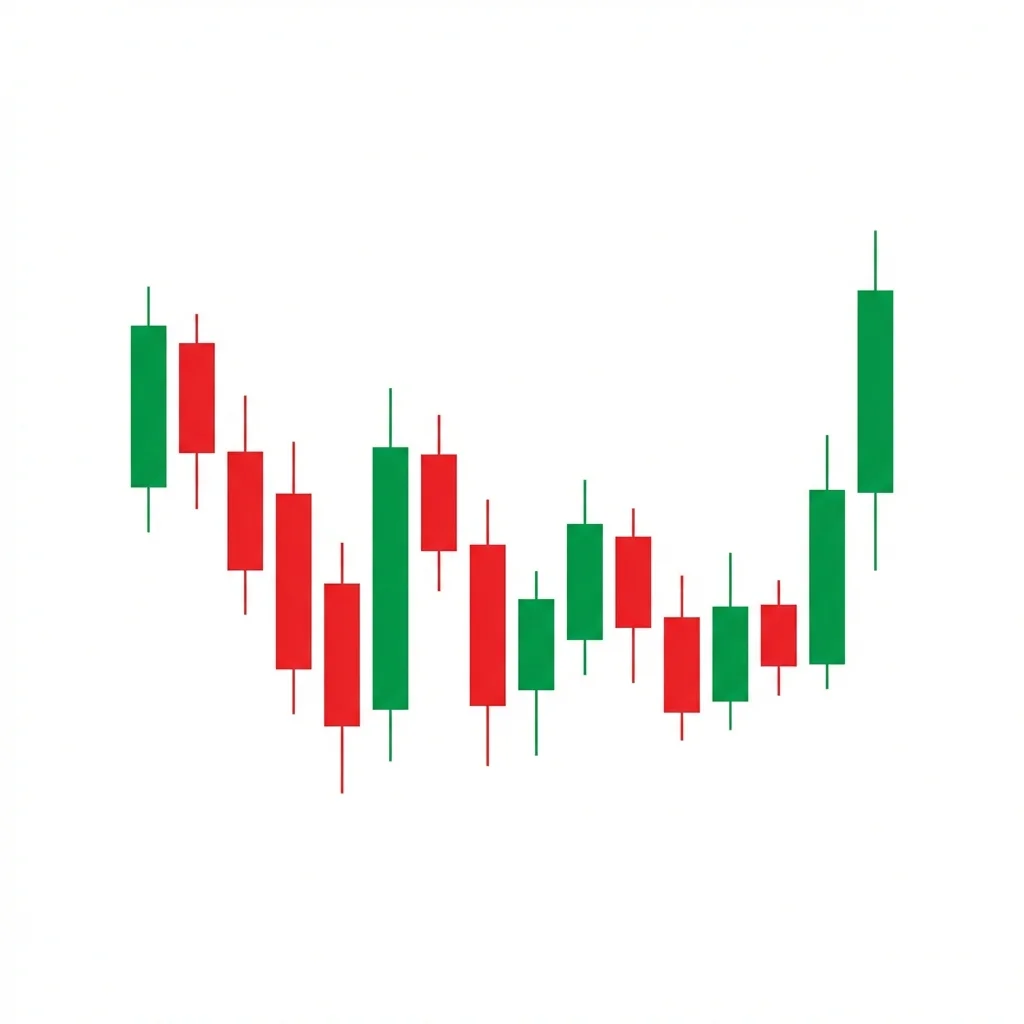
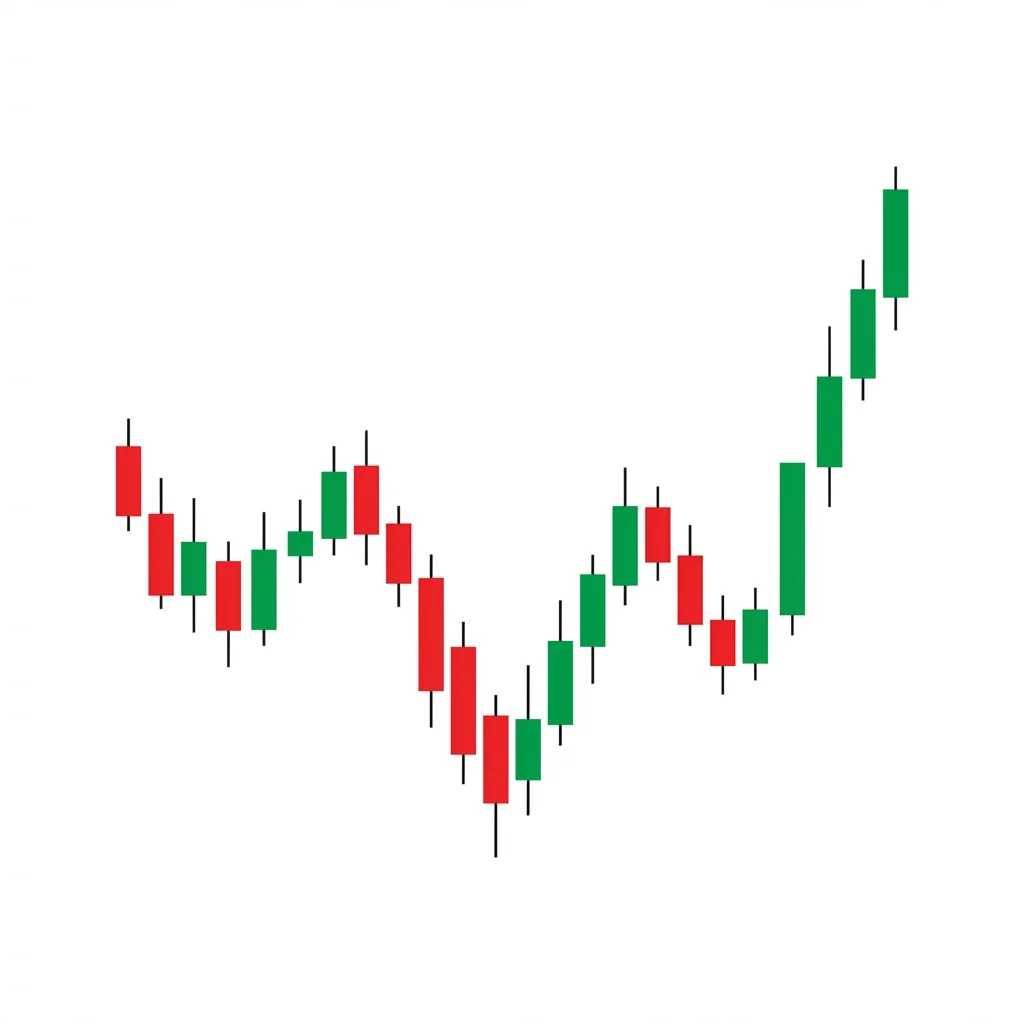
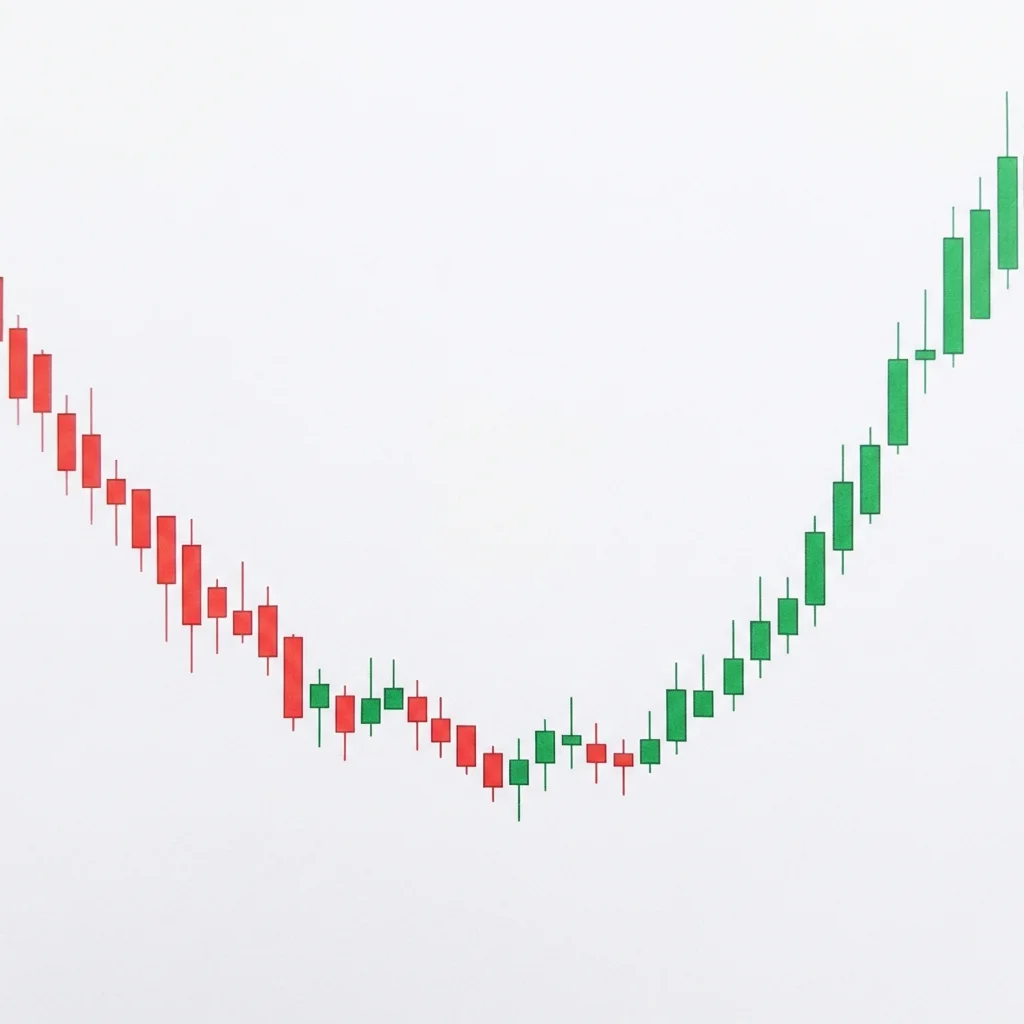
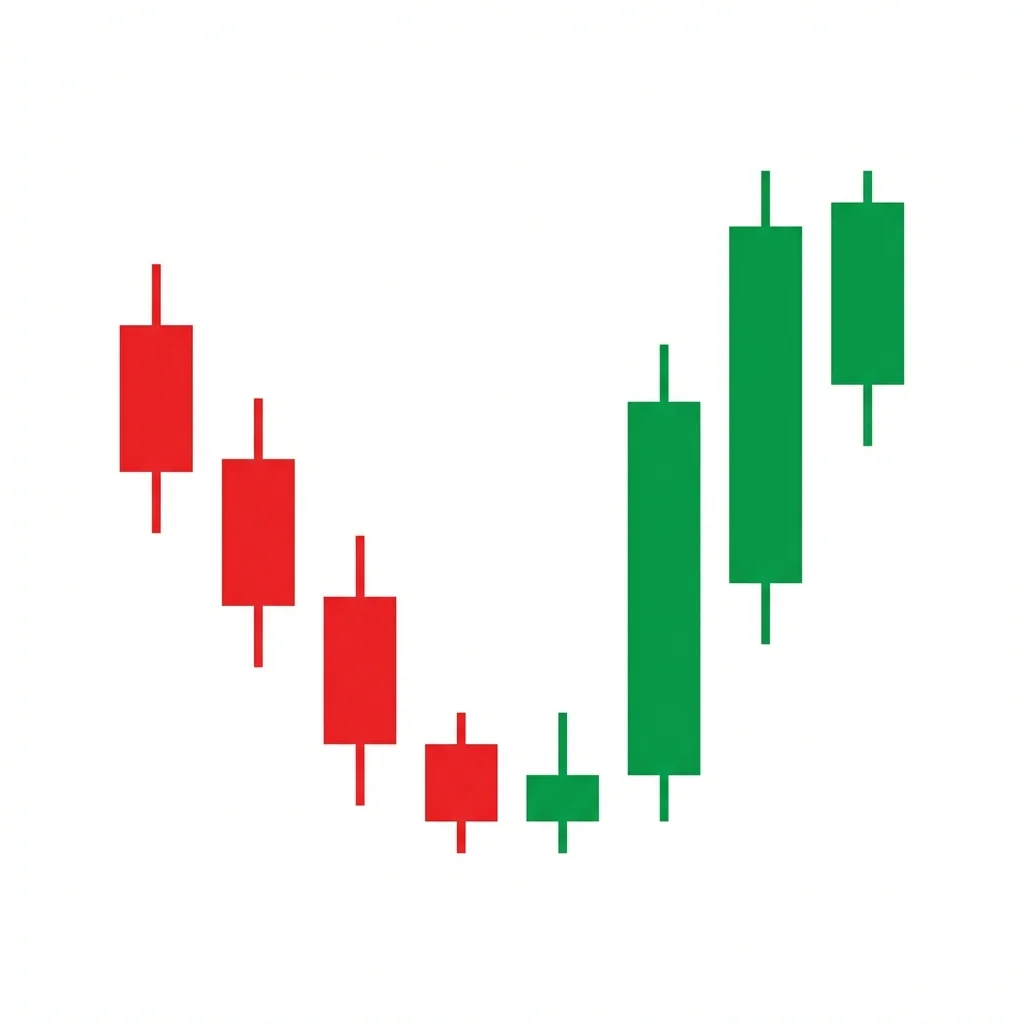
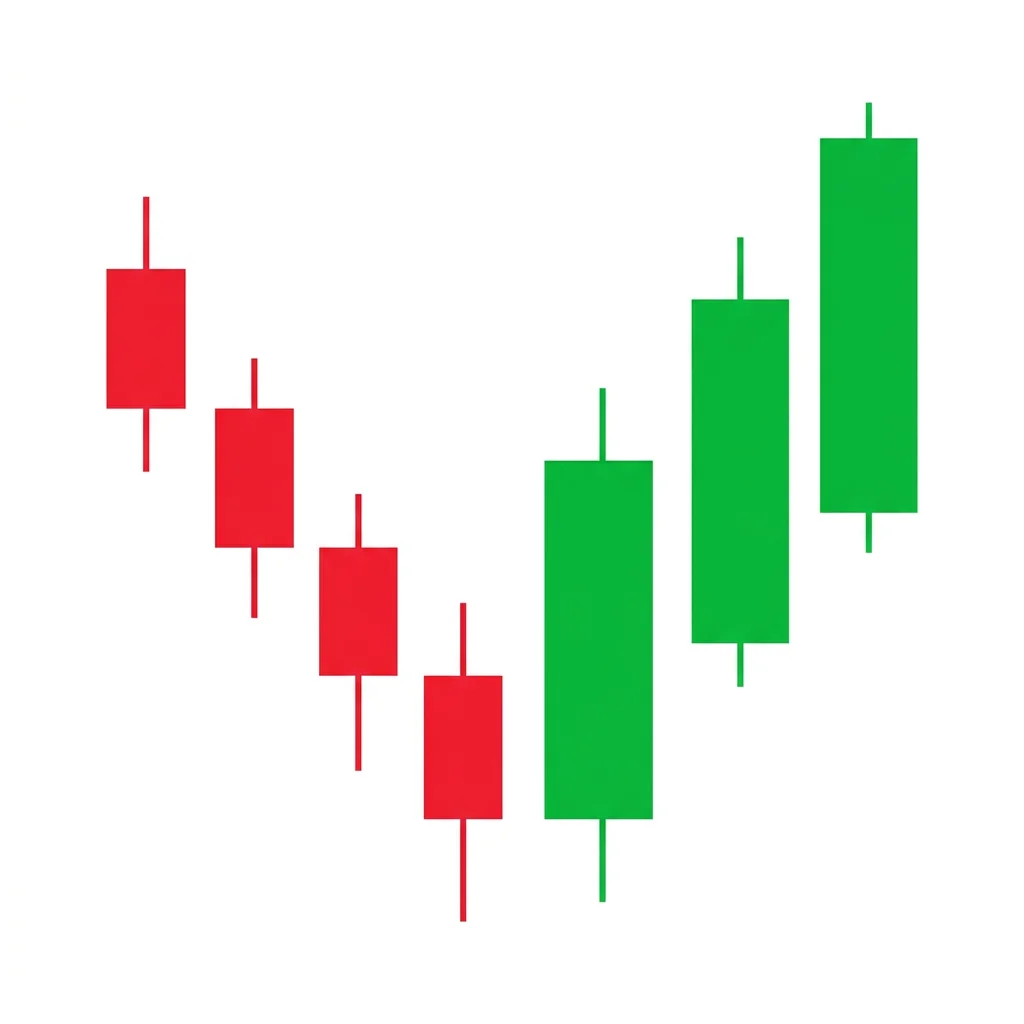
Bullish Rounding Bottom
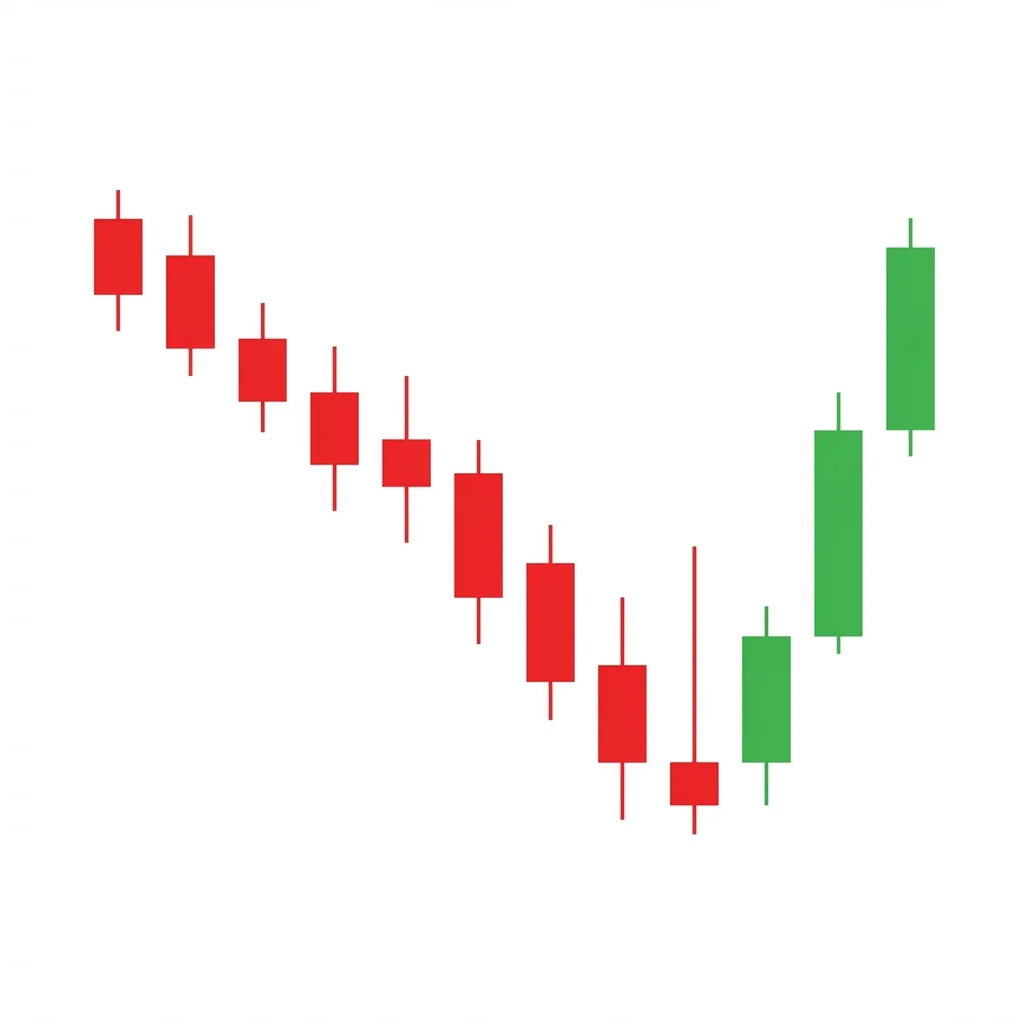
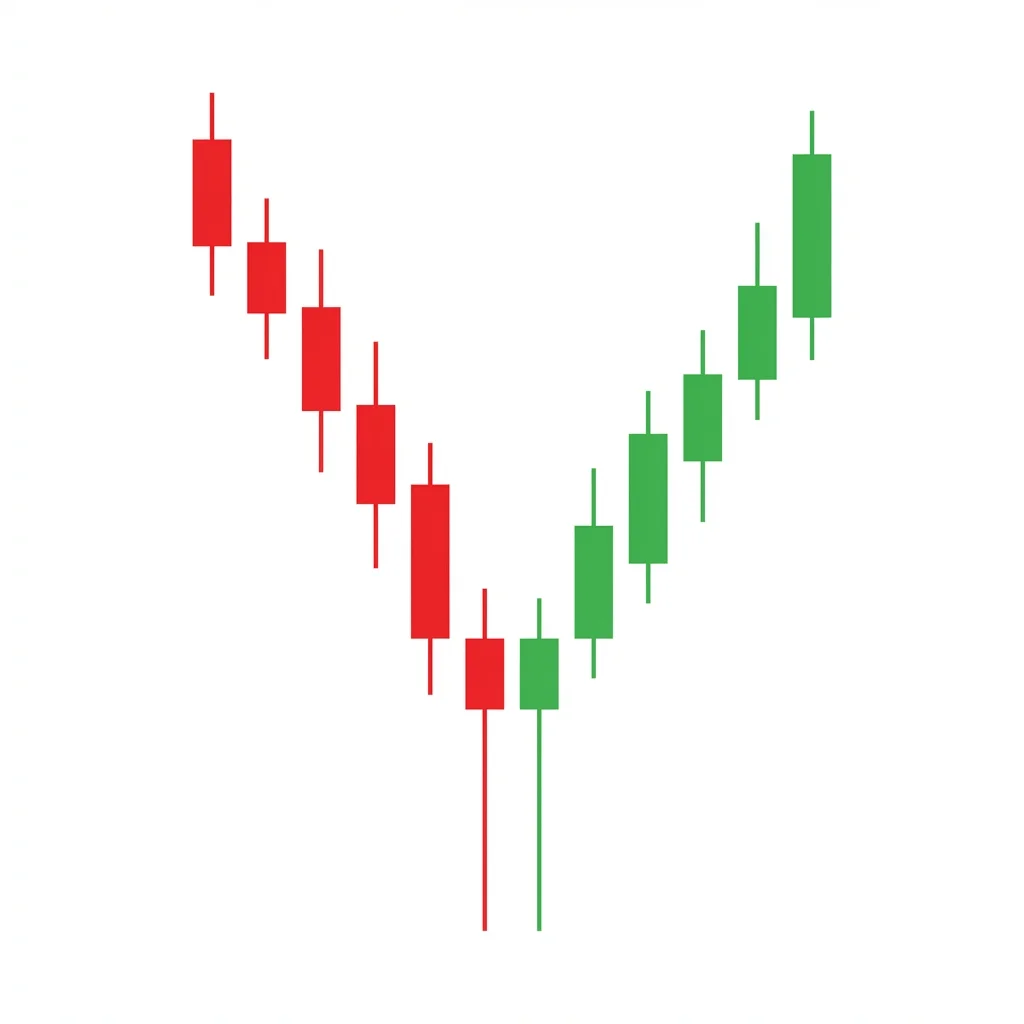
The Bullish Rounding Bottom (Saucer Bottom) is a long-term reversal pattern that forms a U-shaped curve as selling pressure gradually gives way to buying pressure, signaling a major trend change from bearish to bullish.
Diff
Rel
bullishcontinuation2 candles
Bullish Runaway Gap
The Bullish Runaway Gap (Measuring Gap) occurs in the middle of a strong uptrend, signaling that the trend has strong momentum and is likely to continue. It can also be used to project the trend's target — the distance from the trend start to the gap is projected above the gap.
Diff
Rel
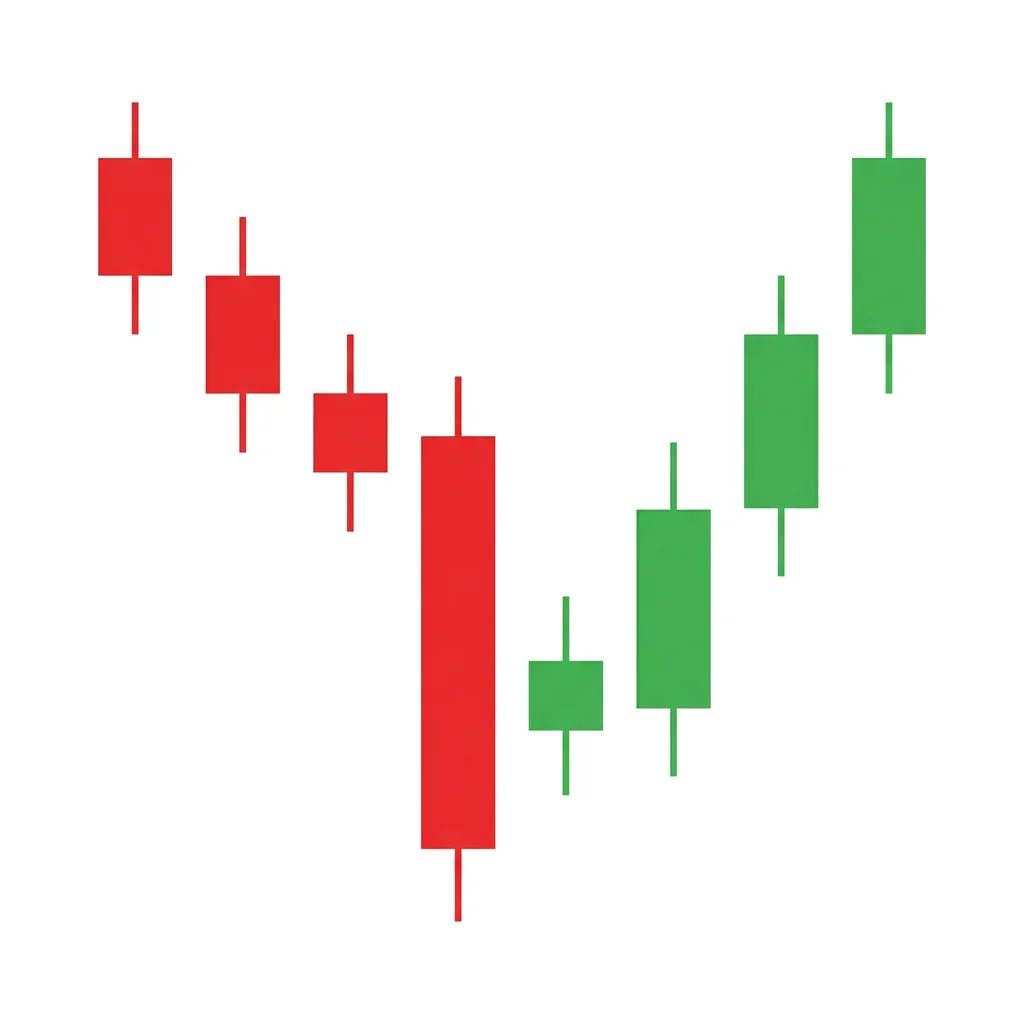
bullishreversal3 candles
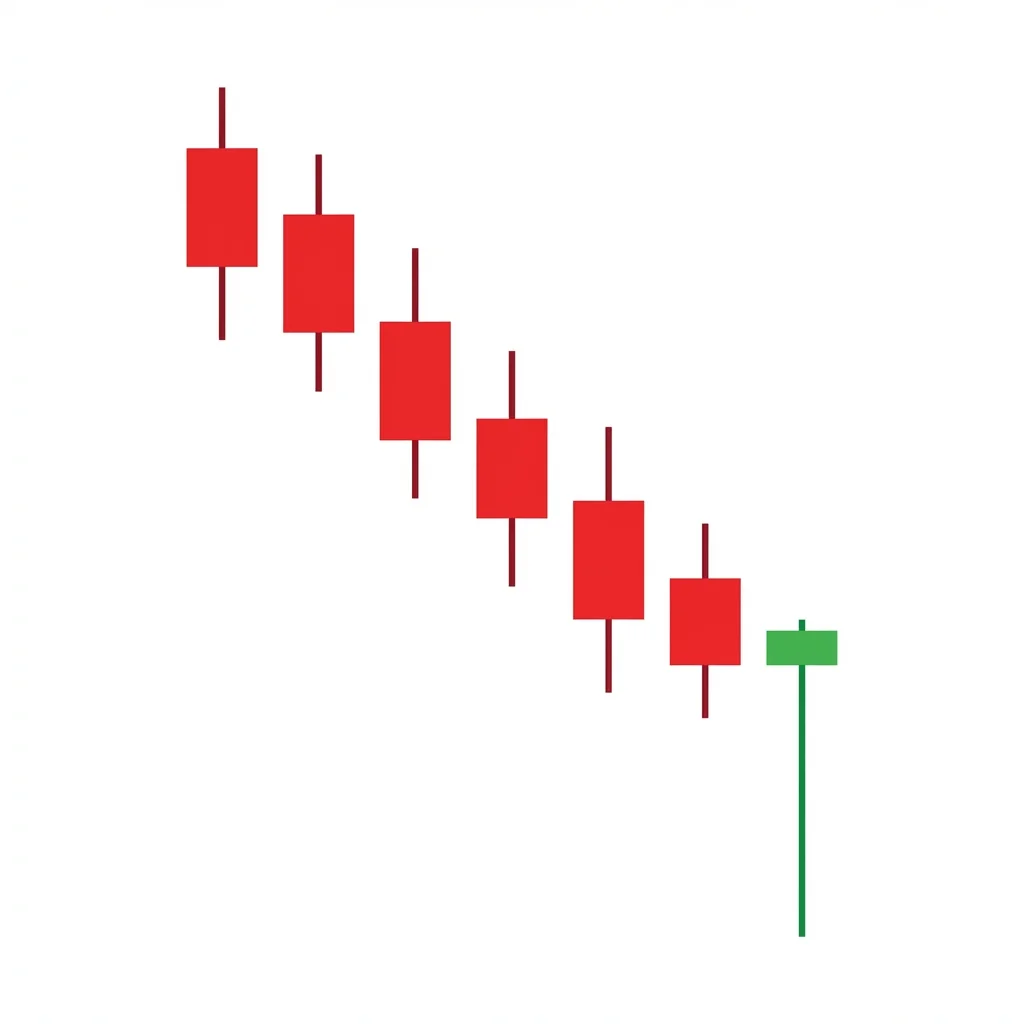
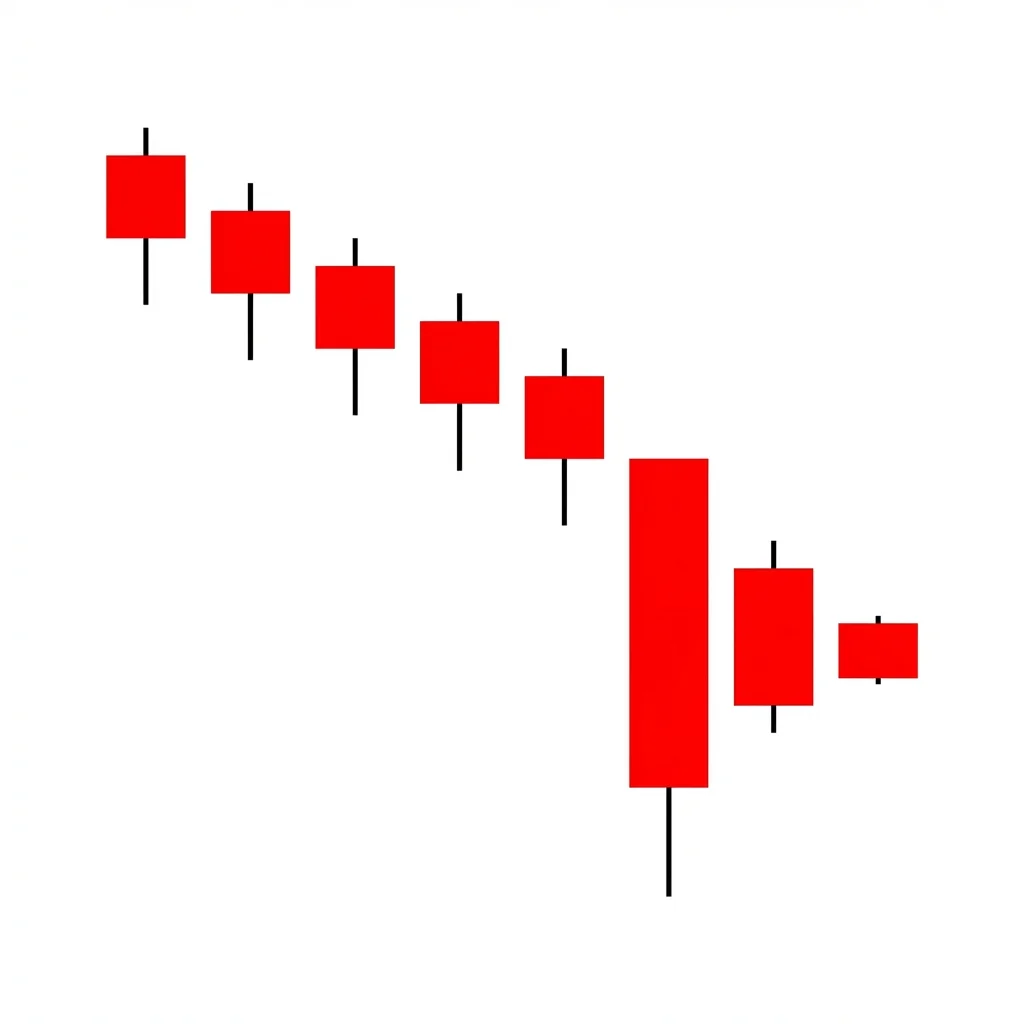
Bullish Selling Climax
The Bullish Selling Climax occurs when an extended downtrend reaches a point of maximum panic, producing a wide-range bearish candle on extraordinary volume. The exhaustion of selling pressure creates conditions for a sharp reversal as the last sellers capitulate.
Diff
Rel
bullishcontinuation2 candles
Bullish Separating Lines
Iki Chigai Sen
The Bullish Separating Lines is a two-candle continuation pattern where a bearish pullback candle is followed by a bullish candle opening at the same level, signaling that the uptrend will resume.
Diff
Rel

bullishcontinuation3 candles
Bullish Side-by-Side White Lines
Narabi Aka
Bullish Side-by-Side White Lines is a three-candle continuation pattern where a bullish candle gaps up and is followed by two similar-sized bullish candles at the same level, confirming the uptrend's strength.
Diff
Rel
bullishreversal3 candles
Bullish Spring
The Bullish Spring is a Wyckoff pattern where price briefly breaks below trading range support to trigger stop losses, then immediately reverses back above support, trapping shorts and initiating a markup phase.
Diff
Rel
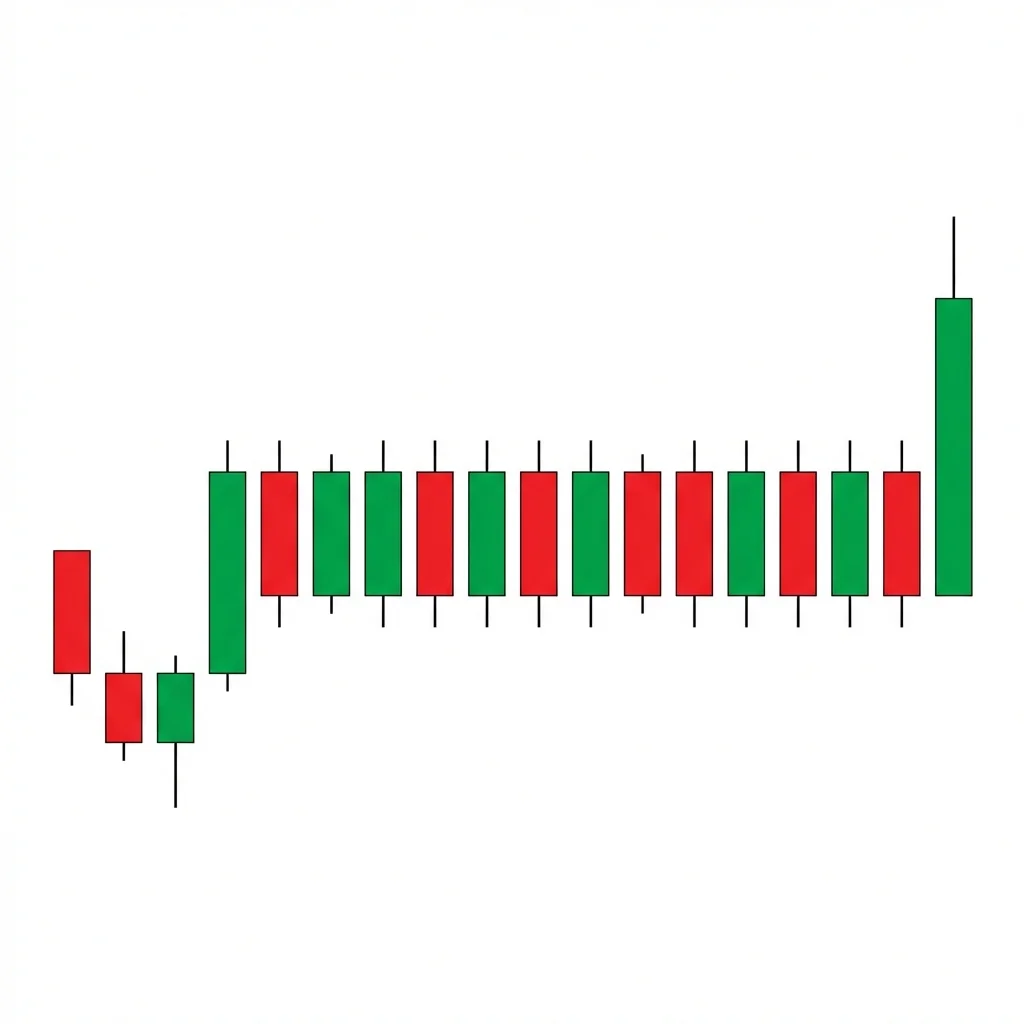
bullishcontinuation15 candles
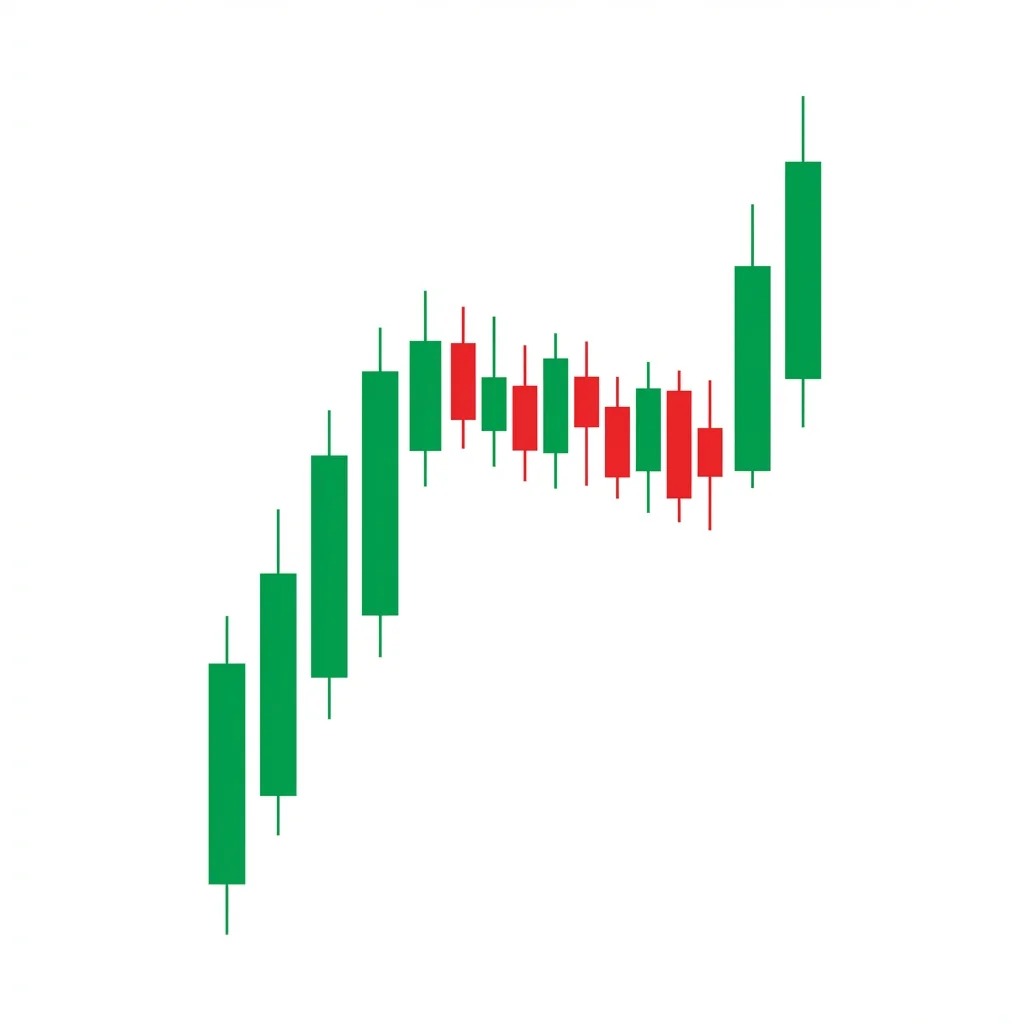
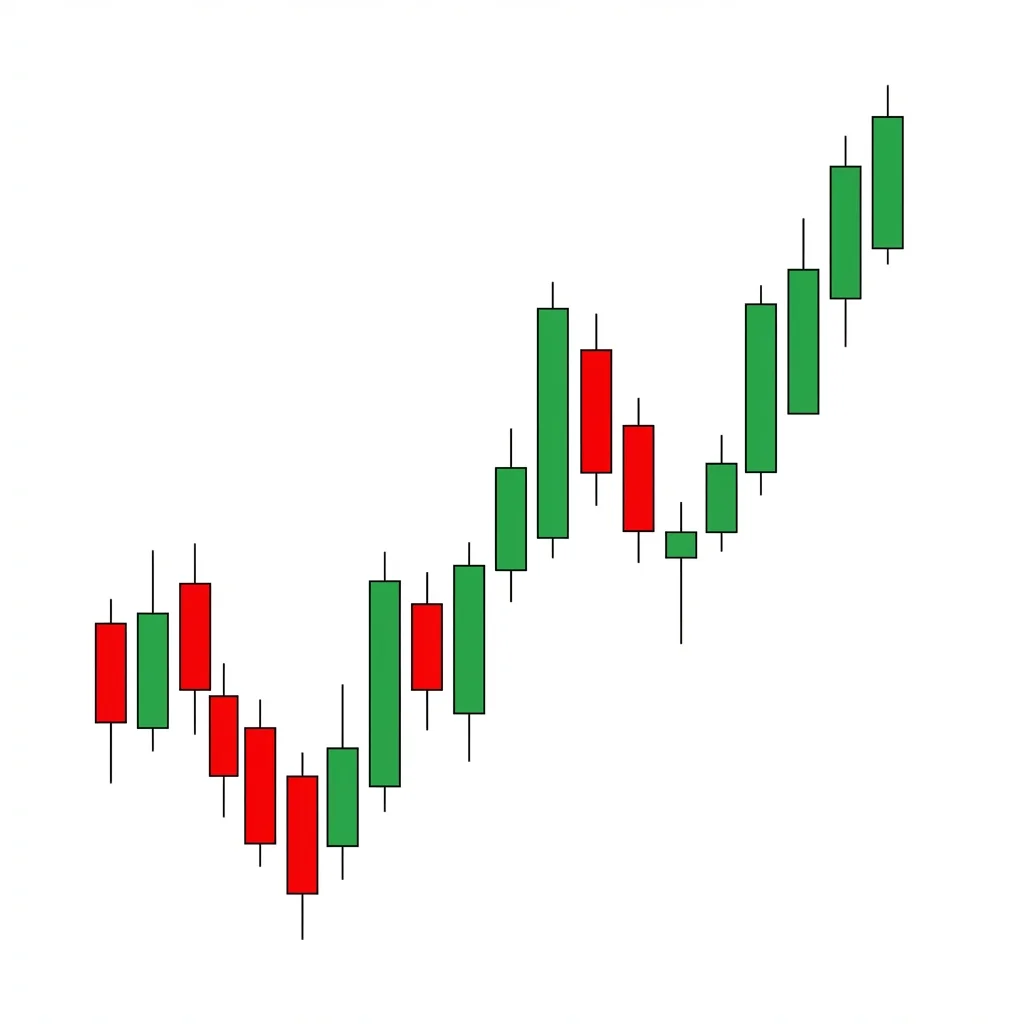
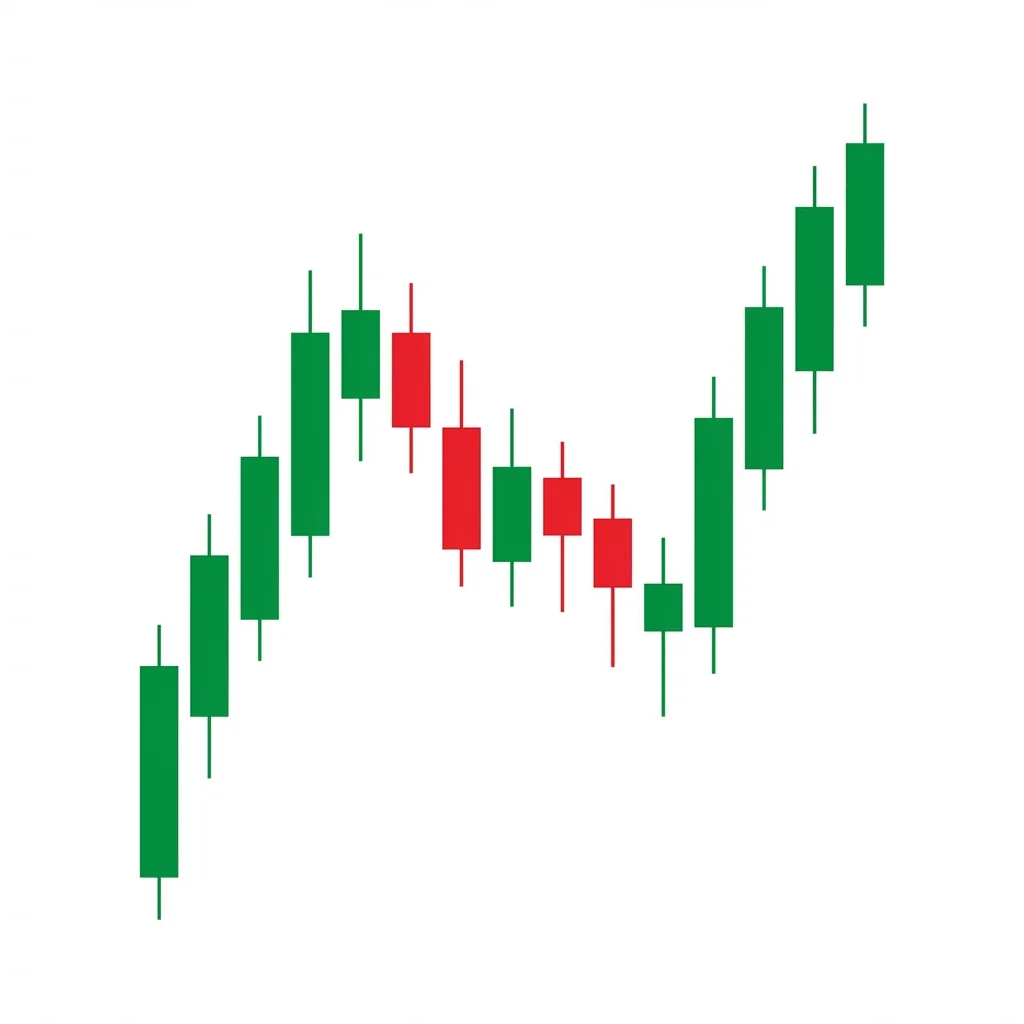
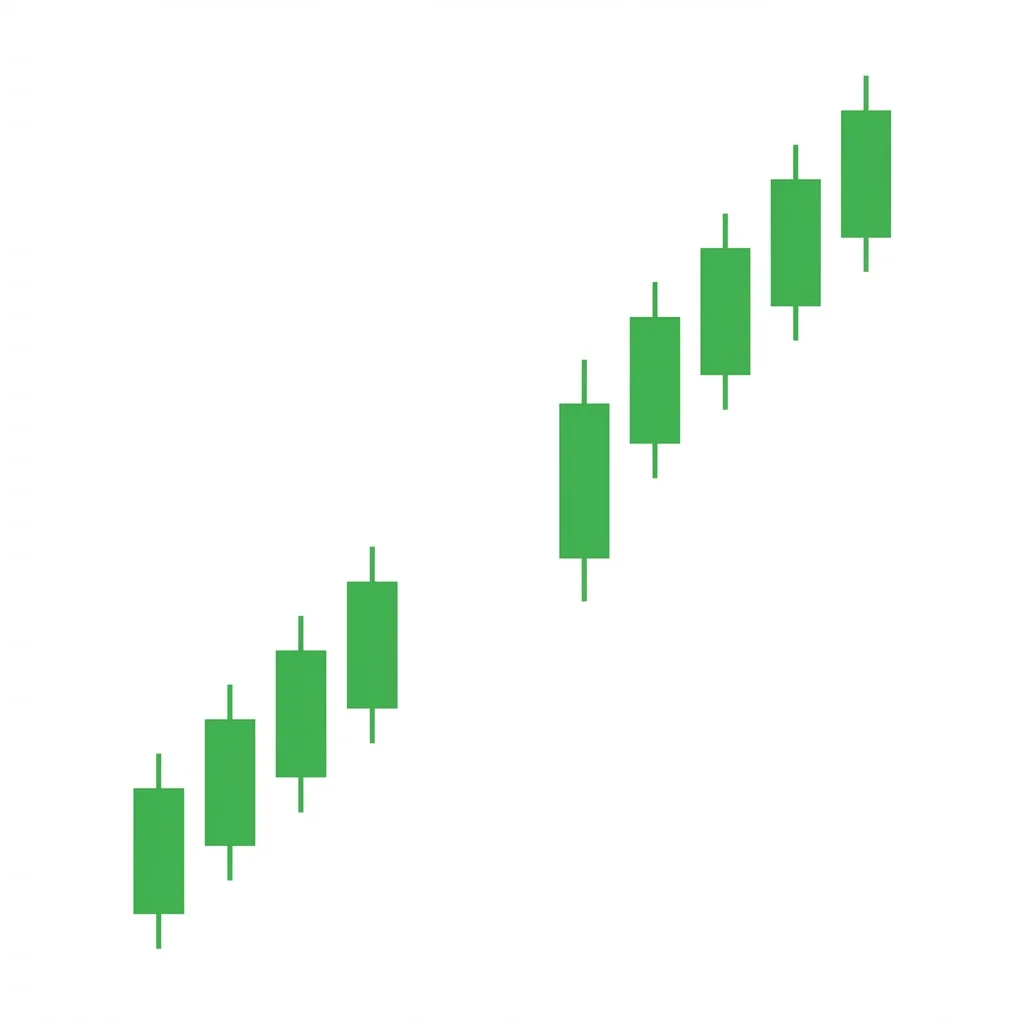
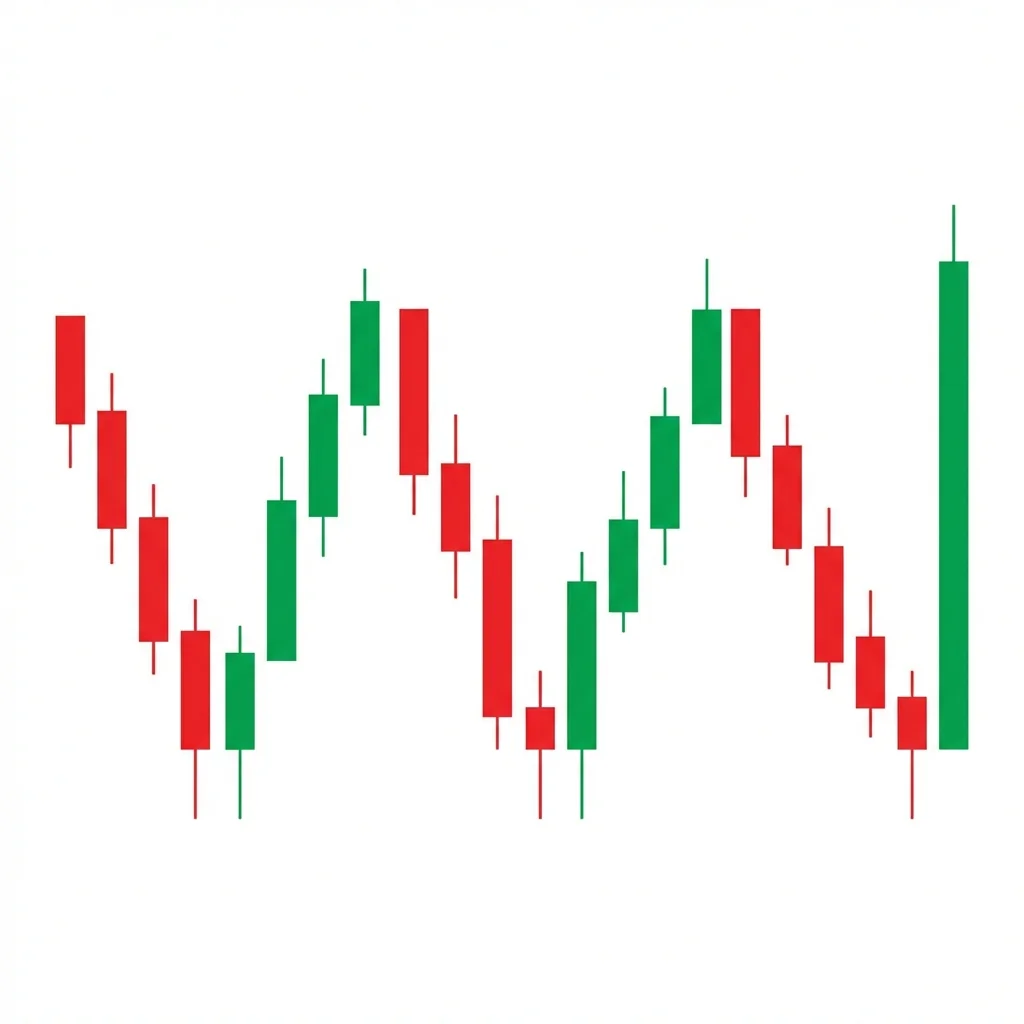
Bullish Staircase Up
The Bullish Staircase Up is a trend continuation formation consisting of alternating impulse moves and consolidation periods, creating a step-like progression of higher highs and higher lows that confirms a healthy, sustainable uptrend.
Diff
Rel
bullishreversal3 candles
Bullish Stick Sandwich
Gyaku Sanpoo Zukae Shita Banare
The Bullish Stick Sandwich is a three-candle reversal pattern where two bearish candles with matching closes 'sandwich' a bullish candle, creating a support level at the shared close price that suggests a potential bottom.
Diff
Rel
bullishboth2 candles
Bullish Support Bounce
The Bullish Support Bounce is one of the most fundamental trading patterns where price declines to a well-established support level and bounces higher, confirmed by bullish price action and volume at the support zone.
Diff
Rel
bullishreversal1 candle
Bullish Takuri
Takuri (探り)
The Bullish Takuri is a single-candle reversal pattern characterized by an extremely long lower shadow and a tiny body near the candle's high. It is a stronger version of the hammer, indicating aggressive rejection of lower prices and a high probability of trend reversal.
Diff
Rel
bullishboth4 candles
Bullish Three Gap Ups
Sanku (三空)
Bullish Three Gap Ups (Sanku) features three consecutive rising windows in a strong uptrend. While initially bullish, Japanese tradition warns that the third gap often signals exhaustion, making this a dual-purpose pattern — continuation in the short term but a potential warning of an impending reversal.
Diff
Rel
bullishreversal3 candles
Bullish Three Inside Up
Harami Age
The Bullish Three Inside Up is a three-candle reversal pattern that combines a bullish harami with a confirming third candle that closes above the first candle's open, providing a more reliable reversal signal than the harami alone.
Diff
Rel
bullishcontinuation4 candles
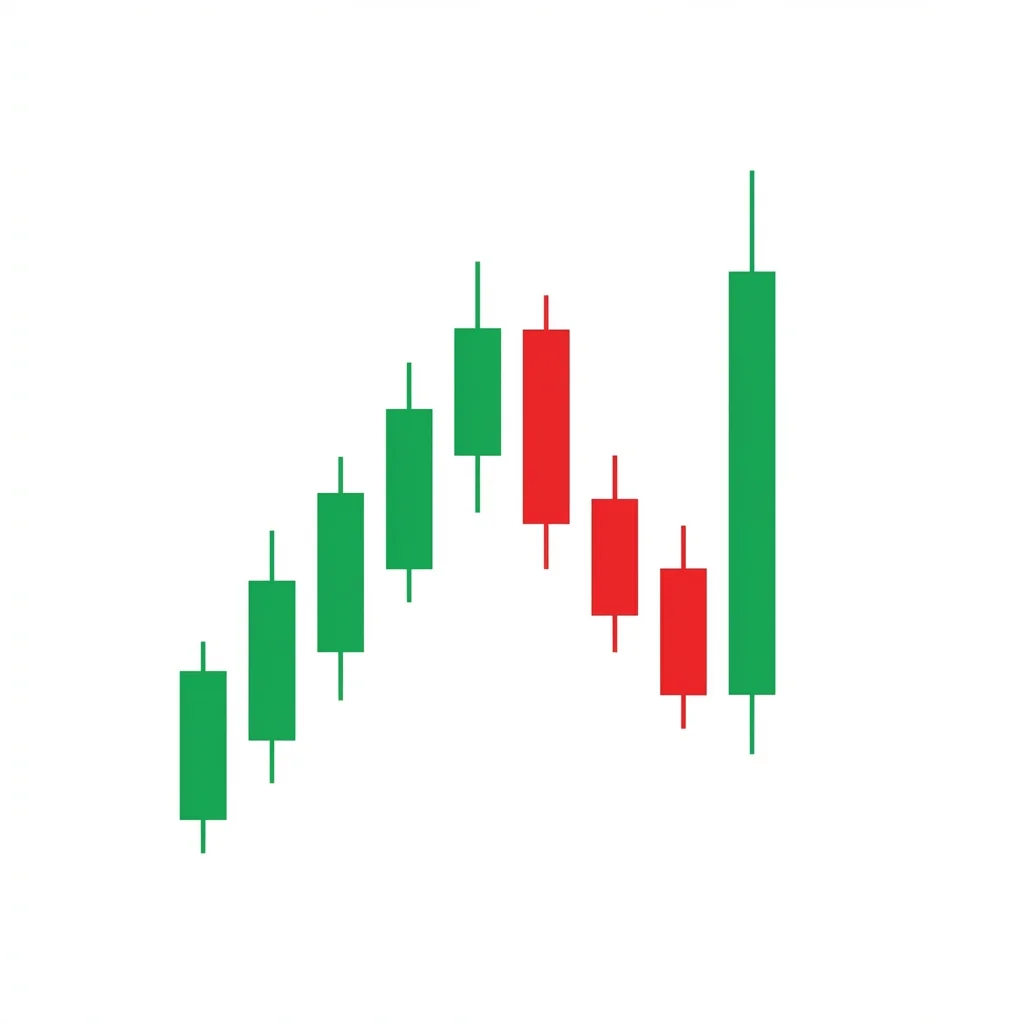
Bullish Three Line Strike
Sanpei Uchikomi (三兵打込み)
The Bullish Three Line Strike is a four-candle continuation pattern where three bullish candles are followed by a large bearish candle that engulfs all three. Despite the dramatic sell-off, the pattern is a continuation signal — the fourth candle is a shakeout that traps sellers before the uptrend resumes.
Diff
Rel
bullishreversal3 candles
Bullish Three Outside Up
Tsutsumi Age
The Bullish Three Outside Up is a three-candle reversal pattern combining a bullish engulfing with a confirming third candle that closes higher, providing one of the strongest reversal signals in candlestick analysis.
Diff
Rel
bullishreversal3 candles
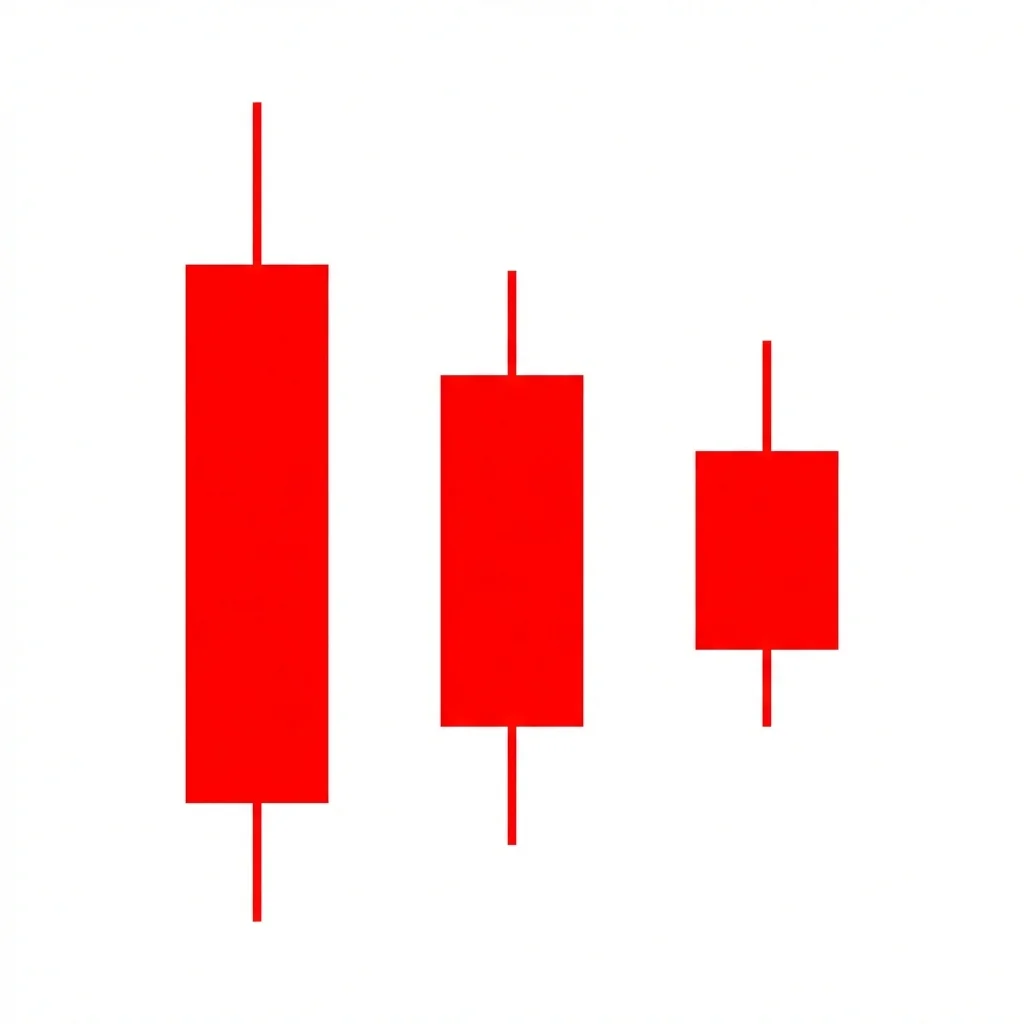
Bullish Three Recovering Crows
The Bullish Three Recovering Crows features three bearish candles where each opens within the prior candle's body and the bodies get progressively smaller, signaling that selling pressure is exhausting itself and a reversal may be imminent.
Diff
Rel
bullishreversal3 candles
Bullish Three River Bottom
Sansen Soko (三川底)
The Bullish Three River Bottom is a rare three-candle reversal pattern where a long bearish candle is followed by a harami-like candle with a long lower shadow that probes new lows, and a small bullish candle that signals the selling has exhausted itself.
Diff
Rel
bullishreversal3 candles
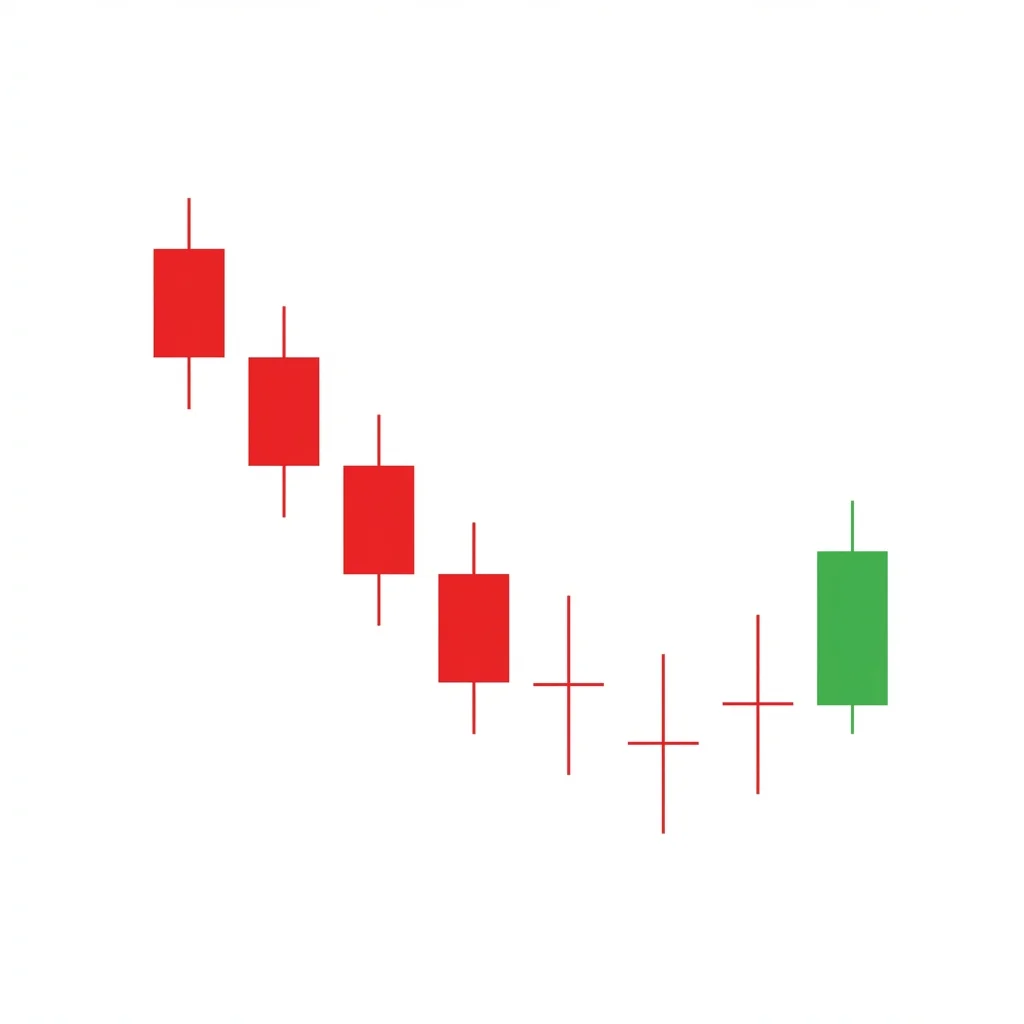
Bullish Three Stars in the South
Minami no Sansei (南の三星)
Three Stars in the South is a rare bullish reversal pattern of three progressively smaller bearish candles, each with shorter lower shadows and higher lows, signaling that selling pressure is systematically diminishing.
Diff
Rel
bullishreversal3 candles
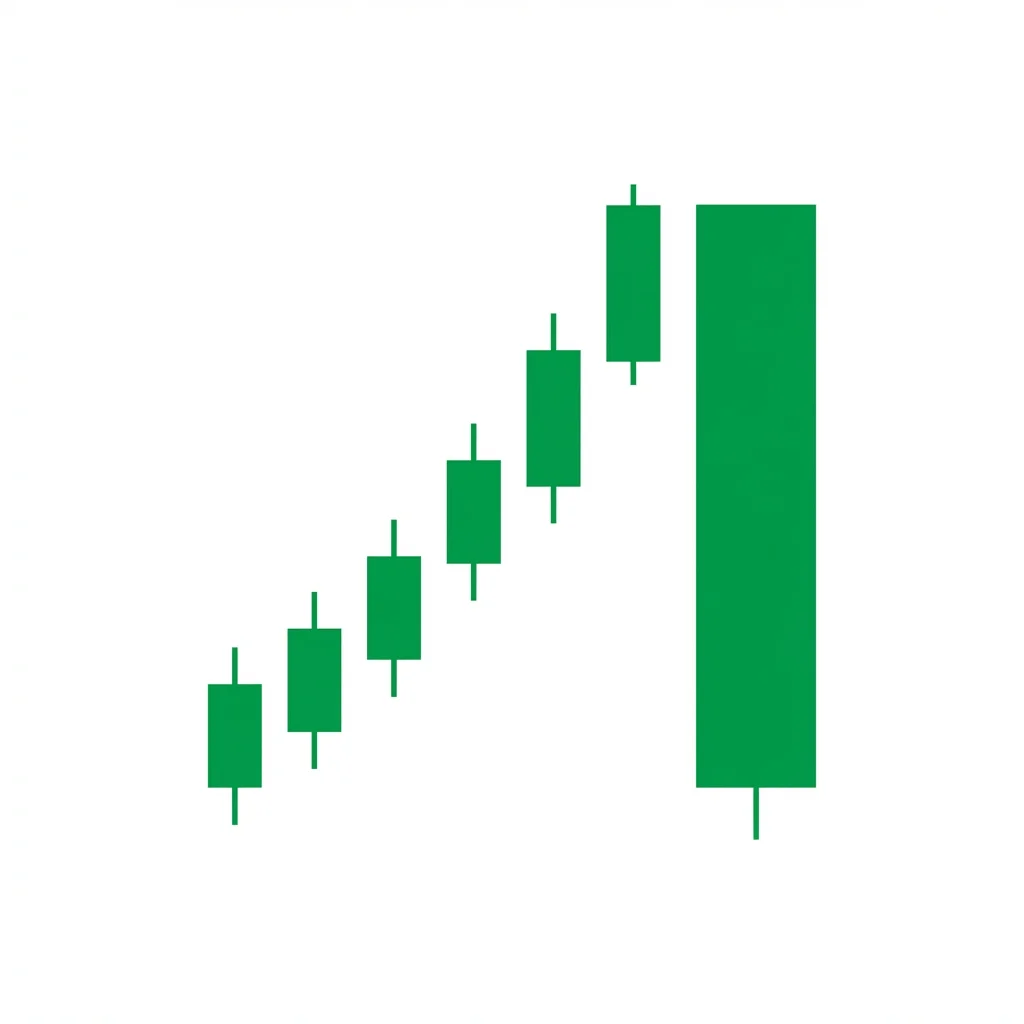
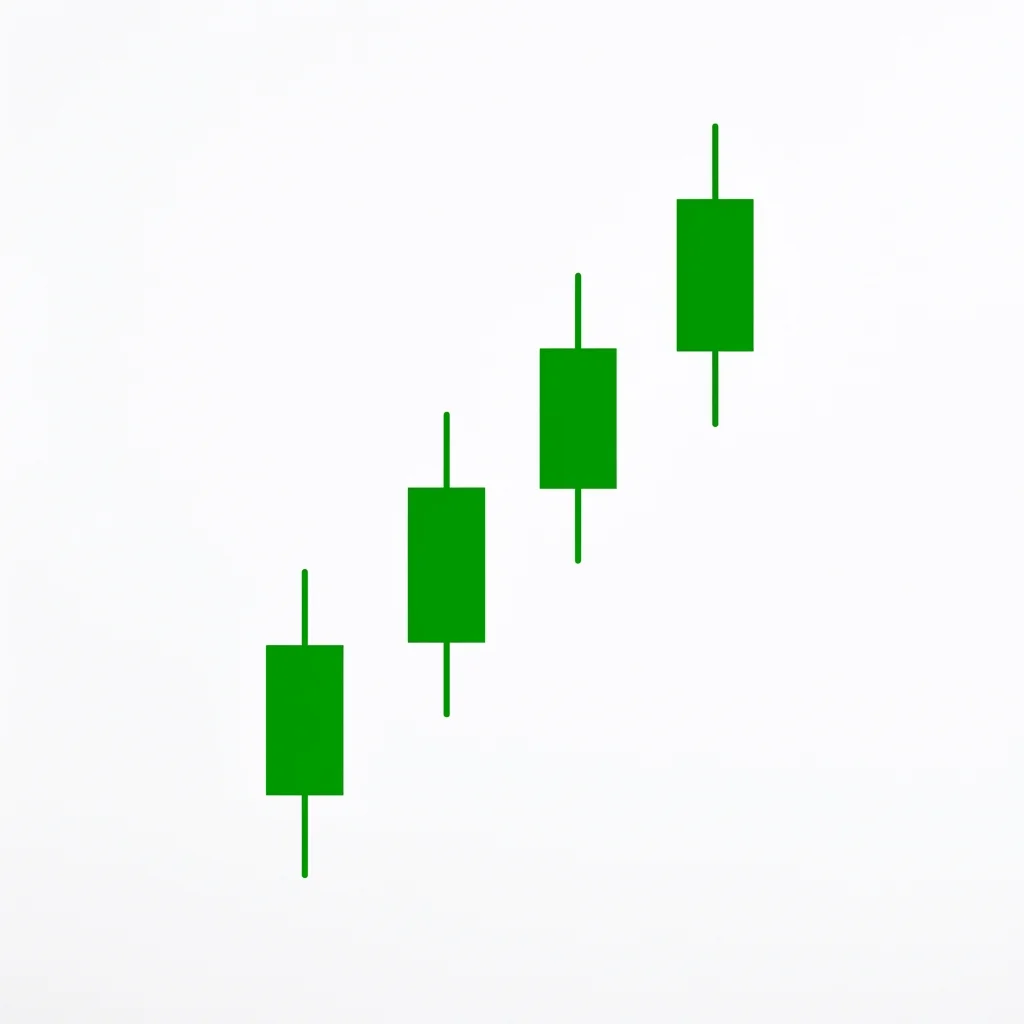
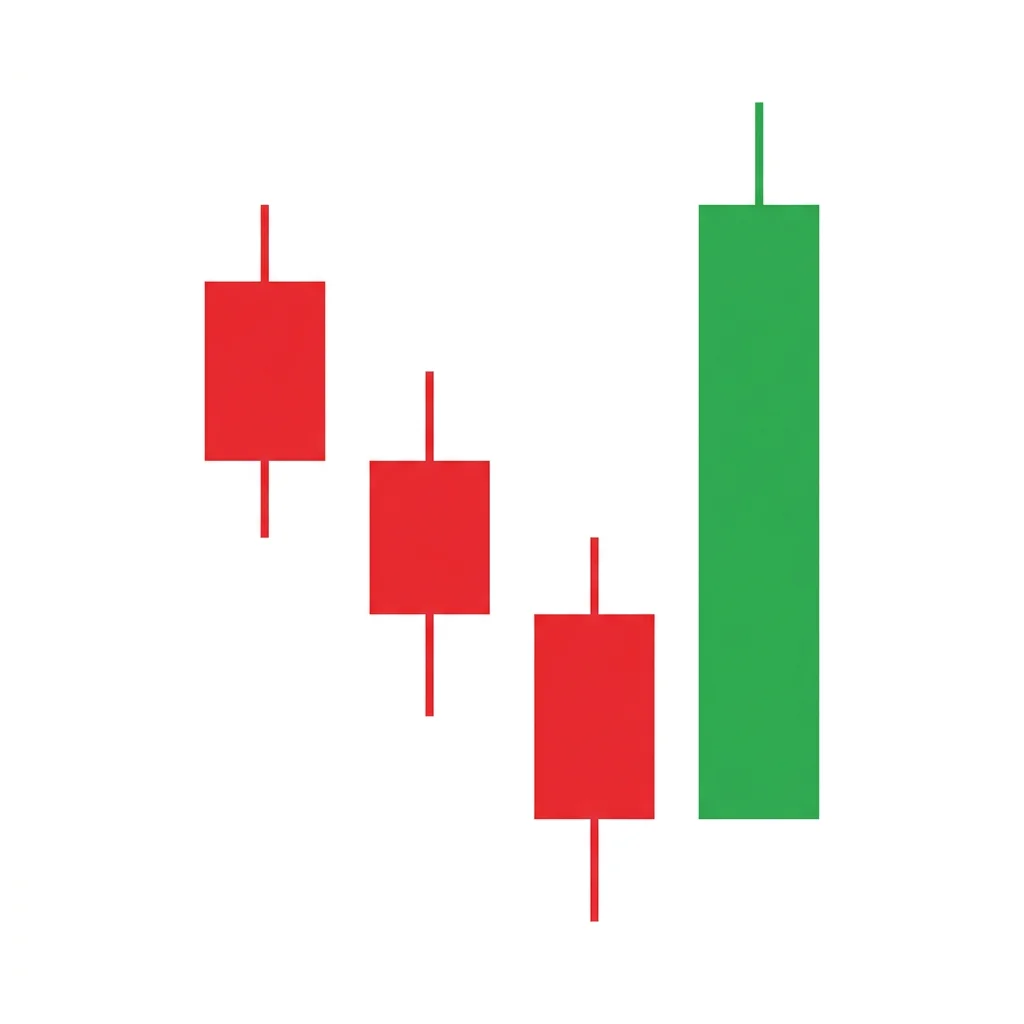
Bullish Three White Soldiers
Aka Sanpei (赤三兵)
Three White Soldiers is one of the strongest bullish reversal patterns: three consecutive long bullish candles with progressively higher closes, each opening within the prior candle's body, signaling a powerful shift from bearish to bullish sentiment.
Diff
Rel
bullishreversal3 candles
Bullish Tri-Star
Sansei (三星)
The Bullish Tri-Star is an extremely rare reversal pattern consisting of three consecutive doji candles with the middle one gapping below the others. It signals maximum indecision and a potential major trend reversal.
Diff
Rel
bullishreversal30 candles
Bullish Triple Bottom
The Triple Bottom is a major reversal pattern featuring three distinct lows at approximately the same price level, separated by two intermediate peaks. The breakout above the neckline confirms the reversal and targets a measured move equal to the pattern height.
Diff
Rel