Overview
Bullish Closing Marubozu
Marubozu
Also known as: Close-Shaven Marubozu, Closing White Marubozu
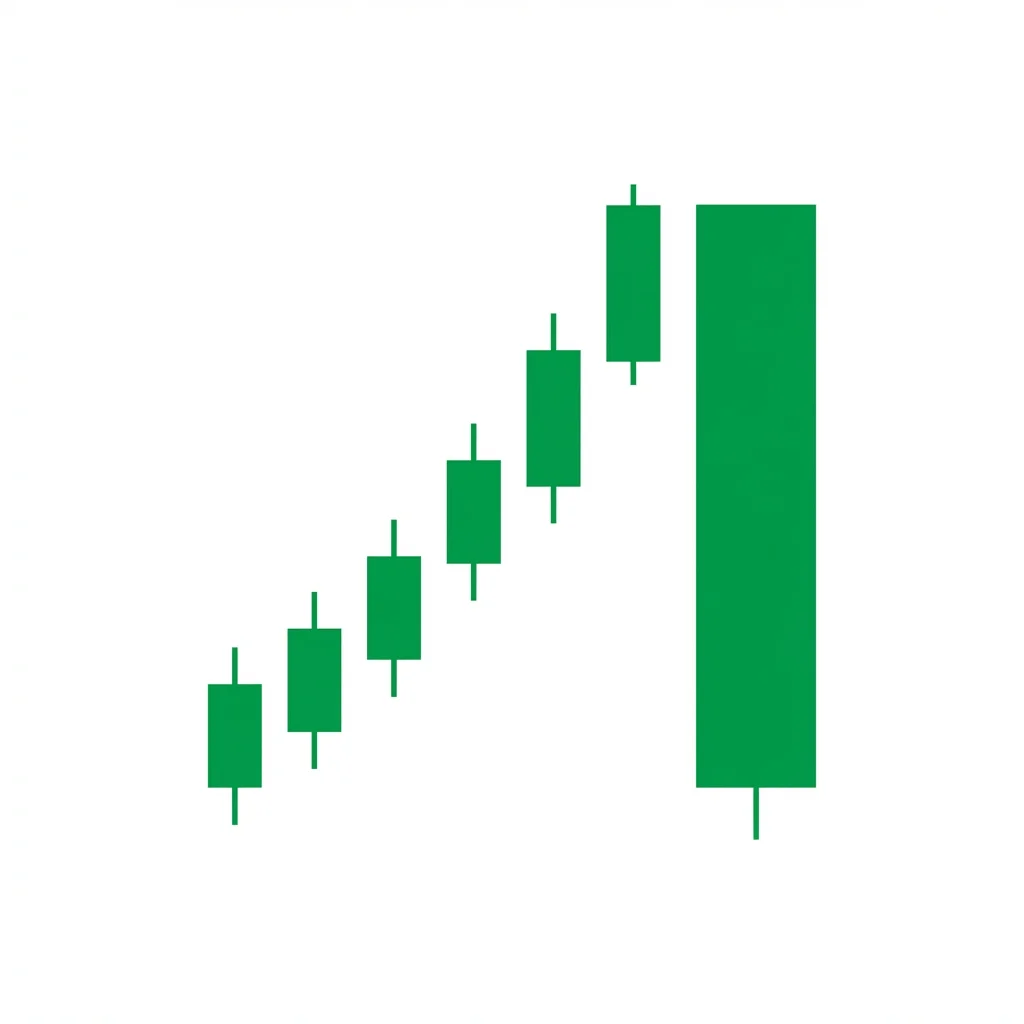
The Bullish Closing Marubozu is a single-candle pattern where the close equals the session high (no upper shadow), signaling that buyers maintained control through the closing bell with zero pullback.
A Closing Marubozu is a bullish candle that closes at its absolute high of the session with no upper shadow. This means from some point during the session, buyers pushed prices continuously higher and maintained that momentum right through the close. The absence of an upper shadow is psychologically significant: it means there was no profit-taking or selling pressure at the end of the session. In many cases, the strongest buying occurs near the close as institutional end-of-day orders drive the final push. This pattern signals that buyers expect higher prices the next session.
History & Etymology
The term Marubozu comes from Japanese candlestick analysis. In Japanese, marubozu means bald or shaved, referring to the absence of shadows. The Closing Marubozu specifically has no upper shadow (bald top), while the opening may have a small shadow.
Marubozu means bald head or close-cropped in Japanese. The Closing Marubozu has a bald close with no shadow at the top, meaning the closing price is the absolute high.
How It Forms
Formation Steps
- 1Single bullish candle with no upper shadow, the close equals the high
- 2May have a small lower shadow
- 3Long body showing sustained buying pressure throughout the session
Prerequisites
- Works as continuation in an uptrend or reversal in a downtrend
- Candle body should be significantly larger than recent average candles
Confirmation Signals
- Next candle opens above the closing marubozu close
- Volume above the 20-day average
- Follow-through buying on subsequent sessions
Invalidation Signals
- Next candle closes below the marubozu midpoint
- Price drops below the marubozu low
- Bearish candle immediately follows with equal or greater range
Candle Breakdown
Closing Marubozu
A long bullish candle with no upper shadow. The close is the high of the session.
Buyers dominated from start to finish and were so confident they did not take any profits at the close. This is a strong statement of bullish conviction.
Psychology
The Closing Marubozu shows that buying pressure increased through the session and reached its peak at the close. The lack of any upper shadow means there was no resistance or profit-taking at the highs.
Buyer Perspective
Buyers are highly confident. They bid prices up to the close without hesitation. Institutional market-on-close orders often drive the final push, indicating planned accumulation.
Seller Perspective
Sellers are completely absent at the end of the session. They could not push price down from the high at any point near the close.
Smart Money Action
Institutional MOC (market-on-close) orders often create closing marubozus, representing deliberate end-of-day buying for portfolio repositioning or accumulation.
Retail Trader Trap
Retail traders who shorted the session find no relief at the close, as the candle closes at the absolute high offering no pullback to exit shorts.
Emotional Cycle
Trading Strategy
Aggressive Entry
Enter long at the close of the marubozu or on the open of the next session.
Conservative Entry
Wait for the next candle to close above the marubozu high, confirming continuation.
At the body height projected above the close.
At the next major resistance level.
Using trailing stop for trend-following.
Best Conditions
- Timeframe: daily
- Timeframe: weekly
- Trending markets
- Breakout environments
- After pullbacks in uptrends
- Asset: stocks
- Asset: futures
- Asset: ETFs
Avoid When
- Timeframe: 1m
- Timeframe: 5m
- Choppy, range-bound markets
- Near major resistance where rejection is likely
Confluence Factors
- Forms at a breakout level
- Volume above average
- RSI showing momentum but not extreme overbought
- Forms after a pullback to support
Scale In Strategy
Enter 50% on the marubozu close, add 50% if next session continues higher.
Scale Out Strategy
Take 50% at the body-height projection, trail the rest.
Risk Management
Volume Analysis
Volume Confirmation
Volume should be above the 20-day average. Higher volume equals more conviction.
Volume Profile
Strong volume in the final 30 minutes of the session confirms institutional participation.
Volume Divergence
Low-volume closing marubozus are less significant and may reflect thin markets.
Technical Confluence
Support Resistance
A closing marubozu that breaks through resistance is particularly powerful, as the close at the high means no rejection.
Fibonacci Levels
When the marubozu bounces from a Fibonacci level and closes at the high, it strongly confirms support.
Moving Averages
A closing marubozu reclaiming a key moving average (50 or 200 SMA) is a strong bullish signal.
Rsi Confirmation
RSI above 50 and rising confirms the bullish momentum.
Macd Confirmation
MACD bullish crossover on the same day adds confirmation.
Bollinger Bands
A closing marubozu near or above the upper Bollinger Band signals strong momentum but watch for overextension.
Vwap
Closing above VWAP confirms institutional buying interest.
Ichimoku Cloud
A marubozu closing above the Kumo cloud confirms bullish trend.
Elliott Wave
Often appears as the start of a Wave 3.
Wyckoff Phase
May represent the Sign of Strength candle in a markup phase.
Market Profile
Creates a single-print buying tail in the market profile.
Order Flow
Positive delta throughout the session with increasing buying pressure into the close.
Open Interest
Rising open interest confirms new longs are being established.
Multi-Timeframe Analysis
Higher Timeframe Alignment
A daily closing marubozu within a weekly uptrend is a strong continuation signal.
Lower Timeframe Entry
The 1-hour chart shows continuous buying throughout the day with no significant pullbacks.
Timeframe Confluence
A weekly closing marubozu is a very powerful signal that can lead to multi-week trends.
Top-Down Approach
Weekly confirms trend, daily identifies closing marubozu, enter on next session open.
Statistics
Historical Examples
Microsoft Closing Marubozu Breakout
successMicrosoft formed a closing marubozu on above-average volume as it broke above a key resistance level, closing at the session high. The stock continued higher for the next two weeks.
Lesson: Closing marubozus at breakout levels are high-conviction signals because the absence of an upper shadow means no rejection at the new price level.
Variations
Gap-Up Closing Marubozu
Opens with a gap up and closes at the session high with no upper shadow.
Confusion Matrix
Patterns commonly confused with Bullish Closing Marubozu and how to distinguish them.
Bullish Marubozu
8500% similarCheck the lower shadow. If present, it is a Closing Marubozu. If the open also equals the low, it is a full Marubozu.
Key Differences
- Full Marubozu has NO shadows at all
- Closing Marubozu may have a lower shadow
The Bearish Closing Marubozu is a single bearish candle with no lower shadow — the close is at the exact low of the session. This indicates that sellers controlled the session and maintained pressure through the very last trade, a sign of strong bearish conviction.
The Bullish Belt Hold is a single-candle reversal pattern that opens at the low of the session and rallies strongly to close near the high, signaling a potential shift from bearish to bullish control.
The Bullish Marubozu is a single candle with no shadows — it opens at the low and closes at the high, representing complete buyer dominance throughout the entire session with no seller resistance.
The Opening Marubozu is a bullish candle with no lower shadow — the open IS the low — showing that from the moment the session opened, buyers were in control and never let price trade below the open.
The Bullish Three Inside Up is a three-candle reversal pattern that combines a bullish harami with a confirming third candle that closes above the first candle's open, providing a more reliable reversal signal than the harami alone.
The Bearish Belt Hold is a single bearish candle that opens at its high and closes near its low with a long body, indicating that sellers dominated from the opening bell and controlled price action throughout the session.
Pro Tips & Common Mistakes
Pro Tips
- A closing marubozu that also gaps up the next session is an extremely bullish sign
- The pattern is most meaningful on daily charts where the closing price reflects deliberate end-of-day positioning
- Look for closing marubozus at breakout levels for maximum significance
- Multiple consecutive closing marubozus signal very strong momentum
Common Mistakes
- Trading every closing marubozu without context
- Allowing a tiny upper shadow when identifying the pattern
- Ignoring volume
- Chasing after the next session gaps up significantly
Advanced Techniques
- Monitor the MOC order imbalance data to predict closing marubozus
- Use as a component in a multi-candle pattern identification system
- Combine with the Arms Index for broad market confirmation
Institutional Perspective
Institutional MOC orders are a primary driver of closing marubozus. When large funds need to buy before the close for index rebalancing or portfolio adjustments, they create exactly this candle structure.
Fun Facts
- Studies of institutional order flow show that closing marubozus on daily charts are frequently caused by large MOC buy imbalances, often from index fund rebalancing.
- The Japanese called sessions that close at the high quality trading days, reflecting strong buyer conviction.
Frequently Asked Questions
The key difference is that the close must equal the high, meaning zero upper shadow. A regular bullish candle can have an upper shadow, indicating some selling occurred near the highs. The closing marubozu shows no profit-taking whatsoever at the close.