Overview
Bullish Climax Reversal
Also known as: Selling Climax Reversal, Capitulation Reversal, Panic Bottom Reversal
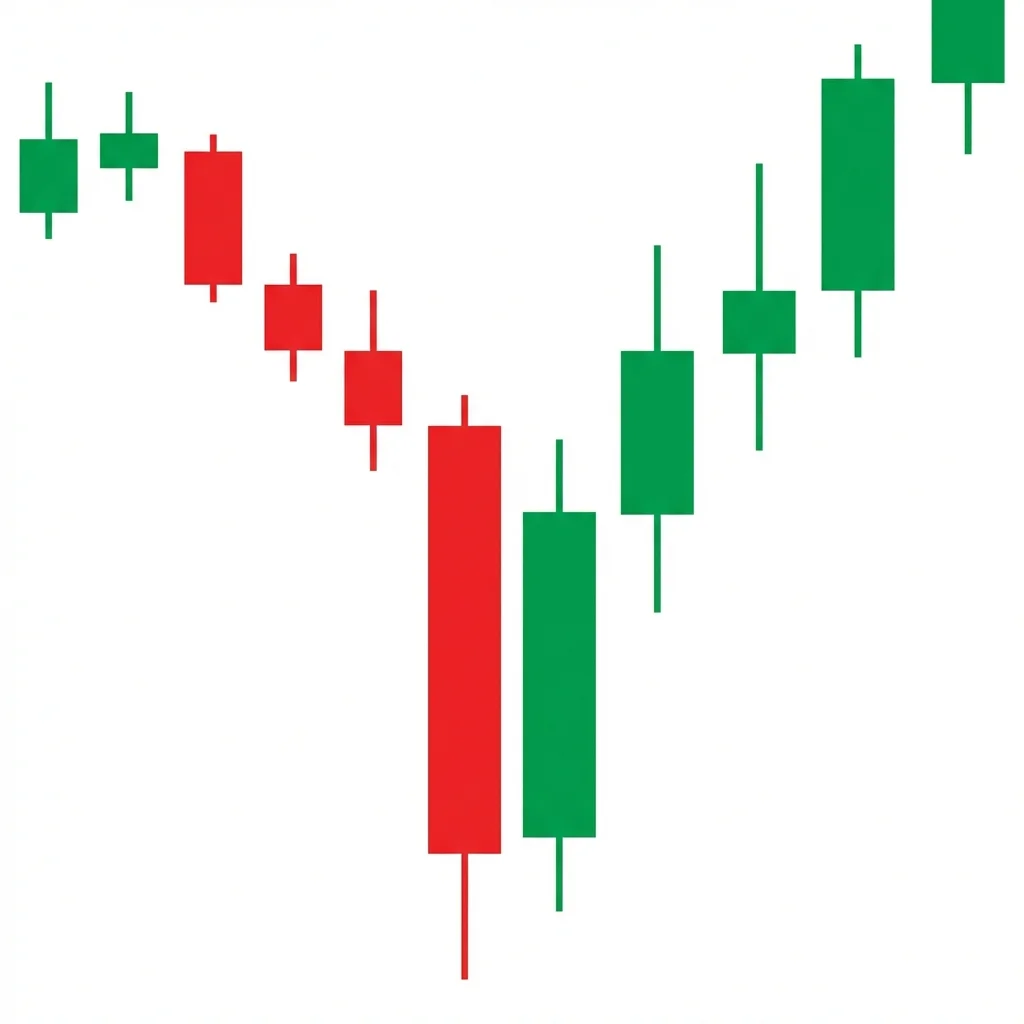
The Bullish Climax Reversal occurs when extreme panic selling exhausts all remaining supply, creating a volume spike at the low that marks the turning point from bearish to bullish control.
A climax reversal is the most dramatic type of reversal pattern. It occurs after an extended downtrend when selling accelerates into a panic. Volume surges to extreme levels — often 3-5 times the daily average — as weak hands capitulate and institutional buyers absorb the supply. The climax candle typically has a wide range with a long lower shadow, showing that buyers stepped in aggressively at the lows. The reversal candle that follows closes strongly bullish, often near its highs, confirming that demand has overwhelmed supply. This pattern is significant because it represents the actual exhaustion of selling pressure — there are literally no more sellers left at those prices.
History & Etymology
The concept of a selling climax was central to Richard Wyckoff's market theory in the early 1900s. Wyckoff identified the Selling Climax (SC) as the first event in the accumulation cycle. Jesse Livermore also recognized panic bottoms as prime buying opportunities, famously buying during the Panic of 1907 when selling reached a climax.
The word 'climax' comes from the Greek 'klimax' meaning ladder or staircase, but in market context it refers to the peak or culmination of an emotional extreme. A selling climax is the culmination of fear, after which prices reverse.
How It Forms
Formation Steps
- 1Extreme bearish candle(s) with massive volume, often with long lower shadows
- 2Price reaches a climactic low with volume 2-5x the average
- 3Sharp bullish reversal candle(s) follow, often closing near the highs
Prerequisites
- Extended downtrend with accelerating selling
- Volume spike at least 2x the 20-day average
- Signs of panic or capitulation in market sentiment
Confirmation Signals
- Bullish reversal candle on massive volume
- Price closes well above the session low
- Follow-through buying on the next session
- Volume remains elevated but price holds above the climax low
Invalidation Signals
- Price makes new lows after the supposed climax on even higher volume
- No reversal candle — continued selling
- Volume subsides without any recovery
Candle Breakdown
Panic Candle
An extreme bearish candle with massive volume and often a long lower shadow showing panic selling.
Capitulation. Weak holders sell at any price. Margin calls force liquidation. This is peak fear.
Reversal Candle
A strong bullish candle closing near its high, showing that buyers have absorbed all selling and taken control.
Institutional buyers absorb the panic supply. The reversal from the lows on high volume signals the power shift.
Psychology
The climax reversal captures the moment of maximum fear. Panic selling creates extreme volume as every remaining weak holder capitulates. Smart money absorbs this supply, and the absence of any further selling creates the conditions for a sharp reversal.
Buyer Perspective
Institutional buyers see the volume spike as the signal they have been waiting for. The panic provides the liquidity they need to build large positions at depressed prices.
Seller Perspective
Retail sellers are in full panic. They sell to eliminate pain, not because of analysis. Their capitulation provides the supply that institutions absorb.
Smart Money Action
Institutions deploy significant capital during climax events. They use algorithms to buy the elevated volume, absorbing millions of shares that panicked retail investors are dumping.
Retail Trader Trap
Retail traders who sell during the climax are almost always selling at or near the absolute bottom. This is the most expensive emotional mistake in trading.
Emotional Cycle
Trading Strategy
Aggressive Entry
Enter long when you see a bullish reversal candle forming during a volume spike at least 2x average, with the candle closing in its upper half.
Conservative Entry
Wait for the session following the climax candle to confirm that the low holds, then enter on a pullback to the climax candle's midpoint.
At the automatic rally high — the first significant bounce after the climax.
At the origin of the final selling wave that preceded the climax.
At the prior major swing high from before the downtrend.
Best Conditions
- Timeframe: daily
- Timeframe: weekly
- Panic events
- Market crashes
- Flash crashes
- Major negative news events
- Asset: stocks
- Asset: indices
- Asset: crypto
- Asset: futures
Avoid When
- Timeframe: 1m
- Timeframe: 5m
- Gradual, orderly declines (no climax occurs)
- Bear markets with rolling lower lows
Confluence Factors
- Climax occurs at major support
- RSI extremely oversold (below 20)
- VIX spike or fear gauge at extremes
- Breadth indicators at extreme negative readings
- Multiple climax-type candles across correlated assets
Scale In Strategy
Enter 50% on the climax reversal candle, add 50% on a successful retest of the climax zone.
Scale Out Strategy
Take 25% at the automatic rally, 25% at the origin of the selloff, trail the remainder.
Risk Management
Volume Analysis
Volume Confirmation
This pattern IS defined by volume. The climax must show volume at least 2x the 20-day average. Without the volume spike, it is not a climax.
Volume Profile
Extreme volume on the climax bar, with heavy trading near the lows and a volume vacuum above as price recovers.
Volume Divergence
If subsequent declines show higher volume than the climax, the supposed bottom may not be the true low.
Technical Confluence
Support Resistance
The climax low becomes one of the strongest support levels on the chart. It often holds for months or years.
Fibonacci Levels
Climax lows often occur near major Fibonacci levels (61.8%, 78.6%) of the prior bull move.
Moving Averages
Price often snaps back to the 20 or 50 SMA rapidly after a climax. These moving averages become initial targets.
Rsi Confirmation
RSI should be deeply oversold (below 20-25) during the climax. A rapid RSI recovery confirms the reversal.
Macd Confirmation
MACD will be deeply negative. Look for the histogram to start shrinking (less negative) as confirmation.
Bollinger Bands
Price typically pierces the lower Bollinger Band by a wide margin during the climax, then snaps back inside.
Vwap
On intraday charts, the VWAP during the climax session marks fair value. Price recovering above VWAP is bullish.
Ichimoku Cloud
Climax lows often occur far below the Ichimoku cloud. Recovery above the cloud can take time but signals genuine trend change.
Elliott Wave
Climax reversals often mark the end of Wave 5 in an impulse decline or the end of a C wave.
Wyckoff Phase
The Selling Climax (SC) is the first event in Wyckoff's accumulation cycle, followed by the Automatic Rally (AR).
Market Profile
The climax creates a long tail in the market profile, with the low-volume node at the extreme marking rejection of lower prices.
Order Flow
Massive delta imbalance during the climax — initially strong selling, then a dramatic flip to buying as institutions absorb supply.
Open Interest
In futures, open interest spikes during the climax reflect forced liquidations. A drop in OI after the low suggests shorts have been flushed.
Multi-Timeframe Analysis
Higher Timeframe Alignment
A daily climax at a weekly support zone has the highest conviction for a major bottom.
Lower Timeframe Entry
Use the 1-hour chart to spot the intraday reversal during the climax session for precise entry.
Timeframe Confluence
A daily climax that coincides with monthly oversold conditions signals a potential generational buying opportunity.
Top-Down Approach
Monthly identifies the macro support → Weekly shows the downtrend → Daily captures the climax → 1-hour times the entry.
Statistics
Historical Examples
COVID Crash Bottom March 2020
successThe S&P 500 experienced a textbook selling climax on March 23, 2020. Volume surged to record levels as panic selling peaked. The index bottomed that day and began a historic rally that gained over 100% over the next two years.
Lesson: The most terrifying moments in markets — when it feels like the world is ending — often produce the best buying opportunities. The volume spike was the definitive signal.
Variations
Flash Crash Climax
An intraday version where price crashes and recovers within minutes or hours.
Multi-Day Climax
The climax extends over 2-3 sessions rather than a single candle.
Confusion Matrix
Patterns commonly confused with Bullish Climax Reversal and how to distinguish them.
Bullish Selling Climax
9000% similarThey are essentially the same event. Selling Climax is the Wyckoff label; Climax Reversal is the broader technical analysis term.
Key Differences
- Selling Climax is the Wyckoff term for the same concept
- Climax Reversal emphasizes the reversal candle; Selling Climax emphasizes the selling exhaustion
Bullish V Reversal
7000% similarCheck volume. A climax reversal MUST have extreme volume. A V-reversal describes the price shape and may or may not have extreme volume.
Key Differences
- V-reversals are about the overall shape of the recovery
- Climax reversals specifically require extreme volume
The Buying Climax is a Wyckoff concept describing the final blow-off top where extreme volume and wide price spreads signal that all remaining demand has been absorbed, leaving the market vulnerable to a sharp reversal and the beginning of distribution.
The Bullish Engulfing is one of the most popular and reliable two-candle reversal patterns. A large bullish candle completely engulfs the prior bearish candle body, signaling a decisive shift from selling to buying control.
A Bullish Key Reversal occurs when price makes a new low during a downtrend but reverses to close above the prior bar's high on heavy volume, signaling a dramatic single-day shift in control from sellers to buyers.
The Bullish Selling Climax occurs when an extended downtrend reaches a point of maximum panic, producing a wide-range bearish candle on extraordinary volume. The exhaustion of selling pressure creates conditions for a sharp reversal as the last sellers capitulate.
The Climax Reversal is a wide-range candle that forms at the top of an uptrend, opening strong and reversing to close near the low, signaling that selling pressure has overwhelmed buying and the trend may be exhausted.
Pro Tips & Common Mistakes
Pro Tips
- Volume is everything — without a genuine volume spike, it is not a climax
- The climax low does not have to hold perfectly — a retest (Wyckoff Secondary Test) within 5-10% of the low is normal
- Look for breadth extremes: when 90%+ of stocks are declining, the climax is likely near
- VIX above 30-40 combined with a volume spike is a powerful buy signal historically
- Do not try to catch the exact bottom — buying within 5% of the climax low is excellent
Common Mistakes
- Buying every sharp decline thinking it is a climax — true climaxes require extreme volume
- Selling during the climax (the worst possible time to sell)
- Expecting an immediate V-recovery — sometimes a secondary test occurs first
- Ignoring the possibility that the climax is just the first of multiple legs down in a deeper bear market
- Using too much leverage at the bottom, getting stopped out on the normal retest volatility
Advanced Techniques
- Monitor the TRIN (Arms Index) — readings above 2.0-3.0 indicate climax selling conditions
- Use breadth indicators (advance-decline line, percent above 200 SMA) to confirm capitulation breadth
- Watch options markets for extreme put-call ratios as a contrarian buy signal during the climax
- Use Wyckoff's volume spread analysis to distinguish a true selling climax from just a high-volume down day
Institutional Perspective
Institutional traders live for climax events. They maintain cash reserves specifically to deploy during panics. The climax provides the liquidity they need to build massive positions. When you sell in a panic, you are selling to an institution that will profit from your fear.
Fun Facts
- Warren Buffett's famous quote 'Be greedy when others are fearful' is essentially a description of buying climax reversals.
- The March 2020 COVID crash bottom produced the highest single-day volume in NYSE history — a textbook climax.
- Studies show that buying when the VIX is above 40 has produced positive returns 90%+ of the time on a 12-month horizon.
Frequently Asked Questions
Volume is the key differentiator. A climax requires volume at least 2-3x the 20-day average. Additionally, the candle should show a long lower shadow (buying at the lows) and preferably close in the upper half of its range. A regular down day may have normal volume and close near its lows.
Yes. About 30% of climax reversals are followed by further declines — sometimes the 'climax' is only the first wave of capitulation. This is why stops below the climax low are essential and why waiting for a retest before adding to positions is wise.