Overview
Bearish Belt Hold
Yorikiri
Also known as: Belt Hold Line, Bearish Opening Marubozu, Black Opening Shaven Head
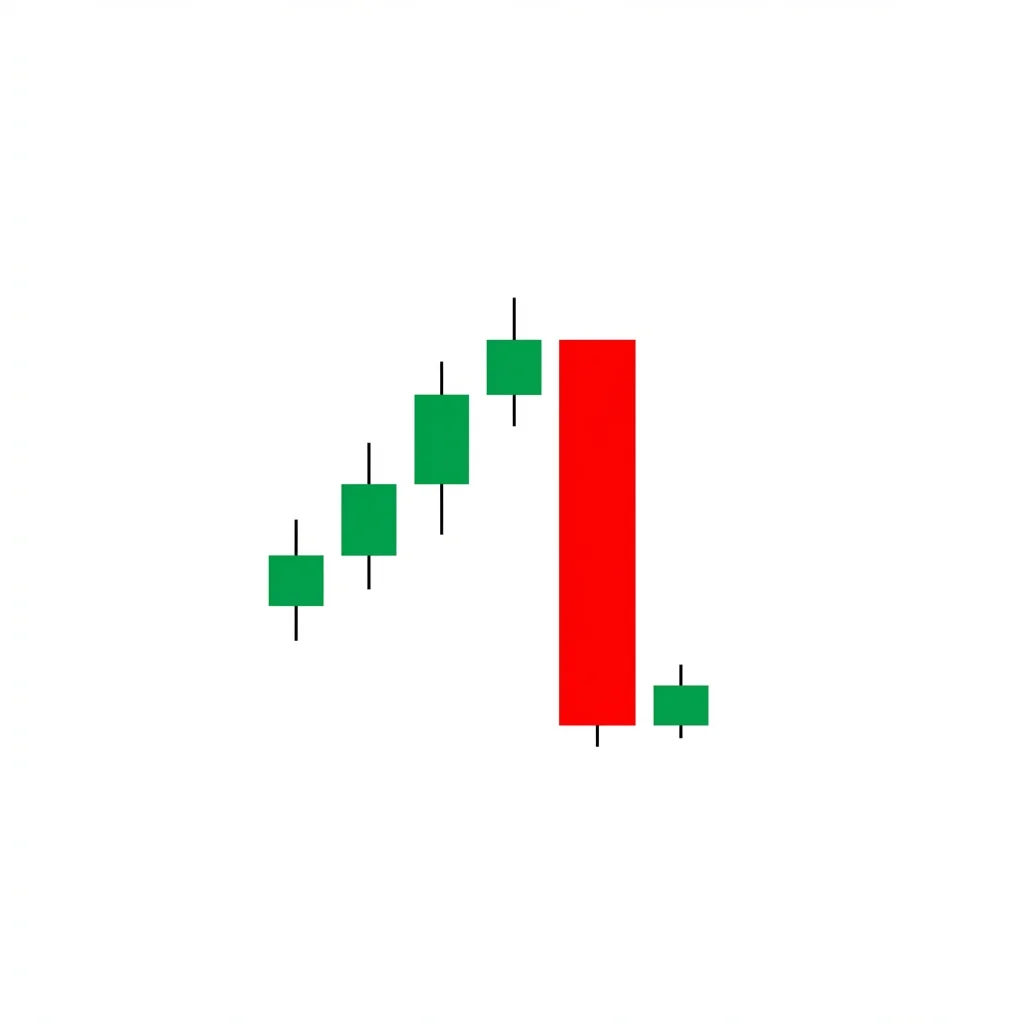
The Bearish Belt Hold is a single bearish candle that opens at its high and closes near its low with a long body, indicating that sellers dominated from the opening bell and controlled price action throughout the session.
The Bearish Belt Hold (Yorikiri) is a single-candle bearish reversal pattern that appears during an uptrend. The candle opens at or very near its high — meaning there is no upper shadow (or only a very small one). From the open, sellers immediately take control and drive price lower throughout the session, resulting in a long bearish body that closes near the low. The name 'Yorikiri' comes from sumo wrestling, describing a move where a wrestler pushes their opponent out of the ring from the opening stance. The pattern's significance increases with the length of the body, the absence of the upper shadow, and the volume behind the move. While less reliable as a standalone signal, the Belt Hold becomes powerful at resistance levels or when confirmed by other bearish signals.
History & Etymology
The Belt Hold pattern comes from Japanese candlestick tradition and is named after the sumo wrestling technique 'yorikiri,' where a wrestler grabs the opponent's belt and forces them out of the ring. This metaphor captures the decisive nature of the candle — sellers grab hold from the start and push price out of bullish territory. The pattern was documented in Japanese trading literature long before being introduced to Western markets.
Yorikiri in sumo wrestling means 'frontal force out' — the wrestler grabs the opponent's mawashi (belt) and drives them backward out of the ring. In trading, sellers 'grab' the market at the open and force prices lower without any initial bullish resistance, hence 'belt hold.'
How It Forms
Formation Steps
- 1Single bearish candle that opens at or very near its high (no upper shadow or very minimal)
- 2The candle has a long bearish body closing near the low
- 3A small lower shadow is acceptable but the body should dominate the candle's range
Prerequisites
- Established uptrend or the candle appears at a resistance level
- The open should be at or near the high of the candle (opening shaven head)
- The body should be relatively large compared to recent candles
Confirmation Signals
- Follow-through bearish candle the next day
- Break below the Belt Hold's low
- Above-average volume on the Belt Hold candle
- Bearish close on the following session
Invalidation Signals
- Price immediately rallies above the Belt Hold's open/high
- Very low volume on the Belt Hold candle
- Bullish candle that engulfs the Belt Hold the next day
Candle Breakdown
Belt Hold Candle
A single bearish candle opening at or near its high with a long body closing near its low. No upper shadow (or negligible). A small lower shadow is acceptable.
Sellers dominate from the very first trade. The market opens and immediately falls with no bullish counter. This is a statement of intent by sellers — there was no upward movement at all, indicating overwhelming sell pressure.
Psychology
The Bearish Belt Hold shows that sellers seized control from the opening price and never relinquished it. The absence of an upper shadow means there was zero bullish pushback after the open, representing a complete shift in sentiment.
Buyer Perspective
Buyers who expected the uptrend to continue are shocked by the immediate selling from the open. They have no opportunity to take profits at higher levels and must decide whether to hold through the loss or cut their positions.
Seller Perspective
Sellers are aggressive from the start, selling heavily at the open. Their confidence grows as price continues to fall throughout the session without any meaningful bounce, encouraging them to maintain or increase pressure.
Smart Money Action
Institutional sellers who have been accumulating short positions use the opening to dump inventory. The aggressive opening selling often reflects pre-market institutional orders being executed at the open.
Retail Trader Trap
Retail traders may have placed buy limit orders near the previous close, expecting a gap up or continuation. Instead, they are immediately filled and underwater as the Belt Hold drives price lower all day.
Emotional Cycle
Trading Strategy
Aggressive Entry
Enter short at the close of the Belt Hold candle, especially if the body is very long and volume is above average.
Conservative Entry
Wait for the next candle to close below the Belt Hold's low before entering short.
Nearest support level.
1.5x the length of the Belt Hold body projected downward from the low.
Previous swing low or 50% retracement of the preceding uptrend.
Best Conditions
- Timeframe: daily
- Timeframe: weekly
- Timeframe: 4h
- overbought conditions at resistance
- end of extended uptrend
- after a gap up open
- Asset: stocks
- Asset: futures
- Asset: crypto
Avoid When
- Timeframe: 1m
- Timeframe: 5m
- strong trending bull market
- low volatility environment
Confluence Factors
- Pattern appears at major resistance level
- Bearish RSI divergence
- Volume spike on the Belt Hold
- Pattern appears after a gap up that fails
- The Belt Hold body is the largest of the last 10 candles
Scale In Strategy
Enter 50% at the Belt Hold close, add 50% on confirmation candle.
Scale Out Strategy
Take 50% at first support, trail the rest.
Risk Management
Volume Analysis
Volume Confirmation
High volume on the Belt Hold significantly increases its reliability. Volume should be at least 1.5x the 20-day average.
Volume Profile
A single large-volume bearish candle appearing after lower-volume bullish candles is the ideal setup.
Volume Divergence
If the uptrend had declining volume before the Belt Hold, this provides additional bearish confluence.
Technical Confluence
Support Resistance
The Belt Hold is most powerful when it appears at a well-defined resistance level. The open of the Belt Hold (which is the high) often becomes a new resistance level.
Fibonacci Levels
The Belt Hold appearing at a Fibonacci extension level (127.2%, 161.8%) of a prior swing adds significant confluence.
Moving Averages
A Belt Hold that opens above the upper Bollinger Band or at a key moving average resistance (200 MA) is more significant.
Rsi Confirmation
RSI above 70 when the Belt Hold forms adds overbought confirmation to the bearish signal.
Macd Confirmation
A MACD bearish crossover on the same day as the Belt Hold provides strong confirmation.
Bollinger Bands
A Belt Hold that opens at or above the upper Bollinger Band and closes back inside is a powerful mean-reversion signal.
Vwap
A Belt Hold that opens above VWAP and closes below it shows a complete session dominated by sellers.
Ichimoku Cloud
The Belt Hold is strongest when it forms above the cloud and the Chikou Span is turning bearish.
Elliott Wave
The Belt Hold often marks the end of a Wave 5 impulse or the peak of a Wave B correction.
Wyckoff Phase
Aligns with the Buying Climax or Upthrust phase in Wyckoff distribution.
Market Profile
A Belt Hold forming at the upper value area boundary or at a poor high is technically significant.
Order Flow
Watch for large market sell orders at the open with minimal buy-side absorption.
Open Interest
In futures, rising open interest on the Belt Hold day confirms new short positions being established.
Multi-Timeframe Analysis
Higher Timeframe Alignment
A daily Belt Hold is most powerful when the weekly chart shows resistance or overbought conditions.
Lower Timeframe Entry
After a daily Belt Hold, drop to the 15-minute or 1-hour chart to find lower-risk entry points on minor bounces.
Timeframe Confluence
A weekly Belt Hold is a strong signal that can set the tone for the entire week ahead.
Top-Down Approach
Weekly: identify resistance zone. Daily: confirm with Belt Hold. 4H: fine-tune entry and stop placement.
Statistics
Historical Examples
Nikkei 225 Belt Hold at 30,000
successThe Nikkei formed a classic Belt Hold at the psychologically significant 30,000 level. The index opened at 30,795 (its high) and closed at 30,511, followed by a 2,000-point decline over the next two weeks.
Lesson: The Belt Hold at a round-number psychological resistance level is particularly effective, especially in the Japanese market where the pattern originated.
Amazon (AMZN) Belt Hold Failure
failureAMZN printed a Belt Hold at $103 but the very next day gapped up and closed above the Belt Hold's open, immediately invalidating the pattern.
Lesson: As a single-candle pattern, the Belt Hold has limited reliability on its own. Always wait for confirmation and use it as part of a broader analysis framework.
Variations
Gap Up Belt Hold
The Belt Hold opens with a gap above the previous close, making the failed gap even more bearish.
Long Belt Hold
A Belt Hold where the body covers more than 3% of price in stocks or 2% in indices.
Confusion Matrix
Patterns commonly confused with Bearish Belt Hold and how to distinguish them.
Bearish Marubozu
8500% similarIf there is absolutely no lower shadow, it is a Marubozu. If there is a small lower shadow but no upper shadow, it is a Belt Hold.
Key Differences
- Marubozu has no shadows at all (neither upper nor lower)
- Belt Hold has no upper shadow but may have a small lower shadow
- Marubozu is a stronger version of the Belt Hold
Bearish Closing Marubozu
6500% similarCheck which shadow is missing. No upper shadow = Belt Hold. No lower shadow = Closing Marubozu.
Key Differences
- Closing Marubozu has no lower shadow (close equals the low)
- Belt Hold has no upper shadow (open equals the high)
- They are essentially opposite shaving patterns
The Bearish Closing Marubozu is a single bearish candle with no lower shadow — the close is at the exact low of the session. This indicates that sellers controlled the session and maintained pressure through the very last trade, a sign of strong bearish conviction.
The Dark Cloud Cover is a two-candle bearish reversal pattern where a bearish candle opens above the prior bullish candle's high and closes below its midpoint, signaling that the bullish 'sky' is being covered by a bearish 'dark cloud.'
The Bearish Engulfing is one of the most powerful and commonly traded two-candle reversal patterns. A large bearish candle completely engulfs the prior bullish candle, demonstrating a decisive shift from buying to selling dominance.
The bearish marubozu is a single candle with no shadows — price opened at the high and closed at the low, showing complete seller domination throughout the entire session with no buying resistance.
The bearish opening marubozu is a single candle where the open equals the high (no upper shadow), showing that sellers took immediate control at the open and maintained pressure throughout the session. A small lower shadow may be present.
The shooting star is a single-candle bearish reversal pattern with a small body near the low and a long upper shadow. It shows that buyers pushed price significantly higher during the session but sellers drove it back down, signaling a potential top.
Pro Tips & Common Mistakes
Pro Tips
- The longer the Belt Hold's body relative to recent candles, the more significant the signal. A Belt Hold that is 2-3 standard deviations larger than the average candle body is noteworthy.
- A Belt Hold that opens with a gap up and then closes well below the gap level is extremely bearish — it combines the Belt Hold with a failed gap pattern.
- In Japanese markets, the Belt Hold is given more weight because of its cultural connection to sumo wrestling, and many Japanese institutional traders watch for it.
- Use the Belt Hold as a filter: if you see one at resistance, avoid taking new long positions even if you do not short.
Common Mistakes
- Trading the Belt Hold without confirmation — as a single candle pattern, it needs follow-through.
- Confusing any bearish candle with a Belt Hold — the key is the absence of the upper shadow (open must be at or very near the high).
- Placing stops too close below the Belt Hold's open — the retest of the open level occurs 55% of the time.
- Ignoring the size of the body — a small Belt Hold in a strong uptrend is rarely significant.
Advanced Techniques
- Combine the Belt Hold with order flow analysis. Large prints at the open (institutional selling) followed by consistent time and sales selling confirms the pattern.
- Use the Belt Hold open level as a key reference point for future trades. This level often acts as resistance on subsequent rallies.
- In options, the Belt Hold is a signal to sell call spreads or buy puts, using the Belt Hold's open as the strike level.
Institutional Perspective
Institutions often trigger Belt Hold candles by executing large sell orders at the market open. When institutional selling arrives all at once, there is no upper shadow because the first trade is also the highest trade. Watching for large block trades at the open can help identify institutional Belt Holds.
Fun Facts
- Yorikiri is the most common winning technique in professional sumo wrestling, accounting for about 30% of all victories — fitting for one of the more common single-candle patterns.
- The Belt Hold is one of the few candlestick patterns directly named after a martial arts technique.
- In the Tokyo Stock Exchange, the Belt Hold is still watched by Japanese institutional traders as one of the traditional candlestick signals.
Frequently Asked Questions
The Bearish Belt Hold is a single bearish candle that opens at its high (no upper shadow) and has a long body closing near the low. It may have a small lower shadow. The key feature is the absence of the upper shadow, indicating sellers controlled from the opening trade.
The name comes from the sumo wrestling technique 'yorikiri,' where a wrestler grabs the opponent's belt (mawashi) and forces them out of the ring. Similarly, sellers 'grab hold' of the market at the open and force prices down decisively.
As a standalone single-candle pattern, the Belt Hold has moderate reliability (around 52% win rate). Its effectiveness increases significantly when combined with confirmation signals, resistance levels, and volume analysis.