Overview
Bullish Doji Star
Doji Boshi
Also known as: Morning Doji, Doji at Bottom, Star Doji
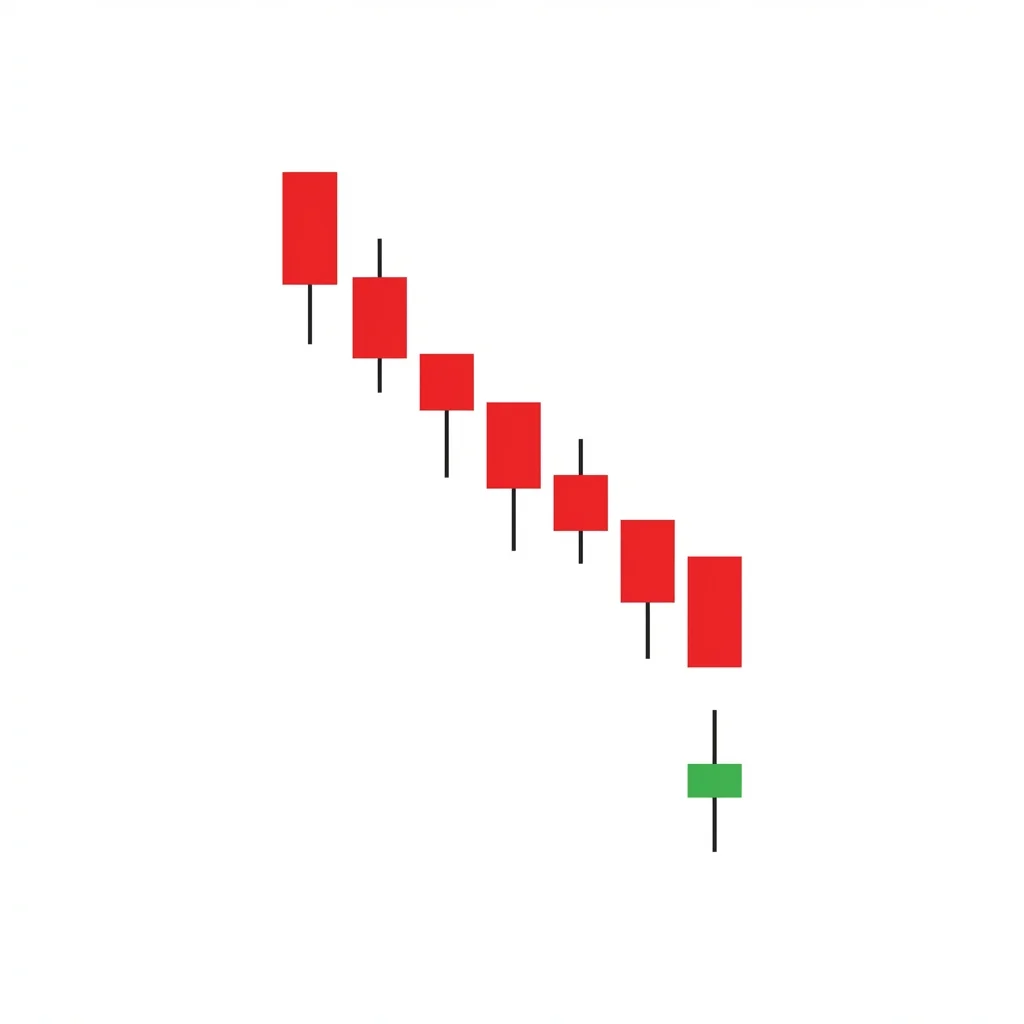
The Bullish Doji Star is a two-candle pattern where a doji gaps below a bearish candle, signaling that selling momentum has stalled and a potential reversal is forming.
The Bullish Doji Star appears at the bottom of a downtrend when a long bearish candle is followed by a doji that gaps below it. The doji (where open and close are virtually equal) represents perfect equilibrium between buyers and sellers after a period of strong selling. The gap down into the doji shows that sellers made one final push, but their inability to close the session lower than the open signals exhaustion. The Doji Star is often the first two candles of a Morning Doji Star pattern and requires bullish confirmation on the third candle to be actionable. By itself, it is a warning signal that the downtrend may be ending.
History & Etymology
The Doji Star is a classical Japanese candlestick pattern. The term star refers to any small-bodied candle that gaps away from the prior candle. When the star is a doji, it carries extra significance due to the perfect balance between supply and demand.
Doji means same in Japanese, referring to the open and close being at the same price. Star (boshi) refers to the candle gapping away from the prior candle body, like a star separated from the earth.
How It Forms
Formation Steps
- 1First candle: long bearish candle continuing the downtrend
- 2Second candle: doji that gaps below the first candle body, indicating a star position
Prerequisites
- Established downtrend
- First candle should be long-bodied bearish
- Gap down into the doji (body gap preferred)
Confirmation Signals
- Third candle closes bullish and above the doji high
- Volume increases on the bullish confirmation
- The doji shows indecision at a support level
Invalidation Signals
- Price continues lower after the doji
- No bullish follow-through within 2 sessions
- Heavy volume selling continues
Candle Breakdown
Bearish Candle
A long bearish candle that confirms the ongoing downtrend.
Bears remain in control. Selling continues with conviction.
Doji Star
A doji candle that gaps below the first candle, showing complete indecision.
The gap down shows sellers still trying, but the doji reveals they have lost momentum. Buyers and sellers are in perfect balance.
Psychology
The Doji Star captures the moment when bearish momentum transitions to indecision. The gap down looks bearish, but the doji reveals that sellers cannot push the close below the open, signaling exhaustion.
Buyer Perspective
Buyers begin to see value at these depressed levels. Their equal matching of sellers (creating the doji) is the first sign of demand emerging.
Seller Perspective
Sellers pushed for one more gap down but could not maintain any directional progress. The doji is a red flag for their positions.
Smart Money Action
Institutional buyers begin testing buy levels during the doji session, matching seller flow exactly.
Retail Trader Trap
Retail traders see the gap down and sell more, but the doji tells them their selling is being absorbed.
Emotional Cycle
Trading Strategy
Aggressive Entry
Enter long at the close of the doji if it forms at a key support level with low volume.
Conservative Entry
Wait for a bullish third candle to close above the doji high (completing a Morning Doji Star).
At the midpoint of the first bearish candle body.
At the high of the first bearish candle.
At the prior swing high.
Best Conditions
- Timeframe: daily
- Timeframe: weekly
- At the end of downtrends
- At major support levels
- During oversold conditions
- Asset: stocks
- Asset: futures
- Asset: crypto
Avoid When
- Timeframe: 1m
- Timeframe: 5m
- In strong bear markets
- Far from any support levels
Confluence Factors
- Doji at key support
- RSI oversold
- Volume declining
- Fibonacci level confluence
Scale In Strategy
Enter 30% on the doji, add 70% on confirmation.
Scale Out Strategy
Take 50% at the first target, trail the rest.
Risk Management
Volume Analysis
Volume Confirmation
Low volume on the doji (selling drying up) followed by high volume on the confirmation candle is ideal.
Volume Profile
Volume should decline from the first candle to the doji.
Volume Divergence
High volume on the doji without directional movement confirms the stalemate.
Technical Confluence
Support Resistance
A doji star at a significant support level is much more meaningful than one in a vacuum.
Fibonacci Levels
A doji at a 61.8% or 78.6% Fibonacci level adds major confluence.
Moving Averages
A doji at the 200 SMA or 50 SMA is a high-probability setup.
Rsi Confirmation
RSI below 30 during the doji confirms oversold conditions ripe for reversal.
Macd Confirmation
MACD showing decreasing negative momentum during the doji supports the exhaustion thesis.
Bollinger Bands
A doji at or below the lower Bollinger Band is a strong mean-reversion signal.
Vwap
On intraday charts, a doji at VWAP shows equilibrium at fair value.
Ichimoku Cloud
A doji at the Senkou Span B shows the cloud providing support.
Elliott Wave
May mark the end of a Wave C correction.
Wyckoff Phase
Can appear during the secondary test in accumulation.
Market Profile
A doji at the value area low shows price testing and holding value.
Order Flow
Balanced delta (near zero) on the doji confirms equal buying and selling.
Open Interest
Stable open interest during the doji suggests no new directional positions.
Multi-Timeframe Analysis
Higher Timeframe Alignment
A daily doji star at weekly support has the highest significance.
Lower Timeframe Entry
Use the 1-hour chart to watch for the reversal forming within the doji session.
Timeframe Confluence
A weekly doji star is rare but very powerful, signaling potential major trend change.
Top-Down Approach
Weekly support, daily identifies doji star, 4-hour confirms reversal.
Statistics
Historical Examples
AMD Doji Star at 200-Day SMA
successAMD formed a doji star at the 200-day SMA after a sharp pullback. The doji gapped below the prior bearish candle and showed complete indecision. A strong bullish candle the next day confirmed the reversal.
Lesson: Doji stars at major moving averages are high-probability setups, especially when confirmed by the next session.
Variations
Long-Legged Doji Star
The doji has very long shadows, showing extreme intraday volatility with no directional resolution.
Confusion Matrix
Patterns commonly confused with Bullish Doji Star and how to distinguish them.
Bullish Morning Doji Star
8500% similarIf there is a bullish third candle completing the reversal, it is a Morning Doji Star. Without it, it is just a Doji Star (warning signal).
Key Differences
- Morning Doji Star includes the third confirmation candle
- Doji Star is just the first two candles without confirmation
The Bearish Doji Star is a two-candle reversal pattern featuring a strong bullish candle followed by a doji that gaps above it, signaling that buying momentum has stalled and indecision has replaced conviction at the top of an uptrend.
The Bullish Abandoned Baby is one of the rarest and most reliable reversal patterns in candlestick analysis. It features a doji completely isolated by gaps on both sides, signaling an abrupt shift from bearish to bullish sentiment.
The Bullish Engulfing is one of the most popular and reliable two-candle reversal patterns. A large bullish candle completely engulfs the prior bearish candle body, signaling a decisive shift from selling to buying control.
The Morning Doji Star is a three-candle bullish reversal pattern where a bearish candle, a gapped-down doji, and a strong bullish candle combine to signal a decisive bottom — more powerful than the standard Morning Star due to the doji's complete indecision signal.
The Morning Star is a three-candle bullish reversal pattern consisting of a large bearish candle, a small star candle showing indecision, and a large bullish candle confirming the reversal. It is one of the most widely recognized and reliable bottom reversal signals.
The Bullish Three Inside Up is a three-candle reversal pattern that combines a bullish harami with a confirming third candle that closes above the first candle's open, providing a more reliable reversal signal than the harami alone.
Pro Tips & Common Mistakes
Pro Tips
- The doji star by itself is a warning, not a signal. Always wait for confirmation
- The smaller the doji body (closer to true doji), the more significant the indecision signal
- A gap down into the doji is important since without the gap it is just a doji in a downtrend
- Volume should noticeably decrease on the doji relative to the prior candle
Common Mistakes
- Trading the doji star without waiting for confirmation
- Not requiring a gap between the bearish candle and the doji
- Ignoring the context since a doji in a strong downtrend without support is less meaningful
- Confusing any doji in a downtrend with a doji star pattern
Advanced Techniques
- Use the doji star as a pre-alert to prepare for a possible Morning Doji Star trade
- Measure the gap size between the bearish candle and doji to gauge the exhaustion level
- Combine with options flow analysis to see if institutional positioning is changing
Institutional Perspective
Institutional traders view the doji star as a leading indicator of potential reversal. They begin placing limit buy orders around the doji level, ready to scale in if confirmation follows.
Fun Facts
- In Japanese candlestick tradition, the doji was called the cross because of its shape, and a cross after a decline was considered an important omen of change.
- Gregory Morris found that the doji star appears more frequently than the full morning doji star because the confirmation candle requirement filters out many occurrences.
Frequently Asked Questions
The doji star alone is a warning signal, not a confirmed trading signal. It tells you to watch for a reversal, but you should wait for a bullish confirmation candle before entering a trade. Trading the doji star without confirmation leads to a high rate of false signals.