Overview
Bullish Morning Doji Star
Ake no Myojyo Doji
Also known as: Morning Doji Star, Doji Star Reversal
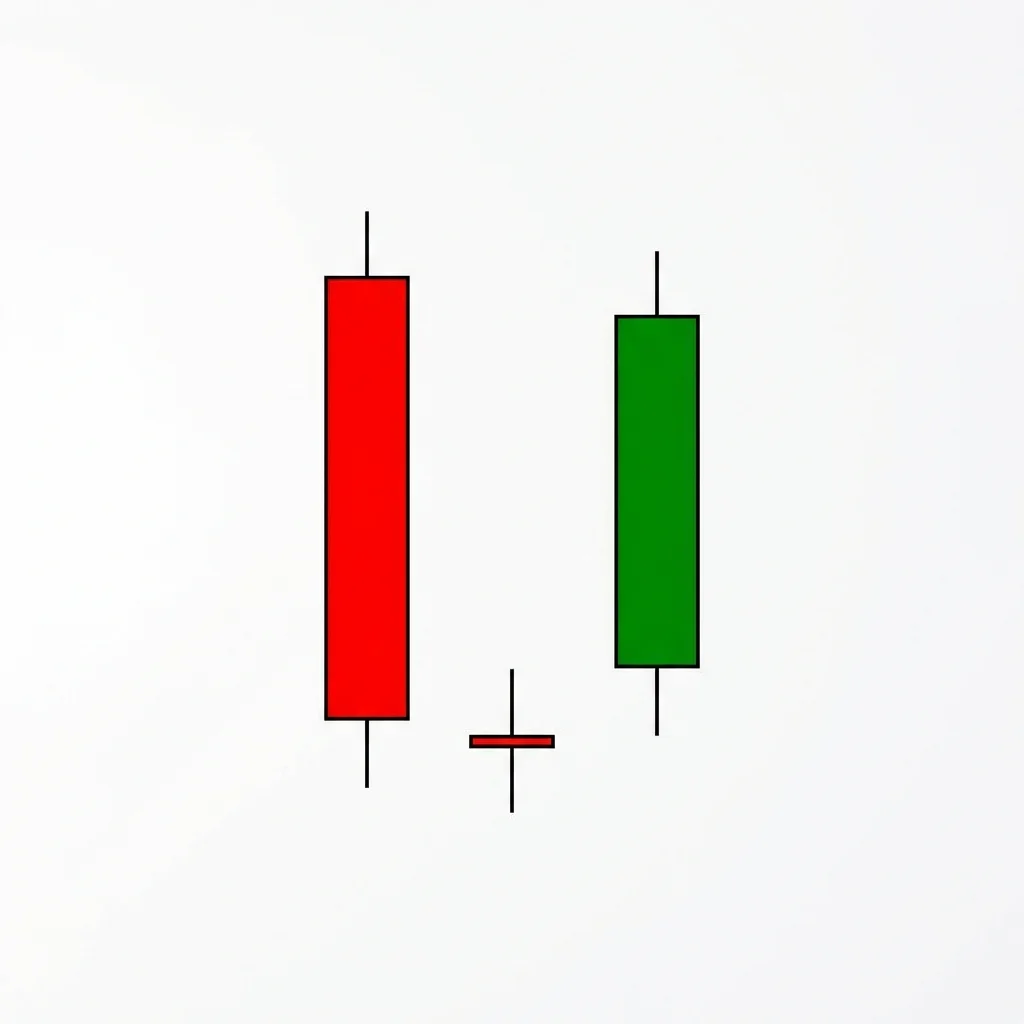
The Morning Doji Star is a three-candle bullish reversal pattern where a bearish candle, a gapped-down doji, and a strong bullish candle combine to signal a decisive bottom — more powerful than the standard Morning Star due to the doji's complete indecision signal.
The Morning Doji Star is a stronger variant of the Morning Star pattern. It forms at the bottom of a downtrend with three candles. The first is a large bearish candle confirming the downtrend. The second is a doji that gaps below the first candle, showing that selling momentum has exhausted and the market has reached complete equilibrium. The third candle is a strong bullish candle that closes well into the first candle's body, confirming the reversal. The doji in the middle is what makes this pattern more powerful than the standard Morning Star — while a small body shows some directional bias, a doji shows absolutely no bias, making the subsequent bullish candle a more dramatic shift.
History & Etymology
The Morning Doji Star is part of the classical Japanese star family of patterns. The star patterns — Evening Star, Morning Star, and their doji variants — are among the most respected reversal signals in Japanese candlestick analysis.
The 'morning star' is Venus, appearing before sunrise as a herald of a new day. In candlestick analysis, the morning star heralds a bullish reversal. The 'doji' refers to the cross-shaped second candle showing perfect balance.
How It Forms
Formation Steps
- 1First candle: large bearish candle continuing the downtrend
- 2Second candle: a doji that gaps below the first candle's close
- 3Third candle: large bullish candle that closes well into the first candle's body (above the midpoint)
Prerequisites
- Established downtrend
- The doji gaps down from the first candle
- The third candle closes above the first candle's midpoint
Confirmation Signals
- Third candle closes above the first candle's midpoint
- Volume increases on the third candle
- The gap between first and second candle remains unfilled initially
Invalidation Signals
- Third candle fails to close above the first candle's midpoint
- Price falls below the doji's low
- No bullish follow-through
Candle Breakdown
Bearish Body
A large bearish candle continuing the downtrend
Bears remain in control, driving price lower with conviction.
Doji Star
A doji that gaps below the first candle, showing complete indecision
Selling exhaustion is complete. The market reaches perfect equilibrium between buyers and sellers.
Bullish Confirmation
A strong bullish candle that closes above the first candle's midpoint
Buyers seize control decisively. The reversal is confirmed with conviction.
Psychology
The Morning Doji Star captures the three-phase reversal process: bearish dominance, complete equilibrium (doji), and bullish takeover. The doji acts as the pivot point where the trend changes.
Buyer Perspective
The doji signals that sellers are completely exhausted. Buyers see this equilibrium as their opportunity to take control, which they do emphatically on the third candle.
Seller Perspective
After a strong bearish push, sellers are alarmed when the doji shows zero follow-through. The strong bullish third candle forces remaining bears to capitulate.
Smart Money Action
Institutions accumulate heavily at the doji level. The complete indecision provides the stable environment they need for large order execution. The bullish third candle reflects their completed accumulation.
Retail Trader Trap
Retail bears who added to shorts at the doji (seeing it as more weakness) are crushed by the third candle's reversal.
Emotional Cycle
Trading Strategy
Aggressive Entry
Enter at the close of the third candle.
Conservative Entry
Wait for a fourth bullish candle to confirm the reversal.
Previous swing high.
2:1 R:R.
Measured move equal to the first candle's body projected upward.
Best Conditions
- Timeframe: daily
- Timeframe: 4h
- Timeframe: weekly
- oversold conditions
- at major support
- after extended decline
- Asset: stocks
- Asset: forex
- Asset: indices
- Asset: crypto
Avoid When
- Timeframe: 1m
- Timeframe: 5m
- strong bear market momentum
- during panic selling
- liquidity crisis
Confluence Factors
- Pattern at major support
- RSI oversold with bullish divergence
- Volume confirms (high-low-high)
- Fibonacci support at the doji
- Moving average proximity
Scale In Strategy
Enter on candle 3, add on the first pullback to the third candle's body.
Scale Out Strategy
Scale out at each profit target.
Risk Management
Volume Analysis
Volume Confirmation
Volume should be high on candle 1, low on the doji, and high on candle 3.
Volume Profile
High-low-high volume pattern across the three candles is textbook.
Volume Divergence
High volume on the doji may indicate climactic selling rather than equilibrium — still potentially bullish.
Technical Confluence
Support Resistance
The doji level becomes strong support. The pattern is most reliable at established support.
Fibonacci Levels
Doji at the 61.8% or 78.6% retracement adds strong confluence.
Moving Averages
Pattern at the 50 or 200-day MA adds major confirmation.
Rsi Confirmation
RSI below 30 with bullish divergence is the ideal companion.
Macd Confirmation
MACD bullish crossover on the third candle confirms momentum reversal.
Bollinger Bands
Doji at or below the lower band with the third candle recovering inside.
Vwap
Doji below VWAP with the third candle reclaiming it.
Ichimoku Cloud
Pattern below the cloud with the third candle approaching the cloud.
Elliott Wave
Typically appears at the end of Wave 5 or Wave C.
Wyckoff Phase
Often forms during the selling climax or spring phase.
Market Profile
The doji at a poor low or single print confirms exhaustion.
Order Flow
Buy absorption at the doji followed by aggressive buying on candle 3.
Open Interest
Declining OI on the doji confirms short exhaustion.
Multi-Timeframe Analysis
Higher Timeframe Alignment
A daily Morning Doji Star at weekly support is extremely powerful.
Lower Timeframe Entry
After the daily pattern completes, use 4H for precision entry timing.
Timeframe Confluence
The doji level on the daily should coincide with weekly support.
Top-Down Approach
Identify weekly support, spot the daily Morning Doji Star, enter on the third candle close.
Statistics
Historical Examples
Amazon Morning Doji Star Bottom
successAmazon formed a textbook Morning Doji Star near $100 after an extended selloff. The doji marked the exact bottom, and the stock rallied 30% over the next two months.
Lesson: Morning Doji Stars at major support levels in quality stocks can mark significant bottoms.
Variations
Abandoned Baby
A Morning Doji Star where the doji has gaps on BOTH sides.
Morning Star (Standard)
The middle candle has a small body instead of a doji.
Confusion Matrix
Patterns commonly confused with Bullish Morning Doji Star and how to distinguish them.
Bullish Morning Star
9000% similarCheck the middle candle. If open = close (doji), it's a Morning Doji Star. If there's a small body, it's a standard Morning Star.
Key Differences
- Morning Star has a small body as the middle candle
- Morning Doji Star has a doji — stronger indecision signal
Bullish Abandoned Baby
8000% similarIf there are gaps on both sides of the doji (no overlap), it's an Abandoned Baby. If only one gap, it's a Morning Doji Star.
Key Differences
- Abandoned Baby has gaps on BOTH sides of the doji
- Morning Doji Star only requires a gap below (first to second)
The Evening Doji Star is a top-tier three-candle bearish reversal pattern. The doji in the star position represents the pivot point between bullish confidence (first candle) and bearish dominance (third candle), making it one of the most reliable reversal signals in candlestick analysis.
The Bullish Abandoned Baby is one of the rarest and most reliable reversal patterns in candlestick analysis. It features a doji completely isolated by gaps on both sides, signaling an abrupt shift from bearish to bullish sentiment.
The Bullish Doji Star is a two-candle pattern where a doji gaps below a bearish candle, signaling that selling momentum has stalled and a potential reversal is forming.
The Bullish Engulfing is one of the most popular and reliable two-candle reversal patterns. A large bullish candle completely engulfs the prior bearish candle body, signaling a decisive shift from selling to buying control.
The Morning Star is a three-candle bullish reversal pattern consisting of a large bearish candle, a small star candle showing indecision, and a large bullish candle confirming the reversal. It is one of the most widely recognized and reliable bottom reversal signals.
The Bearish Abandoned Baby is one of the rarest and most reliable top reversal patterns in candlestick analysis. It features a doji that is completely isolated by gaps on both sides, signaling an abrupt and dramatic shift from buying to selling pressure.
Pro Tips & Common Mistakes
Pro Tips
- The gap between the first candle and the doji is important — it shows the final bearish thrust before exhaustion
- The third candle should close ABOVE the first candle's midpoint for a valid signal
- The doji's shadow length matters — longer shadows indicate wider price exploration and stronger reversal potential
- Volume pattern of high-low-high across the three candles is the gold standard confirmation
- This pattern is more reliable than the standard Morning Star because the doji signals complete indecision
Common Mistakes
- Not requiring a gap between the first and second candle — the gap is part of the definition
- Accepting a third candle that doesn't close above the first candle's midpoint
- Confusing this with the standard Morning Star — check if the middle candle is truly a doji
- Entering before the third candle closes, risking a failed reversal
- Ignoring the overall trend context — a prior downtrend is required
Advanced Techniques
- The doji's shadows create a range — if price doesn't violate this range on the third candle's pullback, the signal is strong
- Combine with weekly chart analysis to confirm the daily Morning Doji Star occurs at a significant level
- Use delta volume on the third candle to confirm buy-initiated volume
- Apply the pattern in harmonic contexts — it often appears at harmonic completion points
Institutional Perspective
The Morning Doji Star, especially with proper volume characteristics, is one of the patterns institutional technical analysts track most closely. The doji's equilibrium at the bottom, followed by strong buying, maps perfectly to the accumulation → markup transition that institutions aim for.
Fun Facts
- The Morning Doji Star is sometimes called the 'Rosetta Stone' of candlestick reversals because it so clearly captures the three phases of reversal.
- In traditional Japanese analysis, the doji star was considered especially auspicious because the doji represented a spiritual crossroads.
- Studies show the Morning Doji Star performs about 5-10% better than the standard Morning Star across all markets.
Frequently Asked Questions
A three-candle bullish reversal: a bearish candle, a gapped-down doji (showing complete indecision), and a bullish candle closing into the first candle's body. The doji makes it more powerful than the standard Morning Star.
Yes. The doji signals complete market equilibrium, making the subsequent bullish reversal a more significant shift than when a small body (slight directional bias) appears.