Overview
Bullish Morning Star
Ake no Myojyo (明けの明星)
Also known as: Morning Star Reversal, Three-Candle Bottom Reversal
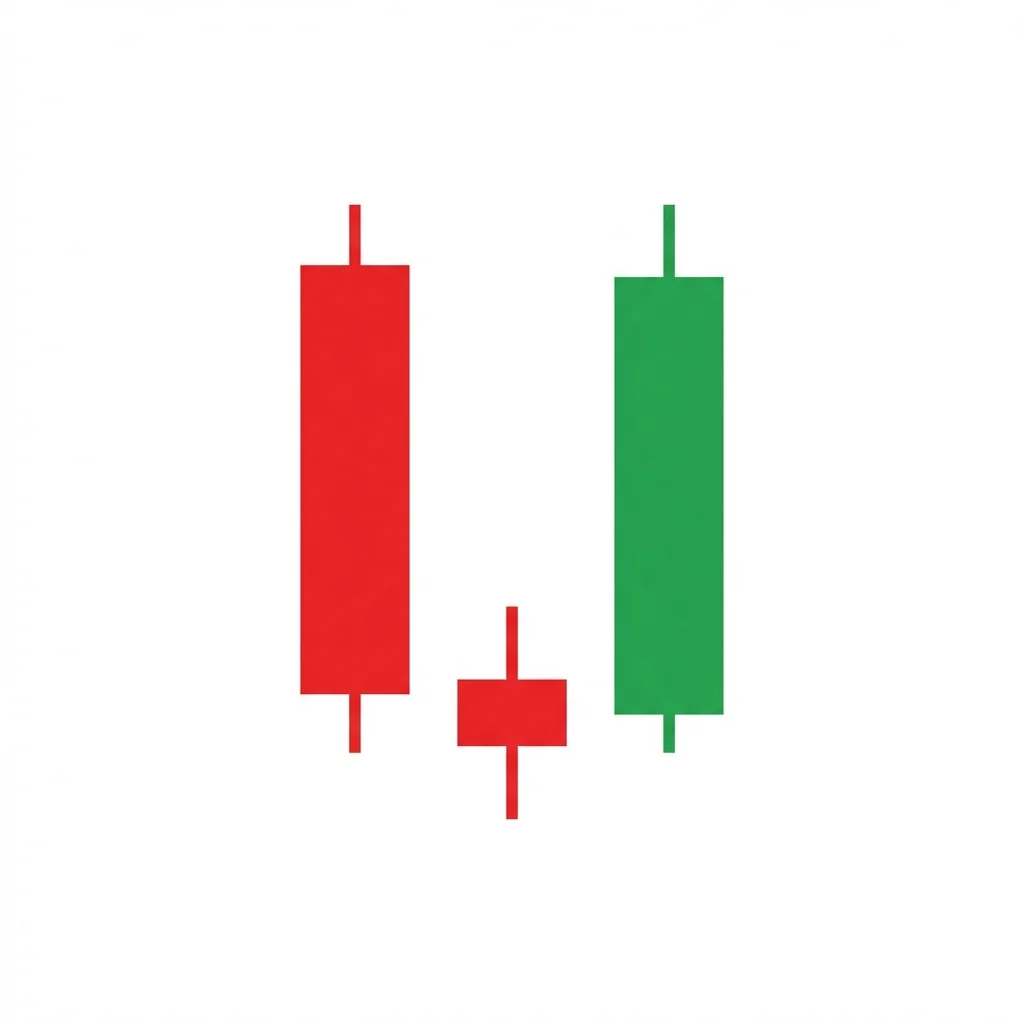
The Morning Star is a three-candle bullish reversal pattern consisting of a large bearish candle, a small star candle showing indecision, and a large bullish candle confirming the reversal. It is one of the most widely recognized and reliable bottom reversal signals.
The Morning Star is one of the most popular and reliable three-candle reversal patterns. It appears at the bottom of a downtrend and consists of three distinct candles: a large bearish candle showing continued selling, a small-bodied 'star' candle that gaps down showing the trend is losing momentum, and a large bullish candle that recovers into the first candle's body showing buyers have seized control. The pattern is named after Venus, the 'morning star' that appears before sunrise, heralding a new day — just as this pattern heralds a new bullish trend.
History & Etymology
The Morning Star is one of the most classical patterns in Japanese candlestick analysis, documented since Munehisa Homma's 18th-century rice trading. It was introduced to Western traders by Steve Nison and has become one of the most taught reversal patterns worldwide.
Named after the morning star (Venus), which appears in the sky just before sunrise, symbolizing the end of darkness (downtrend) and the coming of light (bullish reversal).
How It Forms
Formation Steps
- 1First candle: large bearish candle continuing the downtrend
- 2Second candle: small-bodied candle (any color) that gaps below the first candle's close
- 3Third candle: large bullish candle that closes above the first candle's midpoint
Prerequisites
- Prior downtrend
- Second candle has a small body
- Third candle closes above the midpoint of the first candle's body
Confirmation Signals
- Third candle closes into the first candle's body
- Volume increases on the third candle
- Fourth candle continues higher
Invalidation Signals
- Third candle fails to close above the first candle's midpoint
- Price breaks below the star's low
- No follow-through after the third candle
Candle Breakdown
Bearish Body
A large bearish candle continuing the downtrend with strong selling pressure
Bears remain firmly in control. The downtrend appears to be continuing.
Star Candle
A small-bodied candle that gaps below the first, showing momentum loss
The gap down shows one last push lower, but the tiny body reveals selling momentum has evaporated.
Bullish Confirmation
A large bullish candle closing above the first candle's midpoint
Buyers take charge with conviction. The close above the midpoint proves the reversal.
Psychology
The Morning Star captures the classic three-phase reversal: continued trend (bearish candle), indecision/exhaustion (star), and reversal confirmation (bullish candle). Each phase represents a distinct shift in the market's emotional state.
Buyer Perspective
Buyers recognize the star as a sign of seller exhaustion. The third candle's strong advance confirms their thesis, and they enter aggressively.
Seller Perspective
Sellers who drove the first candle lower are increasingly worried by the star's lack of follow-through. The third candle's bullish surge forces capitulation.
Smart Money Action
Institutions begin accumulating at the star and buy aggressively on the third candle. The star's low volume makes it ideal for position building without price impact.
Retail Trader Trap
Retail bears who added shorts at the star are the primary victims of the third candle's reversal.
Emotional Cycle
Trading Strategy
Aggressive Entry
Enter at the close of the third candle.
Conservative Entry
Wait for a fourth bullish candle to confirm.
Previous swing high.
2:1 R:R.
Measured move equal to the pattern height.
Best Conditions
- Timeframe: daily
- Timeframe: 4h
- Timeframe: weekly
- oversold
- at support
- after extended decline
- Asset: stocks
- Asset: forex
- Asset: indices
- Asset: crypto
- Asset: commodities
Avoid When
- Timeframe: 1m
- Timeframe: 5m
- strong bear momentum
- macro crisis
Confluence Factors
- Major support level
- RSI oversold
- Moving average support
- Fibonacci level
- Volume confirms
Scale In Strategy
Enter on candle 3, add on first pullback.
Scale Out Strategy
Scale out at each profit target.
Risk Management
Volume Analysis
Volume Confirmation
High-low-high volume across the three candles.
Volume Profile
Declining volume on the star confirms selling exhaustion.
Volume Divergence
High volume on the star can indicate climactic selling — still potentially bullish.
Technical Confluence
Support Resistance
The star's low marks the reversal point and becomes key support.
Fibonacci Levels
The pattern at the 50% or 61.8% retracement is particularly strong.
Moving Averages
Morning Star at the 200-day MA is a textbook high-probability setup.
Rsi Confirmation
RSI below 30 with bullish divergence maximizes the signal.
Macd Confirmation
MACD bullish crossover on the third candle confirms.
Bollinger Bands
Star at the lower band with the third candle recovering inside.
Vwap
Below VWAP at the star, reclaiming on the third candle.
Ichimoku Cloud
Pattern below the cloud signals a potential trend reversal.
Elliott Wave
Commonly marks the end of Wave 5 or Wave C.
Wyckoff Phase
Maps to the selling climax and automatic rally in accumulation.
Market Profile
Star at a poor low or value area extreme.
Order Flow
Buy absorption on the star, aggressive buying on candle 3.
Open Interest
Declining OI at the star confirms exhaustion.
Multi-Timeframe Analysis
Higher Timeframe Alignment
A daily Morning Star at weekly support is one of the strongest setups.
Lower Timeframe Entry
Use 4H for entry timing after the daily pattern forms.
Timeframe Confluence
The star level on multiple timeframes creates strong support.
Top-Down Approach
Weekly support identification, daily Morning Star, 4H entry.
Statistics
Historical Examples
S&P 500 Morning Star Bottom
successThe S&P 500 formed a Morning Star pattern at the COVID-19 bottom. The star candle on March 23rd gapped down but found support, and the following bullish candle launched the recovery rally.
Lesson: Morning Stars at major market bottoms can mark the start of multi-month rallies.
EUR/USD Morning Star at Support
successEUR/USD formed a Morning Star at 1.0450 support. The pattern marked the low, and the pair rallied 300+ pips.
Lesson: Even in forex where gaps are rarer, Morning Stars at key levels are powerful signals.
Variations
Morning Doji Star
The star candle is a doji instead of a small body.
Abandoned Baby
Gaps on both sides of the star, isolating it completely.
Confusion Matrix
Patterns commonly confused with Bullish Morning Star and how to distinguish them.
Bullish Morning Doji Star
9000% similarIf the middle candle's open and close are identical (doji), it's a Morning Doji Star.
Key Differences
- Morning Doji Star has a doji as the middle candle
- Standard Morning Star has a small body
Bullish Three Inside Up
6000% similarCheck for a gap between candle 1 and candle 2. Morning Star requires it; Three Inside Up does not.
Key Differences
- Three Inside Up doesn't require a gap
- Morning Star specifically requires the star to gap from the first candle
The Bullish Abandoned Baby is one of the rarest and most reliable reversal patterns in candlestick analysis. It features a doji completely isolated by gaps on both sides, signaling an abrupt shift from bearish to bullish sentiment.
The Bullish Engulfing is one of the most popular and reliable two-candle reversal patterns. A large bullish candle completely engulfs the prior bearish candle body, signaling a decisive shift from selling to buying control.
The Morning Doji Star is a three-candle bullish reversal pattern where a bearish candle, a gapped-down doji, and a strong bullish candle combine to signal a decisive bottom — more powerful than the standard Morning Star due to the doji's complete indecision signal.
The Bullish Three Inside Up is a three-candle reversal pattern that combines a bullish harami with a confirming third candle that closes above the first candle's open, providing a more reliable reversal signal than the harami alone.
The Bearish Abandoned Baby is one of the rarest and most reliable top reversal patterns in candlestick analysis. It features a doji that is completely isolated by gaps on both sides, signaling an abrupt and dramatic shift from buying to selling pressure.
The Bearish Advance Block shows three consecutive bullish candles with progressively smaller bodies and longer upper shadows, signaling that buying momentum is weakening and a reversal or consolidation is likely.
Pro Tips & Common Mistakes
Pro Tips
- The gap between the first candle and the star is important — it shows the final bearish thrust
- The deeper the third candle closes into the first candle's body, the stronger the signal
- In forex where overnight gaps are rare, a small gap or even a small body without a gap can function as the star
- Volume pattern (high-low-high) is one of the best confirmation tools for this pattern
- The star's color doesn't matter — what matters is the small body showing indecision
Common Mistakes
- Not requiring the third candle to close above the first candle's midpoint
- Ignoring the gap requirement in markets where gaps naturally occur (stocks)
- Entering on the star candle before the third candle confirms
- Confusing any three-candle formation with a Morning Star
- Placing stops above the star instead of below it
Advanced Techniques
- The star candle often marks the exact level of institutional accumulation — track it as a support zone
- Combine with weekly chart support for the highest-probability setups
- Use the pattern as a filter for longer-term position entries
- Apply the Morning Star concept on weekly charts for major trend reversal identification
Institutional Perspective
The Morning Star is one of the patterns most commonly tracked by institutional technical analysts. Its three-candle structure provides a clear framework: the star marks the accumulation point, and the third candle confirms that institutional buying has shifted the balance of power.
Fun Facts
- The Morning Star is named after Venus, which ancient cultures saw as the herald of dawn.
- It is one of the first Japanese candlestick patterns most traders learn.
- The Morning Star has appeared at many of the most famous stock market bottoms in history.
Frequently Asked Questions
A three-candle bullish reversal: a large bearish candle, a small-bodied star that gaps down, and a large bullish candle closing into the first candle's body.
With about 62% win rate, it's one of the more reliable three-candle patterns, especially when combined with support and volume confirmation.
Yes, but gaps are less common in 24-hour forex markets. In forex, the star candle may not gap but should still have a notably small body to show indecision.