Overview
Bearish Abandoned Baby
Sutego Aka-chan
Also known as: Bearish Island Baby, Abandoned Baby Top
The Bearish Abandoned Baby is one of the rarest and most reliable top reversal patterns in candlestick analysis. It features a doji that is completely isolated by gaps on both sides, signaling an abrupt and dramatic shift from buying to selling pressure.
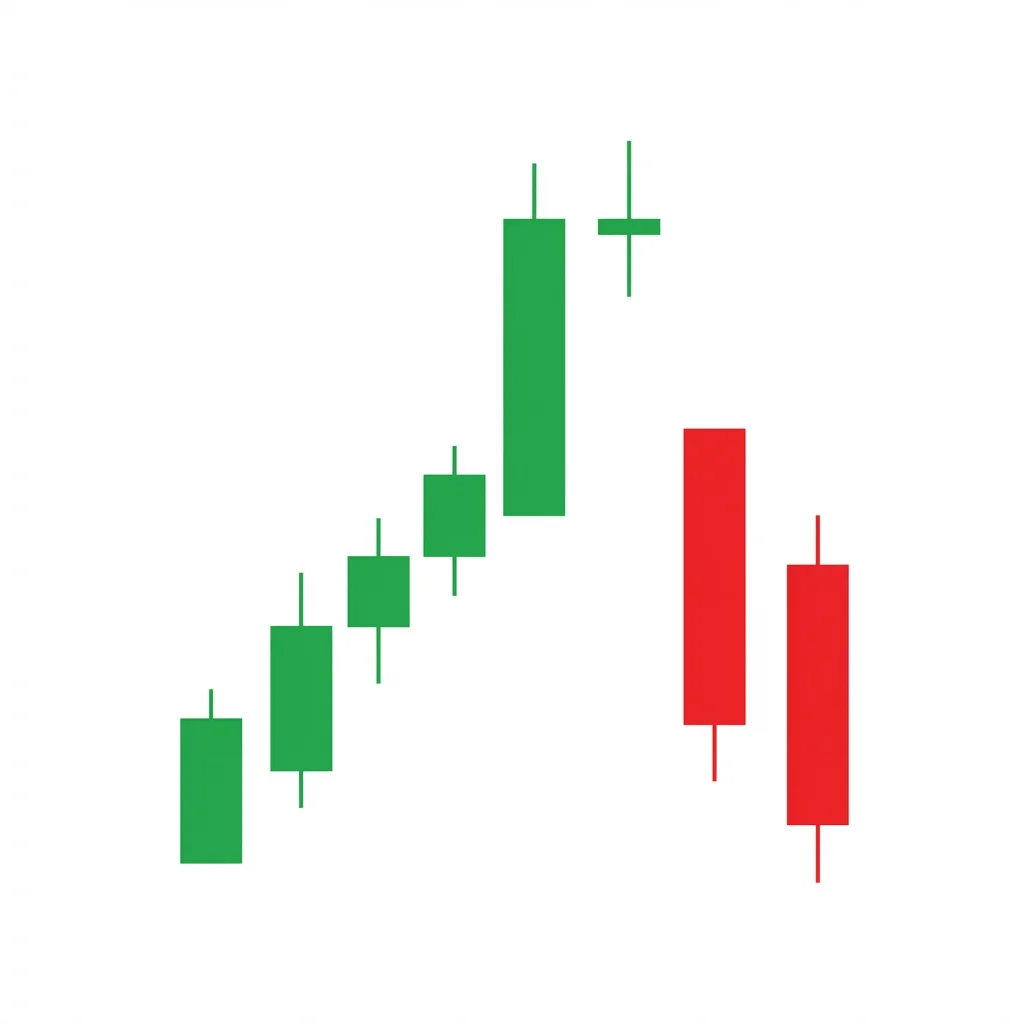
The Bearish Abandoned Baby is a three-candle reversal pattern that appears at the top of an uptrend. The first candle is a strong bullish candle, confirming the existing uptrend. The second candle is a doji that gaps above the first candle — critically, even the shadows of the doji do not overlap with the first candle. The third candle is a strong bearish candle that gaps down below the doji, again with no shadow overlap. This complete isolation of the doji creates an 'island' and represents a dramatic shift in market psychology. The pattern is extremely rare on daily and weekly charts, making it one of the most powerful signals when it does occur. Its rarity comes from the strict requirement that both gaps must be clean with no shadow overlap, which is a higher standard than the related Evening Star pattern.
History & Etymology
The Abandoned Baby pattern has its origins in Japanese rice trading, where it was recognized as a powerful reversal signal. The name metaphorically compares the isolated doji to a baby left alone — abandoned by both the bulls (who gapped up to it) and then by the bears (who gapped down from it). Steve Nison popularized the pattern in Western technical analysis through his foundational works on Japanese candlestick charting in the early 1990s.
The term 'abandoned baby' refers to the doji candle that sits alone, isolated by gaps on both sides. Like a child left at a doorstep, the doji is 'abandoned' by the price action — the bulls pushed price up to it but left, and then price gapped down away from it. The Japanese name 'Sutego Aka-chan' literally translates to 'abandoned baby.'
How It Forms
Formation Steps
- 1First candle: strong bullish candle continuing the uptrend
- 2Second candle: doji that gaps above the first candle's high — shadows do not overlap
- 3Third candle: strong bearish candle that gaps down below the doji's low — shadows do not overlap
Prerequisites
- Established uptrend of at least 5-10 bars
- Clear bullish momentum preceding the pattern
- The doji must be completely isolated by gaps on both sides
Confirmation Signals
- Third candle closes below the midpoint of the first candle
- Volume spike on the third candle
- Follow-through selling on the next bar
- RSI divergence at the top
Invalidation Signals
- Price closes above the doji high
- Gaps are filled immediately on the next bar
- Volume on the third candle is below average
Candle Breakdown
Bullish Continuation Candle
A strong bullish candle that continues the uptrend, showing buyers still in full control. The larger the body, the more powerful the eventual reversal signal.
Bulls are confident and aggressive. This candle lures in the last wave of buyers who fear missing out on further gains.
Isolated Doji
A doji that gaps above the first candle. Neither its upper nor lower shadow touches the first candle. This represents complete indecision after the gap up.
The market gaps up on excitement but immediately stalls. Buyers and sellers reach equilibrium at elevated prices. Low volume shows conviction is evaporating. Smart money begins distributing positions.
Bearish Reversal Candle
A strong bearish candle that gaps down below the doji, with no shadow overlap. It should close well into the body of the first candle.
Sellers aggressively take control. The gap down traps buyers who entered on the doji or first candle. Panic selling begins as trapped longs exit and new shorts enter.
Psychology
The Abandoned Baby captures a dramatic psychological shift from euphoria to panic. The isolated doji represents the exact moment where bullish conviction evaporates, and the gapping bearish candle confirms that sellers have seized complete control.
Buyer Perspective
Buyers are fully committed during the first candle and the gap up into the doji. However, the inability to push prices higher after the gap creates doubt. When the third candle gaps down, buyers who entered near the top are immediately trapped with losses and scramble to exit.
Seller Perspective
Sellers initially watch from the sidelines as the uptrend continues. The doji signals opportunity, and aggressive sellers begin establishing short positions. The gap down on the third candle confirms their thesis and draws in additional selling pressure.
Smart Money Action
Institutional players use the strength of the first candle and the gap up to distribute large positions into retail demand. The doji is often the final distribution phase. By the time the third candle gaps down, smart money is already short or flat.
Retail Trader Trap
Retail traders see the strong first candle and gap up as confirmation of trend strength. Many enter long on the doji or set buy stops above it. The gap down on the third candle immediately stops out these late longs, providing liquidity for institutional shorts.
Emotional Cycle
Trading Strategy
Aggressive Entry
Enter short at the close of the third candle once you confirm the gap below the doji holds.
Conservative Entry
Wait for a fourth candle to close below the third candle's low, confirming follow-through selling.
First support level or 1:1 risk-reward ratio.
Start of the prior uptrend move (measured from the swing low that began the rally).
2:1 to 3:1 risk-reward, often near the 61.8% Fibonacci retracement of the entire uptrend.
Best Conditions
- Timeframe: daily
- Timeframe: weekly
- Timeframe: 4h
- after extended uptrend
- near major resistance
- overbought conditions
- Asset: stocks
- Asset: indices
- Asset: crypto
Avoid When
- Timeframe: 1m
- Timeframe: 5m
- strong bull market with high momentum
- low volatility choppy market
Confluence Factors
- Pattern forms at major resistance level
- RSI or MACD bearish divergence
- Overbought RSI above 70
- Pattern appears at Fibonacci extension level
- Declining volume throughout the uptrend
- Bearish engulfing on higher timeframe
Scale In Strategy
Enter 50% at third candle close, add remaining 50% on break of third candle's low.
Scale Out Strategy
Take 33% off at first target, 33% at second target, let remaining 34% run with trailing stop.
Risk Management
Volume Analysis
Volume Confirmation
Volume should be above average on the third candle. Ideally, volume on the doji is the lowest of the three candles.
Volume Profile
Look for a volume climax on the first candle (distribution), low volume on the doji (exhaustion), and high volume on the third candle (new selling pressure).
Volume Divergence
If volume was declining throughout the uptrend while price was rising, the Abandoned Baby becomes significantly more reliable.
Technical Confluence
Support Resistance
Most powerful when the doji forms at a well-established resistance level. The gap down from resistance creates a potential island reversal.
Fibonacci Levels
Look for the pattern at 127.2% or 161.8% Fibonacci extension levels. Target the 38.2% and 61.8% retracement of the prior uptrend.
Moving Averages
The pattern is strongest when price is extended far above the 20 and 50-period moving averages. Target the 50 MA as the first objective.
Rsi Confirmation
Bearish RSI divergence (price making higher highs while RSI makes lower highs) significantly strengthens the pattern. RSI above 70 adds confluence.
Macd Confirmation
MACD histogram declining while price rises, or a bearish MACD crossover coinciding with the third candle, confirms the reversal.
Bollinger Bands
Pattern forming at or above the upper Bollinger Band, especially with a band squeeze preceding the move, increases reliability.
Vwap
On intraday charts, the pattern is strongest when the doji forms well above VWAP, indicating overextension.
Ichimoku Cloud
If the pattern forms above the Kumo cloud with a Tenkan-Kijun bearish cross, the reversal signal is very strong.
Elliott Wave
The Abandoned Baby often marks the end of Wave 5 or Wave C at an impulse top, signaling the start of a corrective wave.
Wyckoff Phase
Aligns with the Buying Climax (BC) and Automatic Reaction (AR) phases of Wyckoff distribution. The doji represents the Sign of Weakness (SOW).
Market Profile
Look for the pattern forming at the upper extreme of the value area or at a poor high in the market profile.
Order Flow
Watch for aggressive selling (market sell orders) on the third candle and absorption of buy limit orders below the doji.
Open Interest
In futures markets, rising open interest on the third candle confirms new short positions are being established.
Multi-Timeframe Analysis
Higher Timeframe Alignment
An Abandoned Baby on the daily chart is strongest when the weekly chart shows overbought conditions or bearish divergence. Weekly Abandoned Babies are exceptionally rare and signal major trend reversals.
Lower Timeframe Entry
After the doji forms, drop to the 1-hour chart to look for early signs of selling pressure (bearish engulfing, break of structure) for an aggressive entry before the daily third candle completes.
Timeframe Confluence
When an Abandoned Baby appears on the daily chart while the 4-hour chart shows a Head and Shoulders or distribution pattern, the confluence significantly increases the probability of a sustained reversal.
Top-Down Approach
Start with the weekly chart to confirm the uptrend is extended. Identify the daily Abandoned Baby. Use the 4-hour or 1-hour chart to fine-tune entry and manage the trade.
Statistics
Historical Examples
Apple (AAPL) Abandoned Baby Top 2018
successAAPL formed a textbook Abandoned Baby at its all-time high near $233. The doji gapped up on low volume, then price gapped down sharply the next day on heavy volume. The stock fell over 35% in the following two months.
Lesson: The pattern formed right at a major psychological round number ($230+) and coincided with bearish RSI divergence, providing excellent confluence.
Bitcoin Abandoned Baby at $64,000 in 2021
successBitcoin printed an Abandoned Baby pattern near $64,000 following the Coinbase IPO hype. The subsequent selloff took BTC down to $30,000 over the next two months, a 53% decline.
Lesson: Major news events (like the Coinbase IPO) can create the euphoric conditions needed for this pattern. The 'buy the rumor, sell the news' dynamic contributed to the exhaustion gap.
Tesla Near-Miss Abandoned Baby 2020
partialTSLA formed what appeared to be an Abandoned Baby near $900, but the doji's lower shadow slightly overlapped with the first candle. The stock dropped sharply but recovered within a week.
Lesson: Strict adherence to the gap-with-no-overlap rule is essential. A near-miss pattern is really an Evening Doji Star and should be traded with less conviction.
Variations
Near Abandoned Baby
The gaps exist but the shadows slightly overlap. This is technically an Evening Doji Star but retains some of the Abandoned Baby's power.
Abandoned Baby with Long-Legged Doji
The middle candle is a long-legged doji with extended shadows but still does not overlap with adjacent candles.
Confusion Matrix
Patterns commonly confused with Bearish Abandoned Baby and how to distinguish them.
Bearish Evening Doji Star
8500% similarCheck if the doji's shadows overlap with the adjacent candles. If any shadow touches, it is an Evening Doji Star, not an Abandoned Baby.
Key Differences
- Evening Doji Star does not require gaps with no shadow overlap
- Abandoned Baby requires both gaps to be clean (no shadow crossing)
- Abandoned Baby is significantly rarer and more reliable
Bearish Evening Star
7000% similarThe Abandoned Baby specifically requires a doji and two clean gaps. The Evening Star is a looser formation with a small body and optional gaps.
Key Differences
- Evening Star uses a small-bodied candle, not necessarily a doji
- Evening Star does not require gaps at all
- Evening Star is far more common
Bearish Island Reversal
6000% similarIf the island consists of only a single doji, it is an Abandoned Baby. If there are multiple candles in the isolated price zone, it is an Island Reversal.
Key Differences
- Island Reversal can have multiple candles in the island, not just a single doji
- Island Reversal focuses on the gap pattern, not the candle type
- Abandoned Baby is a specific one-candle island
The Dark Cloud Cover is a two-candle bearish reversal pattern where a bearish candle opens above the prior bullish candle's high and closes below its midpoint, signaling that the bullish 'sky' is being covered by a bearish 'dark cloud.'
The Bearish Doji Star is a two-candle reversal pattern featuring a strong bullish candle followed by a doji that gaps above it, signaling that buying momentum has stalled and indecision has replaced conviction at the top of an uptrend.
The Bearish Engulfing is one of the most powerful and commonly traded two-candle reversal patterns. A large bearish candle completely engulfs the prior bullish candle, demonstrating a decisive shift from buying to selling dominance.
The Evening Doji Star is a top-tier three-candle bearish reversal pattern. The doji in the star position represents the pivot point between bullish confidence (first candle) and bearish dominance (third candle), making it one of the most reliable reversal signals in candlestick analysis.
The bearish island reversal is a powerful reversal pattern where price gaps up, trades briefly in an isolated range (the island), then gaps down, leaving the island completely separated by gaps on both sides. It signals a decisive sentiment shift.
The Bullish Abandoned Baby is one of the rarest and most reliable reversal patterns in candlestick analysis. It features a doji completely isolated by gaps on both sides, signaling an abrupt shift from bearish to bullish sentiment.
Pro Tips & Common Mistakes
Pro Tips
- The Abandoned Baby is extremely rare on daily charts — when you see one, pay close attention because it is among the highest-probability reversal signals in all of candlestick analysis.
- Use a screen-level zoom to verify the doji shadows truly do not overlap with the adjacent candles. Many 'Abandoned Babies' are actually Evening Doji Stars.
- The larger the gaps on either side of the doji, the more powerful the signal. Wide gaps indicate stronger emotional shifts.
- If the doji has very small or nonexistent shadows (a four-price doji), the pattern is even more significant.
- Combine with volume analysis: the ideal volume signature is high, low, high across the three candles.
Common Mistakes
- Confusing the Abandoned Baby with the Evening Doji Star — the gap requirement is strict and both gaps must be clean.
- Entering before the third candle completes — the pattern is not confirmed until the third candle closes with the gap intact.
- Placing stops too tight below the doji instead of above it — the doji high is the invalidation point.
- Ignoring the volume profile — a true Abandoned Baby needs the characteristic high-low-high volume pattern.
- Trading the pattern in a strong bull market without additional confirmation — even high-reliability patterns can fail in powerful trends.
Advanced Techniques
- Use options straddles on the doji candle if you anticipate an Abandoned Baby forming — the gap down will produce explosive put gains.
- Monitor the bid-ask spread and Level 2 order book during the doji formation. A widening spread and thinning book signals the potential for a gap down.
- On weekly charts, an Abandoned Baby can signal multi-month trend reversals — adjust your position sizing and timeframe accordingly.
- Combine with VWAP anchored to the swing low of the prior uptrend to identify optimal profit targets.
Institutional Perspective
Institutions view the Abandoned Baby as a distribution completion signal. The gap up to the doji is often the final phase of offloading large positions into retail demand. The gap down represents the point where institutional selling has overwhelmed available buyers.
Fun Facts
- The Bearish Abandoned Baby is so rare that some professional traders report seeing fewer than five textbook examples in their entire career on daily stock charts.
- In Japanese tradition, the isolated doji is compared to a child left at a temple doorstep — appearing suddenly and then left alone as the world moves on.
- The pattern is more common in cryptocurrency markets due to 24/7 trading and extreme volatility, though the gap requirements are harder to meet.
Frequently Asked Questions
The Bearish Abandoned Baby is one of the rarest candlestick patterns. On daily charts, it may appear only a few times per year across the entire stock market. The strict requirement for two clean gaps with no shadow overlap makes it significantly rarer than its cousin, the Evening Doji Star.
The key difference is the gap requirement. The Abandoned Baby requires that the doji's shadows do not overlap with either the first or third candle — complete isolation via gaps. The Evening Doji Star is a more relaxed version where the doji can have shadow overlap with adjacent candles.
The standard stop loss is placed above the high of the doji (second candle), as that represents the highest point of the pattern. For a wider stop, add an ATR buffer above the doji high. For a tighter stop, use the high of the third candle.
No. By definition, the Bearish Abandoned Baby is a top reversal pattern that requires an established uptrend. A similar pattern in a downtrend would be a Bullish Abandoned Baby, which signals a bottom reversal.
Look for: (1) the doji is completely isolated by gaps on both sides with no shadow overlap, (2) the third candle closes well into the body of the first candle, (3) volume increases on the third candle, and (4) follow-through selling occurs on the next bar.