Overview
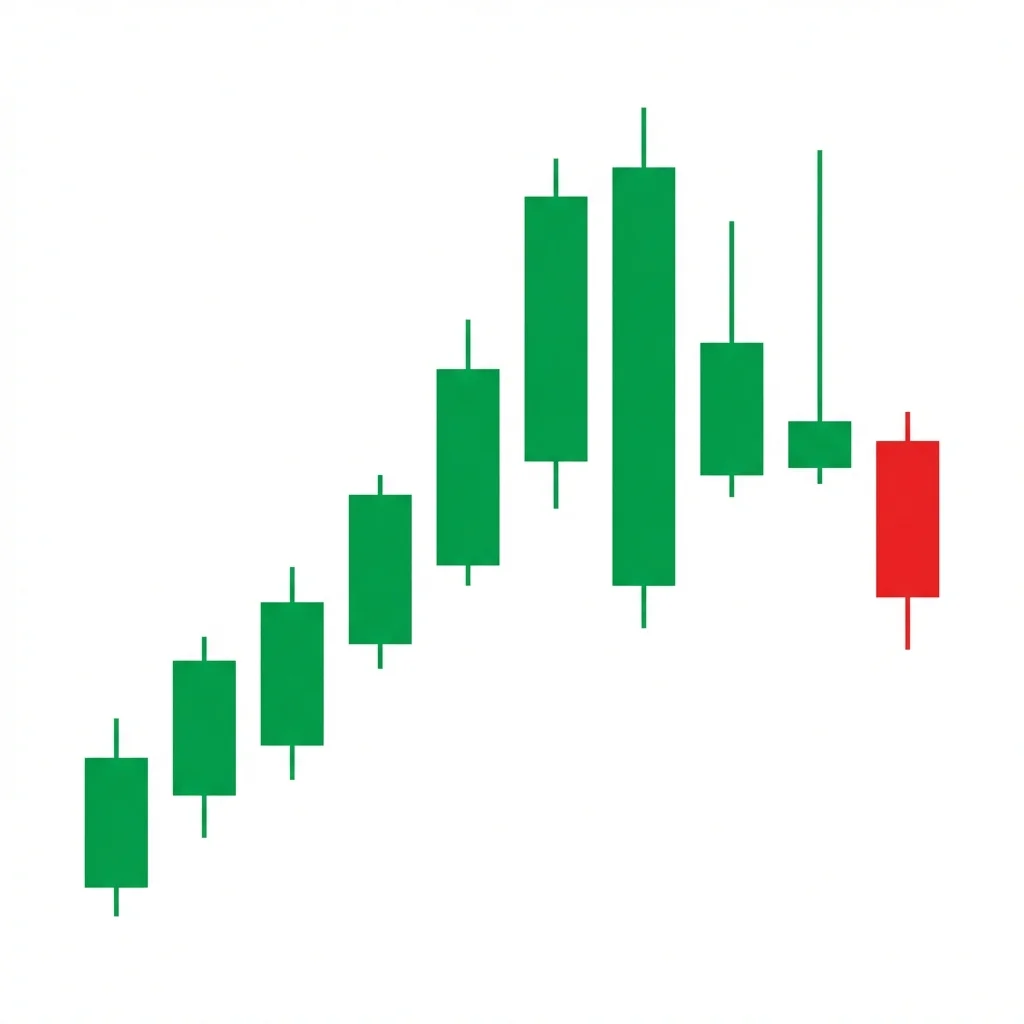
Bearish Advance Block
Saki Zumari
Also known as: Advance Block, Stalled Advance, Weakening Three White Soldiers
The Bearish Advance Block shows three consecutive bullish candles with progressively smaller bodies and longer upper shadows, signaling that buying momentum is weakening and a reversal or consolidation is likely.
The Advance Block is a subtle warning pattern that occurs during an uptrend. While all three candles close higher, the diminishing body sizes and lengthening upper shadows tell a story of fading bullish conviction. Each candle opens within the prior candle's body and attempts to push higher, but increasing selling pressure at elevated levels causes longer wicks and less real ground gained. Unlike the strong Three White Soldiers pattern (which it visually resembles), the Advance Block shows deterioration in buying power. It is more of a caution signal than an outright sell signal — it suggests the uptrend is losing steam and traders should tighten stops or reduce position sizes.
History & Etymology
The Advance Block has been part of Japanese candlestick analysis for centuries. Japanese rice traders recognized that while three consecutive white (bullish) candles normally signal strength, the specific pattern of declining body sizes with growing shadows warned of impending weakness. Gregory Morris and Steve Nison detailed the pattern's significance in their respective works on candlestick analysis.
The term 'advance block' refers to the fact that while price is advancing (moving higher), it is being blocked — the advance is meeting resistance. Each candle's attempt to push higher is increasingly blocked by sellers, creating the characteristic pattern of smaller bodies and longer upper wicks.
How It Forms
Formation Steps
- 1First candle: strong bullish candle with a large body and minimal upper shadow
- 2Second candle: bullish candle opening within the first candle's body, with a smaller body and a longer upper shadow
- 3Third candle: small bullish candle (or near-doji) opening within the second candle's body, with the longest upper shadow and smallest body
Prerequisites
- Established uptrend preceding the pattern
- Each candle must close higher than the previous close
- Bodies must become progressively smaller
- Upper shadows must become progressively longer
Confirmation Signals
- A bearish candle following the pattern
- Break below the third candle's low
- Increasing selling volume on the following candle
- Bearish divergence on RSI or MACD
Invalidation Signals
- Strong bullish candle breaking above the third candle's high on heavy volume
- All three candles have roughly equal bodies with no shadow progression
- Volume increases on each subsequent candle
Candle Breakdown
Strong Bullish Candle
A robust bullish candle with a large body and small or no upper shadow, demonstrating strong buying momentum.
Buyers are firmly in control, establishing the base of the pattern. This candle looks like a continuation of the uptrend.
Weakening Bullish Candle
A bullish candle with a noticeably smaller body than the first and a longer upper shadow. Opens within the first candle's body.
Buyers push price higher but encounter selling resistance. The longer upper shadow shows sellers are starting to assert themselves at higher prices.
Exhaustion Candle
A small bullish candle or near-doji with the longest upper shadow of the three. The body may be very small, nearly a spinning top.
The final push higher is met with strong selling. The long upper shadow shows price was rejected at elevated levels. Buying momentum is nearly spent.
Psychology
The Advance Block reveals a gradual shift in the power balance between buyers and sellers. Each candle shows buyers losing more ground to sellers, even though price still closes higher. It captures the slow death of a rally.
Buyer Perspective
Buyers maintain control but with decreasing conviction. Each day they push prices higher but face more resistance. The growing upper shadows reflect their inability to hold gains near the highs, which breeds uncertainty.
Seller Perspective
Sellers are gradually gaining confidence. Each day they push price back from the highs more aggressively. The progression tells them that buyers are weakening, encouraging them to increase their selling pressure.
Smart Money Action
Institutional investors use the Advance Block to begin scaling out of long positions. Each day's rally attempt allows them to sell into strength, with the diminishing closes showing that their selling is starting to overwhelm retail buying.
Retail Trader Trap
Retail traders see three green candles and assume the uptrend is continuing. They fail to notice the deteriorating quality of each candle and may enter long just as the pattern completes, right before a pullback.
Emotional Cycle
Trading Strategy
Aggressive Entry
Short on the close of the third candle, especially if it has a very long upper shadow and tiny body.
Conservative Entry
Wait for a bearish candle that closes below the low of the third candle before entering short.
Support level formed by the base of the pattern (first candle's open).
Previous swing low or the 50% retracement of the entire uptrend move.
61.8% Fibonacci retracement of the trend that preceded the pattern.
Best Conditions
- Timeframe: daily
- Timeframe: weekly
- Timeframe: 4h
- mature uptrend near resistance
- overbought conditions
- late-stage bull trend
- Asset: stocks
- Asset: indices
- Asset: ETFs
Avoid When
- Timeframe: 1m
- Timeframe: 5m
- Timeframe: 15m
- early-stage breakout
- strong momentum with increasing volume
Confluence Factors
- Pattern forms at a known resistance level
- RSI is above 70 and starting to curl down
- Volume declining throughout the three candles
- Pattern appears after extended uptrend of 20+ bars
- Bearish divergence on multiple indicators
Scale In Strategy
Enter 30% on the third candle close, add 70% on bearish confirmation candle.
Scale Out Strategy
Take 50% at the first support level, trail the rest with a 10 EMA.
Risk Management
Volume Analysis
Volume Confirmation
Declining volume across the three candles strengthens the pattern. If volume is increasing, the pattern may not be an Advance Block but rather continuation.
Volume Profile
Ideal volume pattern: high on candle one, average on candle two, below average on candle three.
Volume Divergence
Volume declining while price makes new highs is classic bearish volume divergence and confirms the Advance Block reading.
Technical Confluence
Support Resistance
The pattern is most meaningful at major resistance zones where the growing upper shadows represent repeated rejection from the resistance level.
Fibonacci Levels
Look for the pattern forming at 100%, 127.2%, or 161.8% Fibonacci extension levels of the prior swing.
Moving Averages
When price is extended far above the 20 EMA and the Advance Block appears, a mean reversion to the 20 EMA is the most probable outcome.
Rsi Confirmation
RSI above 70 with a declining trendline while the Advance Block forms provides strong confirmation of weakening momentum.
Macd Confirmation
MACD histogram declining (making lower bars) while the Advance Block forms is a classic bearish divergence setup.
Bollinger Bands
The pattern often forms with the upper shadows poking above the upper Bollinger Band, showing overextension.
Vwap
On intraday charts, the Advance Block forming above VWAP with upper shadows reaching further above suggests distribution.
Ichimoku Cloud
If the pattern forms far above the Kumo cloud, a reversion to the Tenkan-sen or Kijun-sen is the natural target.
Elliott Wave
The Advance Block often appears during the terminal thrust of Wave 5 or the end of Wave C in an upward correction.
Wyckoff Phase
The pattern aligns with the Preliminary Supply (PSY) and Buying Climax (BC) phases of Wyckoff distribution.
Market Profile
Upper shadows extending into low-volume nodes in the market profile suggest price is being rejected from poor structure.
Order Flow
Watch for increasing market sell orders and declining passive buying on each successive candle.
Open Interest
Flat or declining open interest during the Advance Block suggests the rally is being driven by short covering rather than new buying.
Multi-Timeframe Analysis
Higher Timeframe Alignment
An Advance Block on the daily chart is most powerful when the weekly chart shows overbought conditions or is approaching major resistance.
Lower Timeframe Entry
After identifying the Advance Block on the daily chart, use the 1-hour chart to find bearish setups (e.g., break of an intraday uptrend line) for precise entry timing.
Timeframe Confluence
Daily Advance Block plus a 4-hour bearish divergence provides strong confluence for a reversal trade.
Top-Down Approach
Weekly: identify overbought conditions. Daily: spot the Advance Block. 4H: find the entry trigger and manage the trade.
Statistics
Historical Examples
Microsoft (MSFT) Advance Block in 2021
successMSFT formed a clear Advance Block near $340 with three green candles showing progressively smaller bodies and longer upper shadows. Volume declined across the three days. The stock pulled back 8% over the following two weeks.
Lesson: The pattern coincided with RSI above 75 and declining volume, providing confluence. Using the Advance Block as a signal to tighten stops was the right call.
S&P 500 ETF (SPY) False Advance Block
failureSPY showed an Advance Block pattern near $430 during the AI-driven rally. Despite the deteriorating candle quality, the strong bullish momentum powered through and SPY continued to rally.
Lesson: In very strong momentum-driven markets, the Advance Block can be overwhelmed. Always consider the broader market context and avoid counter-trend trades in parabolic moves.
Variations
Advance Block with Spinning Top
The third candle is a spinning top with both upper and lower shadows, showing complete indecision.
Advance Block with Gaps
Each candle gaps up from the previous close before forming its bearish characteristics.
Confusion Matrix
Patterns commonly confused with Bearish Advance Block and how to distinguish them.
Bullish Three White Soldiers
7500% similarCompare body sizes and upper shadows across the three candles. If bodies are shrinking and upper shadows growing, it is an Advance Block.
Key Differences
- Three White Soldiers have roughly equal large bodies with minimal upper shadows
- Advance Block has progressively smaller bodies with growing upper shadows
- Three White Soldiers is bullish continuation; Advance Block is bearish warning
Bearish Deliberation
8000% similarIn the Advance Block, the second candle already shows weakness (smaller body, longer shadow). In Deliberation, the second candle is still strong.
Key Differences
- Deliberation has the first two candles as strong and only the third candle is weak
- Advance Block shows progressive deterioration across all three candles
- Deliberation may have a gap up to the small third candle
The Deliberation pattern shows two strong bullish candles followed by a small-bodied third candle, indicating that the uptrend is 'deliberating' — the bulls have stalled and are uncertain about pushing higher.
The Bearish Engulfing is one of the most powerful and commonly traded two-candle reversal patterns. A large bearish candle completely engulfs the prior bullish candle, demonstrating a decisive shift from buying to selling dominance.
The shooting star is a single-candle bearish reversal pattern with a small body near the low and a long upper shadow. It shows that buyers pushed price significantly higher during the session but sellers drove it back down, signaling a potential top.
Three black crows is a powerful bearish reversal pattern consisting of three consecutive long bearish candles, each opening within the prior candle's body and closing near its low. It signals strong, persistent selling pressure and a likely trend reversal.
Three White Soldiers is one of the strongest bullish reversal patterns: three consecutive long bullish candles with progressively higher closes, each opening within the prior candle's body, signaling a powerful shift from bearish to bullish sentiment.
The Bearish Abandoned Baby is one of the rarest and most reliable top reversal patterns in candlestick analysis. It features a doji that is completely isolated by gaps on both sides, signaling an abrupt and dramatic shift from buying to selling pressure.
Pro Tips & Common Mistakes
Pro Tips
- The Advance Block is more of a warning sign than an outright sell signal. Use it to tighten stops on existing long positions rather than aggressively shorting.
- Compare the body-to-shadow ratio across the three candles. The more dramatic the deterioration, the stronger the signal.
- The pattern is most reliable when it forms after an extended uptrend of 15+ candles, as this indicates the rally is mature.
- Combine with volume analysis — declining volume across the three candles significantly increases the pattern's predictive power.
Common Mistakes
- Confusing the Advance Block with healthy Three White Soldiers — always check for the progressive deterioration in body size and shadow length.
- Aggressively shorting based on the Advance Block alone without waiting for bearish confirmation.
- Ignoring the pattern because 'all three candles are green' — the subtlety of the pattern is its key characteristic.
- Not adjusting position size for the lower reliability of this pattern compared to more definitive reversal signals.
Advanced Techniques
- Use the Advance Block to manage existing long positions by converting to a covered call strategy, selling calls at the level of the third candle's upper shadow.
- Plot the rate of change of the candle bodies to quantify the deterioration — a declining slope confirms the Advance Block reading.
- Combine with market breadth indicators. If the Advance Block appears on a broad index while breadth narrows, the signal is strengthened.
- Use the Advance Block on a higher timeframe as a filter to avoid taking long entries on lower timeframes.
Institutional Perspective
Institutions recognize the Advance Block as a sign of dwindling demand. The progressively smaller closes indicate that their sell orders are having more impact, and they may accelerate distribution on the following sessions.
Fun Facts
- The Advance Block is one of the most commonly misidentified patterns because traders tend to see three green candles and assume bullish continuation.
- In Japanese, 'Saki Zumari' roughly translates to 'blocked advance,' which perfectly describes the pattern's meaning.
- The pattern appears more frequently in mature bull markets, making it a useful tool for identifying the late stages of a rally.
Frequently Asked Questions
Three White Soldiers show three strong bullish candles with roughly equal large bodies and minimal upper shadows — a strong continuation signal. The Advance Block has progressively smaller bodies and longer upper shadows, indicating the rally is losing momentum. The visual difference is in the deterioration across the candles.
No. The Advance Block is a warning sign, not an outright sell signal. Use it to tighten stops on long positions and watch for bearish confirmation. Only enter a short position after a bearish candle confirms the reversal.
Declining volume across the three candles, RSI divergence, the pattern forming at a known resistance level, and an extended prior uptrend all increase the pattern's reliability.
No. The Advance Block by definition occurs during an uptrend. The three consecutive bullish candles require an existing uptrend context. A similar concept during a downtrend would be a declining three methods or stalling continuation pattern.