Overview
Bullish Three Line Strike
Sanpei Uchikomi (三兵打込み)
Also known as: Three Line Strike Bullish, Bullish Striking Pattern
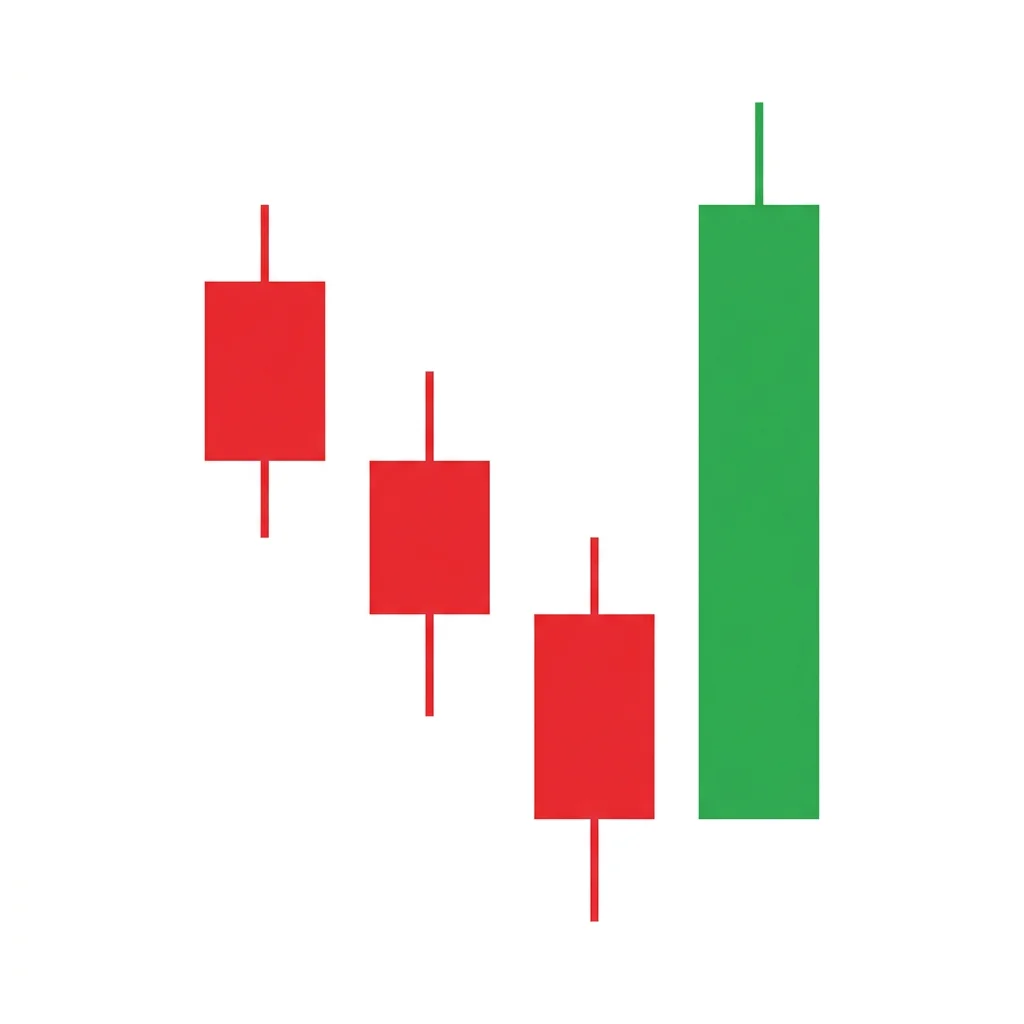
The Bullish Three Line Strike is a four-candle continuation pattern where three bullish candles are followed by a large bearish candle that engulfs all three. Despite the dramatic sell-off, the pattern is a continuation signal — the fourth candle is a shakeout that traps sellers before the uptrend resumes.
This counterintuitive pattern fools many traders. Three consecutive bullish candles build confidence, then the fourth candle dramatically reverses, opening high and closing below the first candle's open, seemingly erasing all gains. However, this bearish candle acts as a shakeout — it triggers bull stops and lures bears into short positions. When price resumes its uptrend, trapped bears are squeezed and the trend continues with renewed momentum. Statistical studies show this is one of the most reliable bullish continuation patterns when properly confirmed.
History & Etymology
The Three Line Strike is documented in Japanese candlestick analysis as a continuation pattern, though its counterintuitive nature (a large bearish candle being a bullish signal) initially confused Western traders. Thomas Bulkowski's extensive statistical analysis later confirmed its high reliability as a continuation pattern.
Named for the three bullish lines (candles) that are 'struck' by the fourth bearish candle. The strike candle appears to destroy the bullish progress but actually sets up its continuation.
How It Forms
Formation Steps
- 1First three candles: three consecutive bullish candles, each closing higher (similar to Three White Soldiers)
- 2Fourth candle: a large bearish candle that opens above the third candle's close and closes below the first candle's open, engulfing all three bullish candles
Prerequisites
- Established uptrend
- Three consecutive bullish candles with higher closes
- Fourth candle engulfs the entire range of the three bullish candles
Confirmation Signals
- Fifth candle opens above the fourth candle's close and shows bullish action
- Volume spikes on the fourth candle (shakeout) and remains on the fifth (continuation)
- Price reclaims the third candle's close within 1-2 bars
Invalidation Signals
- Price continues lower after the fourth candle with sustained selling
- Volume remains heavy on the downside after the engulfing candle
- No recovery above the third candle's close within 3 bars
Candle Breakdown
First Bullish Candle
First of three consecutive bullish candles in the uptrend
Normal uptrend continuation. Bulls are in control.
Second Bullish Candle
Second bullish candle closing above the first
Continued buying confidence. The uptrend appears healthy and orderly.
Third Bullish Candle
Third bullish candle closing at the highest point of the sequence
Three consecutive bullish candles create complacency among bulls and desperation among bears.
Strike Candle
A large bearish candle that opens above the third candle's close and closes below the first candle's open, engulfing all three bullish candles
Panic and confusion. Bulls see three days of gains erased in one session. Bears believe the trend has reversed. In reality, this is a shakeout designed to flush weak hands before the trend resumes.
Psychology
The Three Line Strike exploits traders' recency bias. The dramatic fourth candle creates the illusion of a trend reversal, trapping shorts and shaking out weak bulls. When the trend resumes, the trapped participants fuel the next leg higher.
Buyer Perspective
Strong-handed bulls recognize the fourth candle as a shakeout and maintain or add to positions. Weak bulls panic and sell, providing liquidity to smart money buyers.
Seller Perspective
Bears are emboldened by the fourth candle's dramatic reversal of three days of gains. They initiate or add to short positions — only to be trapped when the uptrend resumes.
Smart Money Action
Institutions may use the fourth candle to add to long positions at discounted prices. The shakeout provides them with the liquidity (from stop-loss selling) to fill their buy orders.
Retail Trader Trap
Retail traders sell in panic on the fourth candle or initiate shorts. When the trend resumes, they are trapped and forced to buy back at higher prices.
Emotional Cycle
Trading Strategy
Aggressive Entry
Enter long at the close of the fourth (strike) candle, treating it as a shakeout buying opportunity.
Conservative Entry
Wait for the fifth candle to close above the third candle's close before entering.
The third candle's high (reclaiming the shakeout).
A measured move equal to the range of the three bullish candles projected above the recovery.
2x the three-candle range or the next major resistance.
Best Conditions
- Timeframe: daily
- Timeframe: 4h
- Timeframe: weekly
- strong uptrend
- bull market with periodic shakeouts
- trending market
- Asset: stocks
- Asset: crypto
- Asset: forex
Avoid When
- Timeframe: 1m
- Timeframe: 5m
- genuine trend reversal
- bear market
- deteriorating fundamentals
Confluence Factors
- Strong prior uptrend with institutional backing
- The fourth candle's low touches a key support level (MA, Fibonacci, demand zone)
- Volume spike on the fourth candle confirms a shakeout event
- RSI drops from overbought but stays above 40
- The broader market trend supports continuation
Scale In Strategy
Enter half on the fourth candle close and add on the recovery above the third candle's close.
Scale Out Strategy
Take one-third on the recovery and trail the rest with the trend.
Risk Management
Volume Analysis
Volume Confirmation
High volume on the fourth candle (shakeout) followed by strong volume on the recovery confirms the pattern.
Volume Profile
Volume spike on the strike candle is expected. If volume is low on the strike, the shakeout may not be genuine.
Volume Divergence
If volume continues heavy on the downside after the fourth candle, the pattern may be failing.
Technical Confluence
Support Resistance
The fourth candle's low often touches a significant support level, adding confluence to the shakeout thesis.
Fibonacci Levels
The fourth candle often retraces to the 50% or 61.8% level of the prior uptrend leg.
Moving Averages
The fourth candle touching the 20 or 50 EMA before the recovery is a strong confirmation.
Rsi Confirmation
RSI dropping from overbought to neutral (50-60) on the fourth candle but not entering oversold supports the continuation thesis.
Macd Confirmation
MACD histogram contracting on the fourth candle and then expanding again on the recovery.
Bollinger Bands
The fourth candle returning to the middle band from the upper band before resuming is consistent.
Vwap
The fourth candle touching VWAP and then price recovering above VWAP confirms the shakeout.
Ichimoku Cloud
The fourth candle touching the Tenkan-sen or Kijun-sen and bouncing confirms support.
Elliott Wave
The three bullish candles may be part of Wave 3, with the strike candle representing a Wave 4 corrective move.
Wyckoff Phase
The pattern represents a minor shakeout within the markup phase.
Market Profile
The fourth candle returning to the prior value area before resuming confirms a reversion to fair value.
Order Flow
The fourth candle shows aggressive selling followed by aggressive buying — a classic stop-hunt reversal in order flow.
Open Interest
Open interest declining on the fourth candle (stop liquidation) and rising on the recovery confirms the pattern.
Multi-Timeframe Analysis
Higher Timeframe Alignment
A weekly uptrend with a daily Three Line Strike provides the strongest continuation signal.
Lower Timeframe Entry
Use the 1-hour chart to identify the reversal point within the daily strike candle for precise entry.
Timeframe Confluence
Weekly trend up, daily Three Line Strike, 4-hour recovery confirmation.
Top-Down Approach
Weekly confirms trend, daily identifies the shakeout, intraday times the recovery entry.
Statistics
Historical Examples
AAPL Three Line Strike Shakeout
successAAPL had three strong bullish candles followed by a strike candle that erased all gains. The stock recovered immediately and continued to rally.
Lesson: In quality stocks with strong fundamentals, the Three Line Strike is a buying opportunity, not a sell signal.
BTC Weekly Three Line Strike
partialBTC formed a weekly Three Line Strike during the May 2021 crash. While the pattern was eventually confirmed, the recovery took several weeks.
Lesson: On higher timeframes, the Three Line Strike recovery may take longer but the eventual move can be significant.
Failed Three Line Strike
failureNFLX formed what appeared to be a Three Line Strike, but the fundamental deterioration (subscriber loss) meant the strike candle was a genuine reversal, not a shakeout.
Lesson: Always check fundamentals. If the strike candle is driven by genuinely negative news, the pattern may not hold.
Variations
Shallow Strike
The fourth candle does not fully engulf all three bullish candles but still erases most of the gains.
Deep Strike with Long Shadow
The fourth candle has a long lower shadow after the engulfment, showing immediate buying at the low.
Confusion Matrix
Patterns commonly confused with Bullish Three Line Strike and how to distinguish them.
Bearish Engulfing
6000% similarCount the preceding bullish candles. If three consecutive bullish candles precede the engulfing, it is likely a Three Line Strike continuation, not a reversal.
Key Differences
- A bearish engulfing after three bullish candles is the Three Line Strike (continuation)
- A bearish engulfing after one bullish candle may be a genuine reversal
The bearish three line strike features three bearish candles followed by a large bullish candle that engulfs all three. Despite the dramatic bullish fourth candle, the pattern paradoxically signals bearish continuation—the bullish candle is a temporary short squeeze before the downtrend resumes.
A Bear Trap occurs when price breaks below a key support level, luring bears into short positions, only to reverse sharply higher. The trapped shorts are forced to cover, adding fuel to the bullish reversal.
The Bullish Engulfing is one of the most popular and reliable two-candle reversal patterns. A large bullish candle completely engulfs the prior bearish candle body, signaling a decisive shift from selling to buying control.
The Bullish Spring is a Wyckoff pattern where price briefly breaks below trading range support to trigger stop losses, then immediately reverses back above support, trapping shorts and initiating a markup phase.
Three White Soldiers is one of the strongest bullish reversal patterns: three consecutive long bullish candles with progressively higher closes, each opening within the prior candle's body, signaling a powerful shift from bearish to bullish sentiment.
The Bearish Breakaway is a five-candle reversal pattern where a gap-up rally stalls over three sessions before a powerful bearish candle breaks back down into the gap, signaling the uptrend is exhausted.
Pro Tips & Common Mistakes
Pro Tips
- This is one of the most counterintuitive patterns — the large bearish candle looks terrible but is actually a buying opportunity
- Thomas Bulkowski found the Three Line Strike to be one of the highest-performing candlestick patterns when confirmed
- The key confirmation is the fifth candle: it must close above the third candle's close to validate the continuation
- The strike candle's low often marks a significant support level for future reference
- If the strike candle occurs on news-driven selling, verify that the news is temporary, not fundamental
Common Mistakes
- Panicking and selling on the strike candle — this is exactly the wrong action
- Shorting the strike candle, expecting a continuation of the bearish move
- Not waiting for the fifth candle confirmation before committing fully
- Confusing a genuine trend reversal with a Three Line Strike shakeout
- Trading the pattern without considering the fundamental context
Advanced Techniques
- Use order flow data to distinguish between a genuine selling event and a stop-hunt shakeout on the strike candle
- Combine with options: sell puts at the strike candle's low to profit from the recovery while collecting premium
- Apply the pattern to multiple timeframes — a daily Three Line Strike within a weekly uptrend is highest probability
- Track the strike candle's delta: if it shows buying absorption (positive delta despite a bearish close), the shakeout thesis is confirmed
Institutional Perspective
The Three Line Strike is a favorite institutional setup because the shakeout candle provides the liquidity they need to add to positions. The stop-loss cascade on the strike candle gives them buy-side liquidity at favorable prices. They view the pattern as a natural consequence of stop placement below the first candle.
Fun Facts
- Thomas Bulkowski's statistical analysis ranks the Bullish Three Line Strike as one of the top-performing candlestick patterns, with a continuation rate above 65%.
- The pattern is one of the most counterintuitive in all of technical analysis — the scariest candle (the strike) is actually the best buying opportunity.
- Algorithmic trading systems that detect Three Line Strikes and buy the fifth candle have shown consistent profitability in backtests.
Frequently Asked Questions
A four-candle continuation pattern: three bullish candles followed by a large bearish candle that engulfs all three. Despite appearing bearish, the fourth candle is a shakeout, and the uptrend typically resumes.
The bearish candle triggers stop losses from bulls and lures bears into shorts. When the trend resumes, these trapped participants fuel the rally. It is a shakeout that provides liquidity for the continuation.
Wait for the fifth candle to close above the third candle's close. This confirms that the strike candle was a shakeout and the uptrend is resuming.