Overview
Bearish Breakaway
Hanare Sante No Shinte Zukae
Also known as: Breakaway Bearish, Five-Line Breakaway
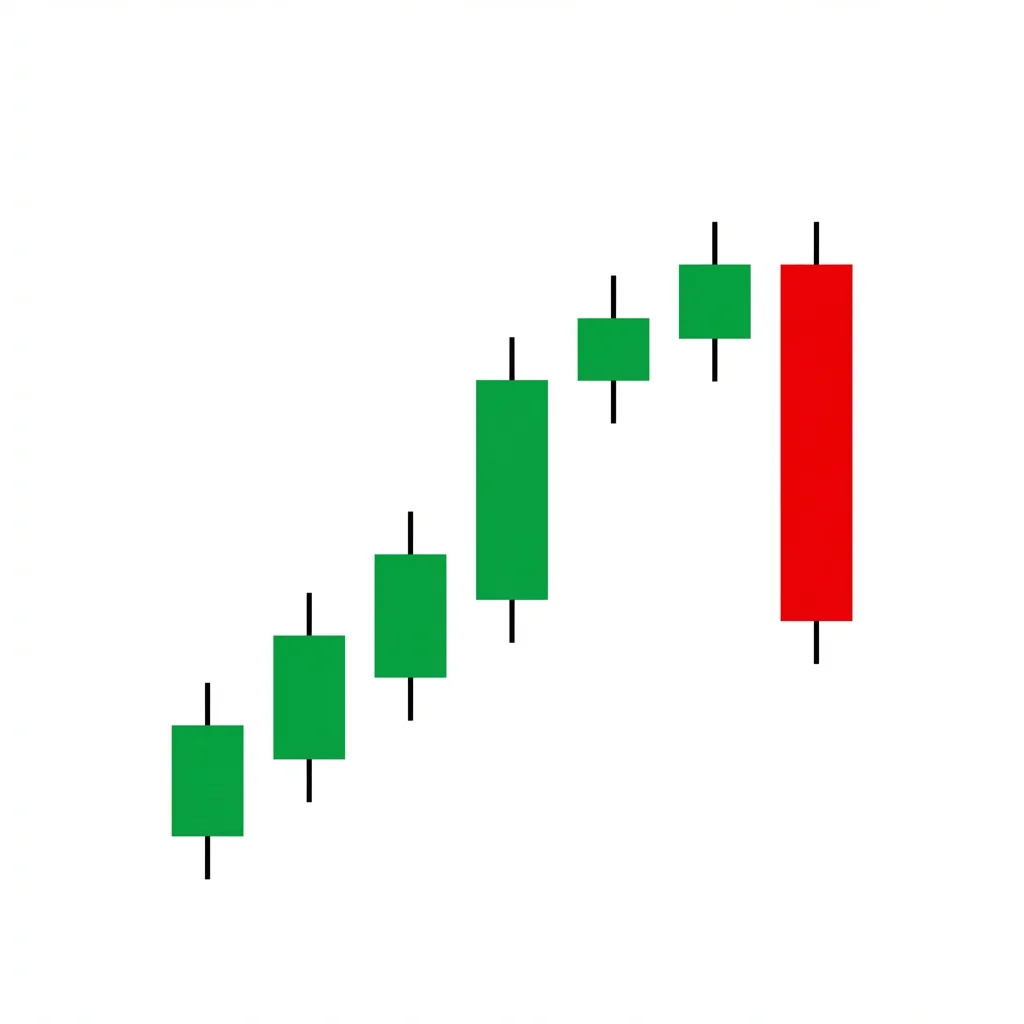
The Bearish Breakaway is a five-candle reversal pattern where a gap-up rally stalls over three sessions before a powerful bearish candle breaks back down into the gap, signaling the uptrend is exhausted.
The Bearish Breakaway is a rare five-candle reversal pattern. It begins with a strong bullish candle followed by a gap up. The next three candles drift slightly higher with diminishing enthusiasm — small bodies showing that the gap up has exhausted buying power. Finally, the fifth candle is a large bearish candle that slices back down through the small candles and closes within the gap area between the first and second candles. This pattern tells a story of over-enthusiasm (the gap up), gradual exhaustion (the three small candles), and decisive reversal (the fifth candle). The gap fill on the fifth candle is the critical element — it shows that the bullish breakaway attempt has completely failed.
History & Etymology
The Breakaway pattern is part of the classical Japanese candlestick pattern library. It belongs to a family of gap-based reversal patterns that Japanese rice traders used to identify when speculative rallies had overextended. The five-candle structure gives the pattern enough time to develop a clear narrative of momentum loss before the reversal.
The name 'breakaway' refers to the initial gap up that 'breaks away' from the prior price action. Ironically, the bearish version shows this breakaway failing — the fifth candle breaks back down, negating the gap and signaling that the attempted breakaway was a false move.
How It Forms
Formation Steps
- 1First candle: long bullish candle in an uptrend
- 2Second candle: bullish candle that gaps up above the first candle's close
- 3Third candle: small-bodied candle (bullish or bearish) that continues slightly higher or stays in range
- 4Fourth candle: small-bodied bullish candle continuing the drift higher
- 5Fifth candle: long bearish candle that closes within the gap between the first and second candles
Prerequisites
- Established uptrend
- A gap up between the first and second candles
- The middle candles (2-4) should show weakening momentum with small bodies
- The fifth candle must close within or below the gap
Confirmation Signals
- The fifth candle closes well within the gap
- Volume increases on the fifth candle
- Follow-through selling on the next bar
- RSI drops below 50 after the pattern completes
Invalidation Signals
- Price rallies above the fourth candle's high
- The fifth candle fails to close within the gap
- Very low volume on the fifth candle
Candle Breakdown
Trend Candle
A long bullish candle continuing the uptrend with a large body and normal volume.
Trend continuation. Buyers are confident and the move feels sustainable at this point.
Gap Up Candle
A bullish candle that gaps above the first candle's close, often on excitement or news.
Euphoria spikes. The gap up pulls in momentum chasers and creates excitement. This is often the exhaustion point.
First Drift Candle
A small-bodied candle that may be bullish or bearish. It drifts slightly higher or stays flat.
Momentum stalls. After the gap up, there is little follow-through. Smart money begins quietly distributing.
Second Drift Candle
Another small-bodied candle continuing the drift with minimal progress higher.
The rally is running on fumes. Volume dries up. Most of the buying is by late retail traders; institutional selling is absorbing their orders.
Reversal Candle
A large bearish candle that closes within the gap between candles 1 and 2, erasing most or all of the rally's gains.
Sellers overwhelm the thinned-out buy side. The gap fill triggers stop losses from the gap-up buyers. Panic selling ensues as the breakaway completely fails.
Psychology
The Breakaway pattern captures the full lifecycle of a failed rally: euphoric breakout, gradual loss of momentum, and decisive reversal. It is a textbook example of how gaps can be traps.
Buyer Perspective
Buyers are excited by the strong first candle and gap up. During the drift phase, they rationalize the stalling as 'healthy consolidation.' When the fifth candle smashes through, buyers realize they have been caught in a trap.
Seller Perspective
Sellers observe the gap up and begin selling into strength during the drift candles. The low volume confirms weak hands are buying. The fifth candle is the culmination of their selling campaign.
Smart Money Action
Smart money uses the gap up and subsequent drift to distribute positions. The three small candles provide the time needed to offload large positions without crashing the price. The fifth candle reflects their accumulated selling.
Retail Trader Trap
Retail traders see the gap up as a breakout signal and enter long during candles 2-4. The slowly drifting price feels safe. The fifth candle wipes out their gains and triggers their stops in the gap area.
Emotional Cycle
Trading Strategy
Aggressive Entry
Short at the close of the fifth candle once you confirm it closes within the gap.
Conservative Entry
Wait for a sixth candle to close below the low of the fifth candle.
The low of the first candle.
The swing low that preceded the uptrend.
2:1 risk-reward ratio target.
Best Conditions
- Timeframe: daily
- Timeframe: weekly
- after a speculative gap-up rally
- near major resistance
- overbought conditions
- Asset: stocks
- Asset: indices
- Asset: crypto
Avoid When
- Timeframe: 1m
- Timeframe: 5m
- Timeframe: 15m
- strong fundamental catalyst supporting the gap
- breakout from long consolidation
Confluence Factors
- Gap up was driven by weak catalyst or hype
- RSI divergence during the drift phase
- Pattern forms at a measured move target
- Volume profile confirms exhaustion
- Higher timeframe shows resistance at this level
Scale In Strategy
Enter 50% at the fifth candle close, add 50% on confirmation below the gap area.
Scale Out Strategy
Take 40% at first target, 40% at second target, trail 20%.
Risk Management
Volume Analysis
Volume Confirmation
Volume should decline on candles 3-4 and spike on candle 5. This high-low-low-low-high volume pattern is the ideal signature.
Volume Profile
Look for a volume vacuum during the drift phase followed by a volume explosion on the reversal candle.
Volume Divergence
Declining volume during the drift phase is the most important volume signal for this pattern.
Technical Confluence
Support Resistance
The gap area becomes the key zone. If the fifth candle closes within the gap, the upper boundary of the gap becomes resistance.
Fibonacci Levels
The gap up often occurs at Fibonacci extension levels. The fifth candle targeting the 38.2% retracement of the uptrend is common.
Moving Averages
The drift candles often stall at a level where the 10 or 20 EMA catches up to price, creating the divergence needed for the reversal.
Rsi Confirmation
RSI typically shows bearish divergence during the drift phase — price inches higher but RSI declines.
Macd Confirmation
MACD histogram declining during candles 3-4 provides early warning of the fifth candle's reversal.
Bollinger Bands
The gap up often pushes price above the upper Bollinger Band. The drift candles remain elevated while the band squeezes, setting up the mean reversion on candle 5.
Vwap
The fifth candle often closes below the anchored VWAP from the start of the rally, confirming the trend reversal.
Ichimoku Cloud
If the gap up pushes price above the cloud but the drift shows no follow-through, the reversal back into the cloud is the natural resolution.
Elliott Wave
The Breakaway pattern often represents the end of a fifth wave extension, with the gap up being the terminal move.
Wyckoff Phase
The gap up and drift align with the Buying Climax and Automatic Reaction phases of Wyckoff distribution.
Market Profile
The drift candles create a thin volume node at elevated prices, and the fifth candle breaks back into the high-volume area below.
Order Flow
Watch for passive selling (absorbed buying) during the drift and aggressive selling (market sell orders) on candle 5.
Open Interest
In futures, open interest declining during the drift suggests longs are exiting, not new longs entering.
Multi-Timeframe Analysis
Higher Timeframe Alignment
A daily Breakaway at a weekly resistance level is high conviction. Check the weekly chart for overbought conditions.
Lower Timeframe Entry
After identifying the drift phase on the daily chart, use the 1-hour chart to find an early entry as the fifth candle begins to form.
Timeframe Confluence
The pattern rarely forms on weekly charts. When it does, it signals a significant multi-week reversal.
Top-Down Approach
Weekly: identify major resistance. Daily: spot the Breakaway forming. 4H: refine entry timing on the fifth candle.
Statistics
Historical Examples
Netflix (NFLX) Bearish Breakaway After Earnings
successNFLX gapped up on earnings then drifted for three days with small-bodied candles on declining volume. The fifth day saw a massive bearish candle that closed well within the earnings gap. The stock fell 15% over the next month.
Lesson: Earnings gaps that stall in the first few days often become Breakaway patterns. Watch for declining volume during the drift as the key warning.
EUR/USD Breakaway Pattern
partialEUR/USD showed a breakaway pattern but the fifth candle only partially filled the gap. The reversal occurred but was slow and grinding rather than decisive.
Lesson: In forex, gaps are rarer and the Breakaway pattern tends to play out more slowly. Adjust expectations for the asset class.
Variations
Partial Breakaway
The fifth candle closes near the gap but not fully within it.
Extended Breakaway
The drift phase lasts 4-5 candles instead of 3, making it a 6-7 candle pattern.
Confusion Matrix
Patterns commonly confused with Bearish Breakaway and how to distinguish them.
Bearish Evening Star
5000% similarCount the candles and look for the three-candle drift phase. The Breakaway has a more developed story of momentum loss.
Key Differences
- Evening Star is three candles, Breakaway is five
- Evening Star does not require a gap before the middle candle
- Breakaway has multiple drift candles showing gradual exhaustion
Bearish Exhaustion Gap
6000% similarThe exhaustion gap can reverse quickly. The Breakaway takes several candles to develop and requires a specific structure of declining momentum.
Key Differences
- Exhaustion gap focuses on the gap itself as the reversal signal
- Breakaway requires the full five-candle structure
- Breakaway specifically requires the gap to be filled by the fifth candle
The Bearish Abandoned Baby is one of the rarest and most reliable top reversal patterns in candlestick analysis. It features a doji that is completely isolated by gaps on both sides, signaling an abrupt and dramatic shift from buying to selling pressure.
The Dark Cloud Cover is a two-candle bearish reversal pattern where a bearish candle opens above the prior bullish candle's high and closes below its midpoint, signaling that the bullish 'sky' is being covered by a bearish 'dark cloud.'
The Bearish Engulfing is one of the most powerful and commonly traded two-candle reversal patterns. A large bearish candle completely engulfs the prior bullish candle, demonstrating a decisive shift from buying to selling dominance.
The bearish island reversal is a powerful reversal pattern where price gaps up, trades briefly in an isolated range (the island), then gaps down, leaving the island completely separated by gaps on both sides. It signals a decisive sentiment shift.
The Bullish Breakaway is a five-candle reversal pattern where a gap-down continuation is followed by progressively smaller candles and a strong bullish candle that reclaims the gap, signaling exhaustion of selling pressure.
The ladder top is a five-candle bearish reversal pattern where three bullish candles climb like a ladder, a fourth candle shows hesitation, and a fifth bearish candle confirms the reversal by closing below the third candle's close.
Pro Tips & Common Mistakes
Pro Tips
- The most reliable Breakaway patterns have a clear volume decline from candle 2 through candle 4, followed by a volume spike on candle 5.
- Pay attention to what caused the gap up. If it was a weak catalyst or hype, the Breakaway is more likely to succeed.
- The deeper the fifth candle closes into the gap, the more bearish the signal. A close below the first candle's close is extremely bearish.
- This pattern works well during earnings season, where gaps are common and often overextended.
Common Mistakes
- Mistaking a healthy gap-up consolidation for a Breakaway — the drift candles must show clear weakness, not just sideways consolidation.
- Entering the short too early (during candles 3-4) before the fifth candle confirms the reversal.
- Ignoring the volume pattern — the Breakaway without declining volume during the drift is much less reliable.
- Setting take profit too aggressively — the initial target should be the gap fill, not a full trend reversal.
Advanced Techniques
- Use the Breakaway to set up a longer-term swing trade by entering on the fifth candle and targeting the pre-rally swing low.
- In options, sell call spreads after candle 4 if you anticipate the fifth candle, using the drift zone as the short strike.
- Monitor institutional order flow during the drift phase. Large passive sells absorbed by small retail buys is the footprint of distribution.
Institutional Perspective
Institutions frequently cause Breakaway patterns when they use a gap-up event to distribute large positions over several days. The drift phase is their selling window, and the fifth candle marks the point where their selling overwhelms the remaining demand.
Fun Facts
- The Breakaway pattern is one of the few five-candle patterns in the classical candlestick repertoire, making it one of the most complex candle patterns to identify.
- The pattern appears most frequently during earnings season when gaps are common, making it a favorite among swing traders who focus on post-earnings price action.
- Some Japanese trading texts compare the Breakaway to a bird that flies high (the gap up) only to fall back to earth (the reversal candle).
Frequently Asked Questions
The Bearish Breakaway consists of five candles: a strong bullish candle, a gap-up bullish candle, two to three small drift candles, and a large bearish reversal candle that closes within the gap.
Ideally, the fifth candle closes within the gap area between the first and second candles. It does not need to completely fill the gap, but the deeper it penetrates, the more bearish the signal.
The Breakaway is a relatively rare pattern because it requires five specific candles in sequence with a gap, drift, and reversal. On daily charts, you might see it a few times per year on actively traded stocks.