Overview
Bullish Bear Trap
Also known as: False Breakdown, Bear Squeeze, Fakeout Low
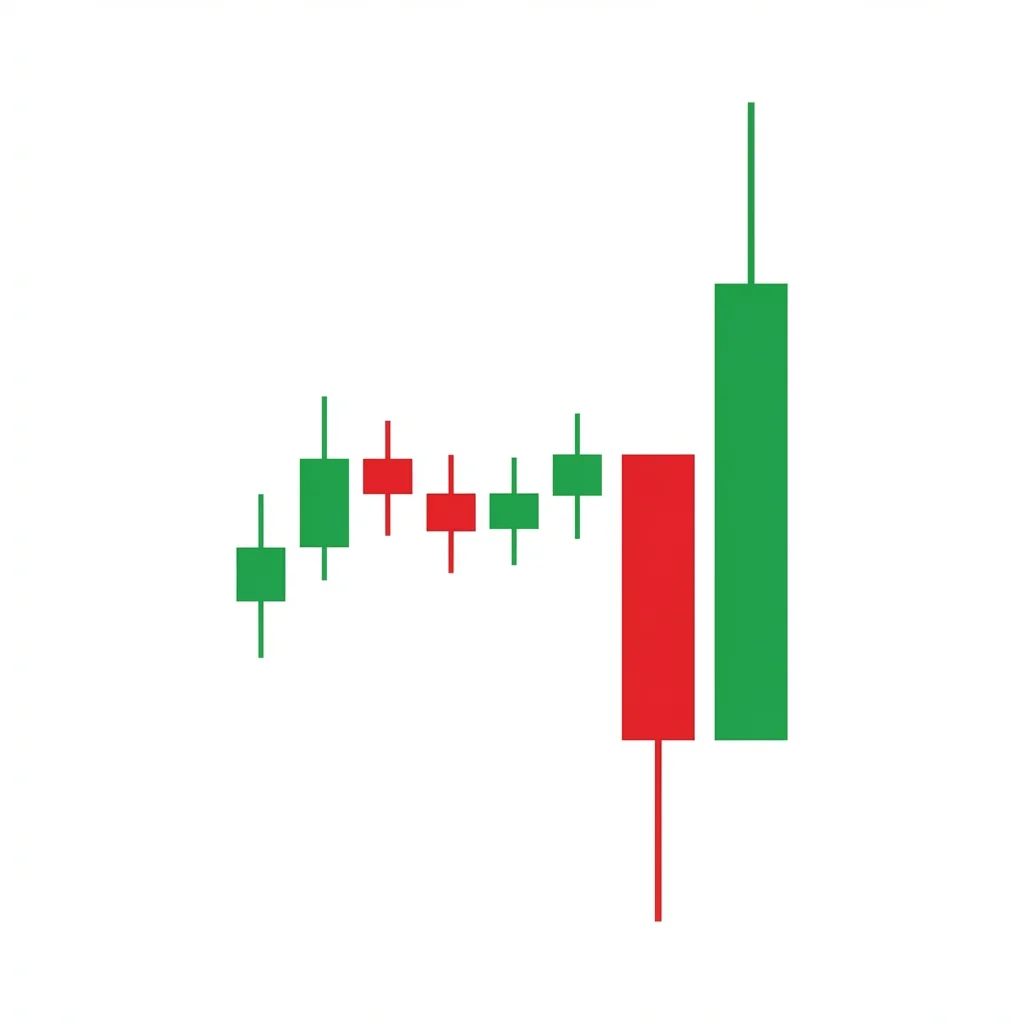
A Bear Trap occurs when price breaks below a key support level, luring bears into short positions, only to reverse sharply higher. The trapped shorts are forced to cover, adding fuel to the bullish reversal.
The Bear Trap is one of the most punishing experiences for short sellers. Price breaks below a significant support level — a trendline, horizontal support, moving average, or pattern boundary — triggering stop-losses from long holders and enticing new short sellers. However, the breakdown is a fake. Within one to three candles, price surges back above the support level, trapping the shorts in losing positions. As shorts are forced to cover (buy back), their buying adds momentum to the reversal, creating a powerful upward move. Bear traps often occur at the end of downtrends, during accumulation phases, or at major support zones where institutional money absorbs the panic selling.
History & Etymology
The concept of trapping traders goes back to Jesse Livermore and the stock market operators of the early 1900s. Livermore described how large operators would deliberately push prices through support to trigger stop-losses, then buy at the depressed prices. Richard Wyckoff formalized this concept as the 'Spring' in his market theory.
The name 'bear trap' comes from the hunting metaphor — a trap that catches bears (sellers/shorts). The bears think they have caught their prey (a breakdown), but instead they are the ones caught when price reverses.
How It Forms
Formation Steps
- 1Price approaches a well-established support level
- 2Price breaks below support, triggering stop-losses and attracting new shorts
- 3Price quickly reverses back above the broken support level
- 4Follow-through buying drives price significantly higher as trapped shorts cover
Prerequisites
- Clear support level that is widely watched by market participants
- Sufficient selling pressure to push price below support
- Quick recovery — the breakdown should not last more than 1-3 bars
Confirmation Signals
- Strong bullish candle that closes back above the broken support
- Volume spike on the reversal candle
- Price quickly moves away from the support zone to the upside
Invalidation Signals
- Price stays below support for an extended period
- Continued selling pressure with expanding volume below support
- No recovery above the support level within 1-3 bars
Candle Breakdown
Breakdown Candle
A bearish candle that breaks below the support level, triggering stops.
Panic selling and stop-loss triggering create the illusion of a legitimate breakdown. Shorts pile in, expecting continuation.
Trap Candle
A strong bullish reversal candle that reclaims the support level, trapping the shorts.
Institutional buying absorbs the panic selling. Shorts realize the breakdown was false and begin covering, adding to buying pressure.
Follow-Through
Continuation bullish candles as short-covering accelerates the move higher.
Short-covering creates a feedback loop. As price rises, more stops are hit, forcing more covering, driving price higher still.
Psychology
Bear traps exploit the human tendency to follow breakdowns. When a support level breaks, it feels like the safe and obvious trade is to sell or short. The trap works because this consensus view is wrong — the breakdown was engineered or unsustainable.
Buyer Perspective
Smart buyers see the false breakdown as a gift. The panic selling provides liquidity for them to buy at depressed prices. They know that the failure of the breakdown means demand exceeds supply.
Seller Perspective
Shorts are confident when support breaks — 'I told you so.' Their confidence quickly turns to desperation as price reverses, and covering becomes urgent.
Smart Money Action
Institutional traders and market makers often trigger bear traps deliberately by pushing price through support with a few large sell orders, then absorbing the resulting panic selling with much larger buy orders at depressed prices.
Retail Trader Trap
Retail traders who had stop-losses just below support get shaken out. Those who went short on the breakdown are squeezed. Both groups lose while institutional buyers profit.
Emotional Cycle
Trading Strategy
Aggressive Entry
Enter long immediately when price reclaims the broken support level with a bullish candle.
Conservative Entry
Wait for a close above the support level and enter on the next candle's open, or wait for a brief pullback to the support zone.
The distance from the trap low to the support level, projected above the support level.
The next major resistance level above.
A measured move based on the entire range that contained the support level.
Best Conditions
- Timeframe: 15m
- Timeframe: 1h
- Timeframe: 4h
- Timeframe: daily
- At the end of downtrends
- Near major support levels
- During accumulation phases
- Asset: stocks
- Asset: futures
- Asset: crypto
- Asset: forex
Avoid When
- Timeframe: 1m
- In free-falling markets where breakdowns are legitimate
- During systematic selling (margin calls, fund liquidations)
Confluence Factors
- Breakdown occurs at a major support level (200 SMA, key horizontal, trendline)
- RSI divergence during the breakdown (price lower but RSI higher)
- The breakdown on low relative volume (suspect breakdown)
- Long lower shadow on the breakdown candle (buying at the lows)
- Wyckoff spring characteristics
Scale In Strategy
Enter 60% on the reclaim of support, add 40% on follow-through above the nearest resistance.
Scale Out Strategy
Take 50% at the first resistance target, trail the remainder with the 8 or 20 EMA.
Risk Management
Volume Analysis
Volume Confirmation
The reversal candle should have significantly higher volume than the breakdown candle, showing that buying overwhelmed the selling.
Volume Profile
Look for a volume spike on the recovery candle. The breakdown candle may also show high volume (stop-loss triggers), but the reversal volume should be equal or greater.
Volume Divergence
If the reversal occurs on low volume, the bear trap may be temporary and price could retest or break the lows again.
Technical Confluence
Support Resistance
The bear trap by definition occurs at a support level. The reclaim of that support after the false breakdown makes it an even stronger support going forward.
Fibonacci Levels
Bear traps at 61.8% or 78.6% Fibonacci retracement levels are particularly powerful reversal signals.
Moving Averages
Bear traps at the 200 SMA or 50 SMA are among the most reliable. The false breakdown below a major moving average followed by reclaim is a strong bullish signal.
Rsi Confirmation
Bullish divergence on RSI during the trap (price makes new low, RSI does not) is a strong confirmation that the breakdown is false.
Macd Confirmation
MACD not confirming the new low (making a higher low) during the bear trap confirms the divergence.
Bollinger Bands
A bear trap that pierces the lower Bollinger Band and quickly returns inside is a classic mean-reversion signal.
Vwap
On intraday charts, a bear trap below VWAP that reclaims VWAP is a high-probability long entry.
Ichimoku Cloud
A false breakdown below the Kumo cloud that quickly recovers above it signals a strong bear trap.
Elliott Wave
Bear traps often mark the end of Wave C in corrective patterns or the end of an extended Wave 5.
Wyckoff Phase
The Wyckoff 'Spring' is a specific type of bear trap during the accumulation phase.
Market Profile
Bear traps often occur when price briefly trades below the value area low before being rejected back inside.
Order Flow
Look for aggressive market buy orders absorbing the selling pressure during the trap — delta should swing positive sharply.
Open Interest
In futures, a spike in open interest during the trap followed by a drop as price recovers indicates shorts being established and then liquidated.
Multi-Timeframe Analysis
Higher Timeframe Alignment
A bear trap on the daily chart at a weekly support level is extremely powerful.
Lower Timeframe Entry
Use the 15-minute or 1-hour chart to spot the exact candle when price reclaims support for precise entry.
Timeframe Confluence
The best bear traps are visible on multiple timeframes — a daily trap at a weekly support level.
Top-Down Approach
Weekly identifies the key support → Daily spots the false breakdown → 1-hour times the recovery entry.
Statistics
Historical Examples
S&P 500 Bear Trap at 200-Day SMA
successThe S&P 500 broke below its 200-day SMA during the regional banking crisis, triggering widespread panic. Within two sessions, price reclaimed the 200-day SMA and rallied sharply over the following weeks.
Lesson: Bear traps at major moving averages during fear events are some of the most profitable setups. The panic creates the supply that institutions absorb.
Variations
Intraday Bear Trap
A bear trap that occurs during a single trading session, often at the open or during the first hour.
Multi-Day Bear Trap
Price stays below support for 2-3 days before recovering, creating a more convincing (and more painful) trap.
Confusion Matrix
Patterns commonly confused with Bullish Bear Trap and how to distinguish them.
Bullish Spring
8500% similarA spring is a bear trap, but within the specific context of a Wyckoff accumulation range. If there is no clear accumulation range, it is simply a bear trap.
Key Differences
- Springs are specifically within Wyckoff accumulation ranges
- Bear traps can occur at any support level in any context
Bullish Key Reversal
6000% similarBear traps require a specific support level to be broken and reclaimed. Key reversals are about the individual candle making a new low and reversing.
Key Differences
- Key reversals are single-candle events that make new lows and close bullish
- Bear traps specifically involve breaking a defined support level
A Bull Trap is a false breakout above resistance that lures buyers in before immediately reversing, trapping them at elevated prices and triggering a sharp sell-off as trapped longs are forced to exit.
The Bullish Engulfing is one of the most popular and reliable two-candle reversal patterns. A large bullish candle completely engulfs the prior bearish candle body, signaling a decisive shift from selling to buying control.
A Bullish Key Reversal occurs when price makes a new low during a downtrend but reverses to close above the prior bar's high on heavy volume, signaling a dramatic single-day shift in control from sellers to buyers.
The Bullish Selling Climax occurs when an extended downtrend reaches a point of maximum panic, producing a wide-range bearish candle on extraordinary volume. The exhaustion of selling pressure creates conditions for a sharp reversal as the last sellers capitulate.
The Bullish Spring is a Wyckoff pattern where price briefly breaks below trading range support to trigger stop losses, then immediately reverses back above support, trapping shorts and initiating a markup phase.
The Bullish Support Bounce is one of the most fundamental trading patterns where price declines to a well-established support level and bounces higher, confirmed by bullish price action and volume at the support zone.
Pro Tips & Common Mistakes
Pro Tips
- The best bear traps occur at support levels that everyone is watching — the more obvious the level, the more stop-losses exist below it
- If the breakdown occurs on low volume, it is more likely to be a trap
- Look for bullish divergence on RSI or MACD during the breakdown for confirmation
- React quickly — bear trap reversals move fast because short-covering is urgent
- The reclaim of support is the signal, not the breakdown itself — do not try to catch the knife during the breakdown
Common Mistakes
- Buying the breakdown thinking it is a trap before price actually recovers (catching a falling knife)
- Ignoring volume — if the breakdown is on massive volume, it may be legitimate
- Setting stops too tight after entering the bear trap trade — allow room for volatility
- Not recognizing that sometimes support breaks for real — not every breakdown is a trap
- Trading bear traps in a clearly bearish market where breakdowns are genuine
Advanced Techniques
- Use order flow analysis to see institutional absorption during the breakdown
- Monitor the options market — a bear trap often coincides with high put volume that creates a gamma squeeze on recovery
- Place limit buy orders slightly below widely-watched support levels to catch the trap
- Combine bear trap analysis with Wyckoff Spring theory for the highest-conviction setups
Institutional Perspective
Institutions frequently engineer bear traps, particularly at obvious support levels where retail stop-losses cluster. By pushing price briefly below support, they trigger a cascade of selling that provides liquidity for their buy orders. This is a core concept in smart money analysis.
Fun Facts
- The largest bear trap in modern market history arguably occurred during the 2020 COVID crash, when the S&P 500 broke multiple support levels only to stage the fastest recovery in history.
- Research shows that approximately 30-40% of support breakdowns are actually bear traps, which is why experienced traders wait for confirmation before shorting breakdowns.
- The term 'stop hunting' is so well-known that some algorithmic trading systems are specifically designed to avoid placing stops at obvious levels.
Frequently Asked Questions
Volume is the best clue. If the breakdown occurs on low volume, it is more likely a trap. If it occurs on massive volume, it may be real. Also check RSI — if RSI shows bullish divergence (not confirming the new low), the breakdown is likely false. Speed of recovery matters too — real breakdowns do not quickly recover above support.
Yes. Market makers and large institutions can push price below support levels where they know stop-losses are clustered. By triggering these stops, they create selling liquidity that they absorb with buy orders. This is known as 'stop hunting' and is a well-documented market microstructure phenomenon.