Overview
Bearish Three Line Strike
Sanpei Daiinsen
Also known as: Three Line Strike Down, Bearish Strike, Three Crows Strike
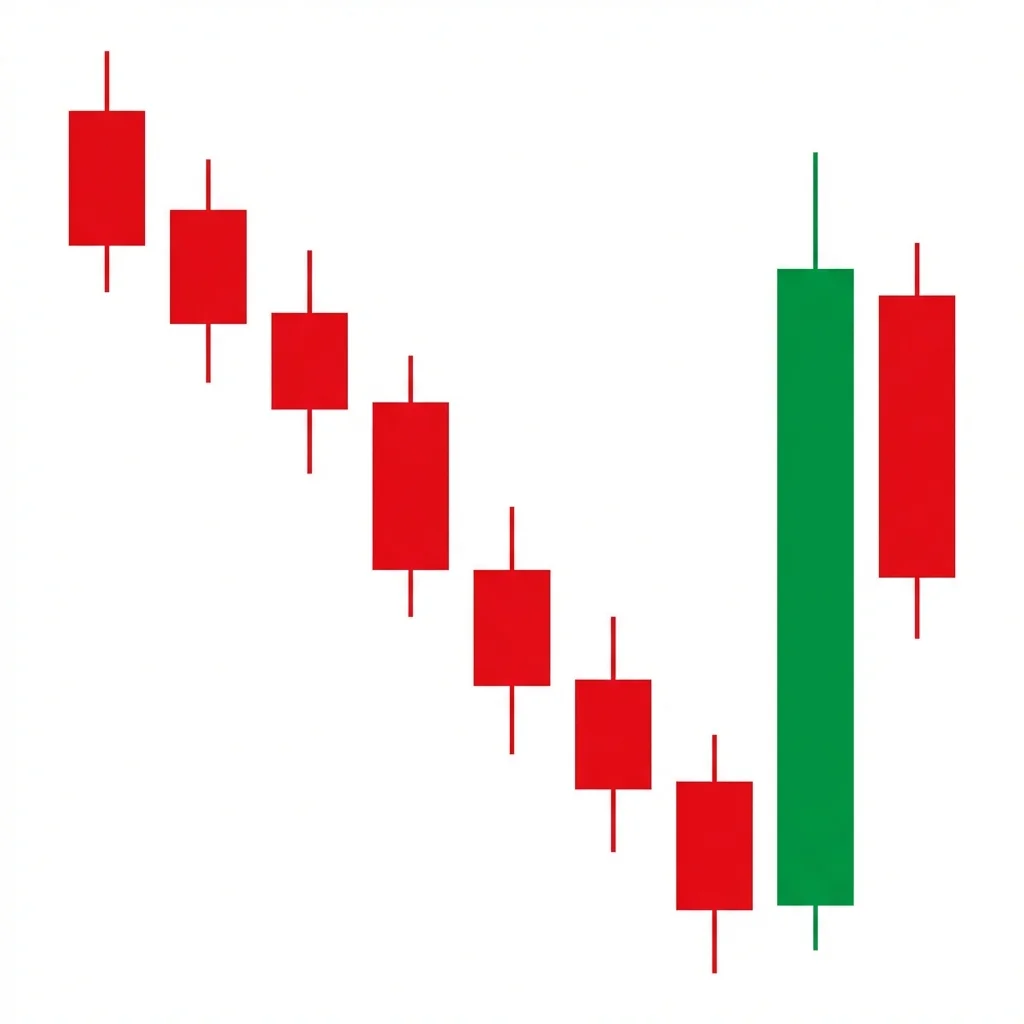
The bearish three line strike features three bearish candles followed by a large bullish candle that engulfs all three. Despite the dramatic bullish fourth candle, the pattern paradoxically signals bearish continuation—the bullish candle is a temporary short squeeze before the downtrend resumes.
The bearish three line strike is a counterintuitive four-candle pattern. It begins with three consecutive bearish candles (like three black crows) that establish the selling trend. The fourth candle is a large bullish candle that opens below the third candle and closes above the first candle's open, essentially 'erasing' the three prior sessions. Intuitively, this seems bullish. However, Thomas Bulkowski's research shows that the pattern actually signals bearish continuation approximately 84% of the time. The bullish strike candle represents a violent short squeeze or dead cat bounce that temporarily reverses the selling. Once this counter-move exhausts itself, the original downtrend resumes. The pattern traps late buyers who interpret the strike candle as a reversal.
History & Etymology
The three line strike was documented in Japanese candlestick literature and gained prominence in Western analysis through Thomas Bulkowski's statistical research in 'Encyclopedia of Candlestick Charts,' where he found its surprisingly high reliability as a continuation pattern.
'Three line' refers to the three bearish candles. 'Strike' describes the fourth bullish candle that 'strikes through' or engulfs all three bearish candles. The Japanese name 'sanpei daiinsen' translates roughly to 'three soldiers big negative line.'
How It Forms
Formation Steps
- 1Three consecutive bearish candles, each closing lower (similar to three black crows)
- 2Fourth candle is a large bullish candle that opens below the third candle and closes above the first candle's open
- 3The bullish candle 'strikes' or engulfs all three bearish candles
- 4Despite the bullish fourth candle, the pattern signals bearish continuation
Prerequisites
- Established downtrend
- Three consecutive bearish candles preceding the strike
Confirmation Signals
- Fifth candle is bearish, closing below the third candle's close
- The bullish 'strike' candle represents a temporary short squeeze, not a reversal
- Volume on the strike candle is moderate, not climactic
Invalidation Signals
- Follow-through buying after the strike candle
- The strike candle occurs on extremely high volume (potential climax)
- Bullish continuation above the strike candle's high
Candle Breakdown
First Bearish Candle
A long bearish candle continuing the downtrend.
Consistent selling continues the established downtrend.
Second Bearish Candle
Opens within the first and closes lower, building the bearish sequence.
Selling pressure remains steady—no sign of letting up.
Third Bearish Candle
Completes the three-candle bearish sequence, closing at the lowest point.
Three straight bearish sessions attract short-covering interest and bottom-fishers.
Strike Candle (Bullish)
A large bullish candle that opens below the third candle and closes above the first candle's open, engulfing all three.
A violent short squeeze creates a massive bullish candle that looks like a reversal. However, this temporary bounce attracts new buyers who will be trapped.
Psychology
The three line strike exploits the natural human tendency to see a large bullish candle as a reversal signal. Smart money uses the short squeeze to sell at higher prices before resuming the decline.
Buyer Perspective
Buyers see the massive bullish candle and believe the bottom is in. They enter long positions, providing the liquidity that sellers need for the next leg down.
Seller Perspective
Smart sellers allow the short squeeze to run its course, then re-enter short at the higher prices offered by the strike candle. The squeeze gives them a better entry.
Smart Money Action
Institutional sellers let short covering create the strike candle, then use the higher prices to re-establish or add to their short positions.
Retail Trader Trap
Retail traders buy the massive bullish candle, interpreting it as a reversal. They become trapped when the downtrend resumes.
Emotional Cycle
Trading Strategy
Aggressive Entry
Enter short at the close of the strike candle or when it shows signs of resistance.
Conservative Entry
Wait for the fifth candle to close bearish below the midpoint of the strike candle before entering short.
Below the third candle's low (the low before the strike)
Measured move equal to the height of the three bearish candles
Next major support level
Best Conditions
- Timeframe: 1D
- Timeframe: 1W
- Timeframe: 4h
- Strong downtrends with periodic short squeezes
- Bear markets
- Asset: Stocks
- Asset: Indices
- Asset: Crypto
Avoid When
- Timeframe: 1m
- Timeframe: 5m
- Markets near major support levels
Confluence Factors
- Pattern in an established downtrend
- Strike candle at a known resistance level
- Moving averages sloping down above the pattern
- RSI failing to reach overbought on the strike candle
Scale In Strategy
Enter on the fifth candle and add if price fails to reclaim the strike candle's high.
Scale Out Strategy
Take 50% below the pre-strike low, trail the rest.
Risk Management
Volume Analysis
Volume Confirmation
The strike candle should have moderate volume. Extremely high volume may indicate a genuine reversal rather than a short squeeze.
Volume Profile
Volume on the strike should be less than the volume on the three bearish candles combined.
Volume Divergence
If the strike candle has the highest volume in the sequence, it may be a genuine reversal rather than a continuation setup.
Technical Confluence
Support Resistance
The strike candle's high becomes resistance. The pre-strike low is the first target.
Fibonacci Levels
The strike candle often retraces to the 50-61.8% level of the three-candle decline.
Moving Averages
The strike candle often rallies to a declining 20 or 50 EMA before reversing.
Rsi Confirmation
RSI failing to break above 50 on the strike candle confirms the continuation bias.
Macd Confirmation
MACD remaining below zero during the strike candle confirms the bearish context.
Bollinger Bands
The strike candle may reach the middle Bollinger Band before reversing lower.
Vwap
The strike candle rallying to but not above VWAP confirms institutional selling.
Ichimoku Cloud
Pattern below the Kumo cloud with the strike candle failing at the cloud confirms bearish.
Elliott Wave
The three bearish candles may be a sub-wave; the strike is a brief correction before continuation.
Wyckoff Phase
May represent a brief automatic rally within the markdown phase.
Market Profile
The strike candle tests the value area but fails to establish acceptance above it.
Order Flow
The strike candle shows forced short covering (stop triggers), not genuine new buying interest.
Open Interest
Monitor open interest for confirmation of institutional participation.
Multi-Timeframe Analysis
Higher Timeframe Alignment
Daily three line strike during a weekly downtrend is the highest probability setup.
Lower Timeframe Entry
Use the 4H chart to see when the strike candle's buying exhausts for precise entry.
Timeframe Confluence
Daily pattern in weekly downtrend with 4H entry confirmation.
Top-Down Approach
Weekly downtrend > Daily three line strike > 4H short entry.
Statistics
Historical Examples
S&P 500 Three Line Strike 2022
successThe S&P 500 dropped for three days then rallied sharply on a single day (Fed day). The bullish strike candle trapped buyers, and the index dropped 12% over the next five weeks.
Lesson: Three line strikes during bear markets often trap buyers who mistake short squeezes for reversals.
Variations
Three Line Strike with Gap
The strike candle gaps up before reversing, adding drama to the short squeeze.
Confusion Matrix
Patterns commonly confused with Bearish Three Line Strike and how to distinguish them.
Bearish Falling Three Methods
6500% similarIf one large bullish candle engulfs three bearish candles, it is a three line strike. If several small corrective candles stay within a bearish range, it is falling three methods.
Key Differences
- Falling three methods has small candles inside a bearish range
- Three line strike has one large bullish candle engulfing three bearish
- The strike candle is much larger than the corrective candles in falling three methods
Three black crows is a powerful bearish reversal pattern consisting of three consecutive long bearish candles, each opening within the prior candle's body and closing near its low. It signals strong, persistent selling pressure and a likely trend reversal.
The Bullish Three Line Strike is a four-candle continuation pattern where three bullish candles are followed by a large bearish candle that engulfs all three. Despite the dramatic sell-off, the pattern is a continuation signal — the fourth candle is a shakeout that traps sellers before the uptrend resumes.
The Bearish Breakaway is a five-candle reversal pattern where a gap-up rally stalls over three sessions before a powerful bearish candle breaks back down into the gap, signaling the uptrend is exhausted.
The ladder top is a five-candle bearish reversal pattern where three bullish candles climb like a ladder, a fourth candle shows hesitation, and a fifth bearish candle confirms the reversal by closing below the third candle's close.
The bearish staircase down is a trend continuation pattern characterized by a rhythmic series of lower highs and lower lows, creating a step-like descending structure. Each step represents a decline followed by a partial recovery that fails to reclaim the prior high.
The Bullish Breakaway is a five-candle reversal pattern where a gap-down continuation is followed by progressively smaller candles and a strong bullish candle that reclaims the gap, signaling exhaustion of selling pressure.
Pro Tips & Common Mistakes
Pro Tips
- The pattern's power lies in its counterintuitive nature—the big bullish candle looks like a reversal but is actually a continuation signal.
- Bulkowski's research shows ~84% of bearish three line strikes resolve to the downside.
- Wait for the fifth candle to confirm—the strike candle itself is not the entry.
- The larger the strike candle relative to the three bearish ones, the more dramatic the trap.
Common Mistakes
- Buying the strike candle thinking it is a reversal
- Not waiting for confirmation after the strike
- Ignoring the pattern because the bullish candle looks too strong
Advanced Techniques
- Use the strike candle's high as a clear stop-loss level and the pre-strike low as the first target for an excellent risk-reward setup.
- In options, sell call spreads above the strike candle's high to profit from the continuation.
Institutional Perspective
The strike candle is a textbook example of institutional traders allowing short covering to provide them with better selling prices. The resulting bullish candle is absorbed by new institutional selling.
Fun Facts
- The three line strike is one of the most counterintuitive patterns in candlestick analysis—a massive bullish candle that is actually bearish.
- Thomas Bulkowski's backtesting found the bearish three line strike to be one of the most reliable continuation patterns, defying its visual appearance.
Frequently Asked Questions
The large bullish candle in a three line strike represents a temporary short squeeze, not a genuine reversal. Bulkowski's research shows that approximately 84% of bearish three line strikes resolve to the downside.