Overview
Bearish Engulfing
Tsutsumi
Also known as: Engulfing Bearish, Outside Down, Bearish Outside Bar
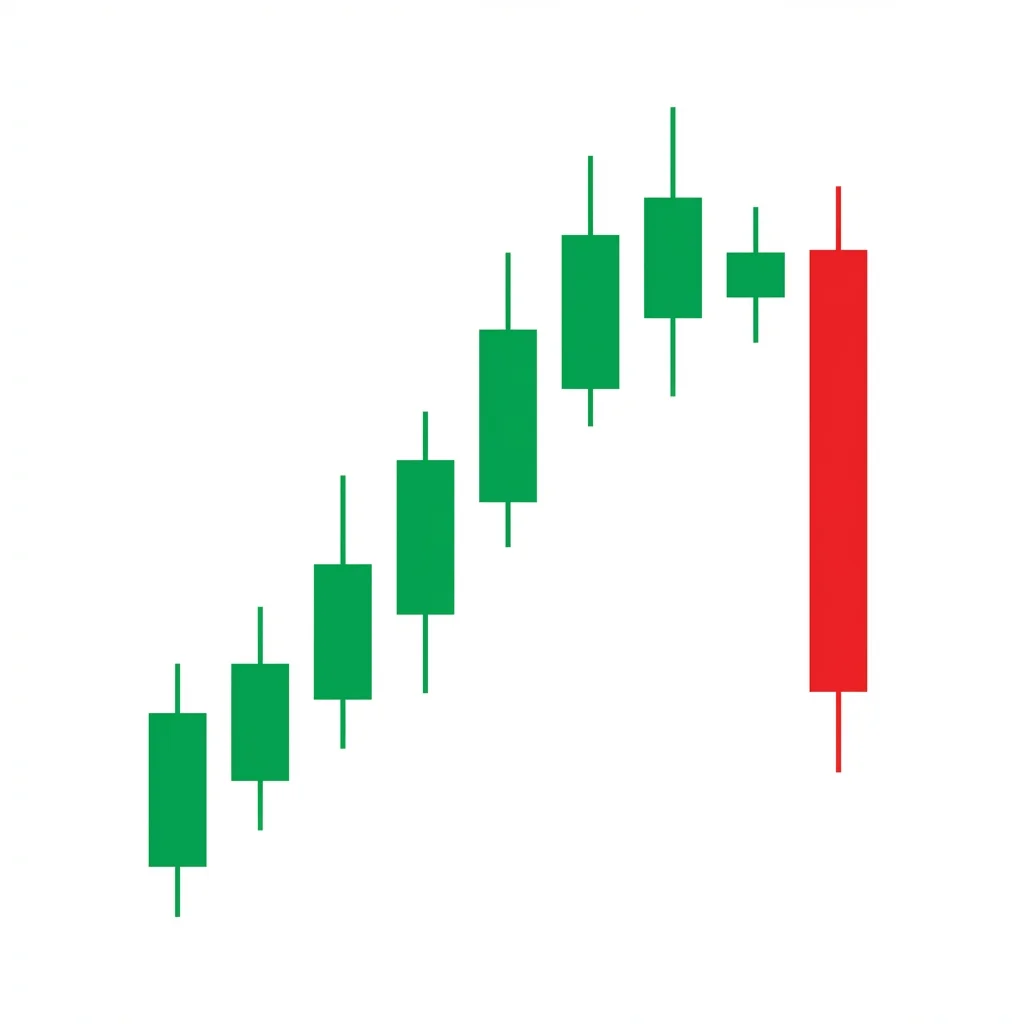
The Bearish Engulfing is one of the most powerful and commonly traded two-candle reversal patterns. A large bearish candle completely engulfs the prior bullish candle, demonstrating a decisive shift from buying to selling dominance.
The Bearish Engulfing pattern is arguably the most important two-candle reversal pattern in candlestick analysis. It occurs when a large bearish candle opens above the previous bullish candle's close and closes below the previous candle's open, completely engulfing its body. This total engulfment represents a dramatic reversal of sentiment within a single session. The larger the second candle relative to the first, the stronger the signal. The pattern is more significant than the Dark Cloud Cover because it shows complete, not just partial, reversal of the prior session's gains. In Western bar chart analysis, this is equivalent to the 'outside down' bar or 'bearish outside bar.'
History & Etymology
The engulfing pattern ('Tsutsumi') is one of the foundational patterns in Japanese candlestick analysis, dating back centuries. The concept of one candle 'swallowing' another is deeply intuitive and was among the first patterns recognized by Japanese rice traders. Steve Nison's introduction of the pattern to the West made it one of the most widely known candlestick formations.
'Engulfing' means to completely surround or swallow. The second candle's body 'engulfs' (fully contains) the first candle's body. The Japanese name 'Tsutsumi' means 'wrapping' — the larger candle wraps around the smaller one.
How It Forms
Formation Steps
- 1First candle: a bullish candle (typically with a smaller body) in an uptrend
- 2Second candle: a bearish candle that opens above the first candle's close and closes below the first candle's open — completely engulfing the first candle's body
Prerequisites
- Established uptrend
- The second candle's body must completely engulf the first candle's body
- The second candle opens higher than the first candle's close and closes lower than the first candle's open
Confirmation Signals
- Volume increases on the second candle
- Follow-through selling on the next bar
- Break below the second candle's low
- RSI turning down from overbought
Invalidation Signals
- Price closes above the second candle's open on the next bar
- Very low volume on the second candle
- Immediate recovery above the engulfing candle
Candle Breakdown
Bullish Candle
A smaller bullish candle continuing the uptrend.
Buyers maintain control but with less enthusiasm — the smaller body hints at waning momentum.
Engulfing Bearish Candle
A large bearish candle that opens above the first candle's close and closes below the first candle's open, fully engulfing the first candle's body.
Sellers completely overwhelm the buyers. The entire previous session's gains are erased and then some. This decisive action shifts sentiment from bullish to bearish.
Psychology
The Bearish Engulfing represents one of the clearest sentiment shifts in candlestick analysis. The bulls' work is completely undone in a single session, demonstrating that sellers have seized control.
Buyer Perspective
Buyers from the first candle see their gains evaporate as the second candle falls below their entry levels. The complete engulfment is psychologically devastating — it feels like the market turned on them.
Seller Perspective
Sellers are emboldened by the complete reversal. The fact that they could overpower the previous day's buyers gives them confidence to maintain selling pressure.
Smart Money Action
Institutions use the gap-up open to distribute large positions. The engulfing candle is the footprint of institutional selling overwhelming retail buying.
Retail Trader Trap
Retail traders buy the first candle and may add on the gap up. The complete engulfment stops them out and creates selling pressure as they exit.
Emotional Cycle
Trading Strategy
Aggressive Entry
Short at the close of the engulfing candle.
Conservative Entry
Short on a break below the engulfing candle's low on the next bar.
Nearest support level.
2x the engulfing candle's body length.
Previous swing low or 61.8% Fibonacci retracement.
Best Conditions
- Timeframe: daily
- Timeframe: weekly
- Timeframe: 4h
- at resistance
- overbought
- after extended uptrend
- Asset: stocks
- Asset: forex
- Asset: indices
- Asset: crypto
Avoid When
- Timeframe: 1m
- Timeframe: 5m
- strong breakout momentum
Confluence Factors
- At a resistance level
- Volume spike on engulfing candle
- RSI divergence
- Bollinger Band rejection
- Multiple timeframe resistance
Scale In Strategy
Enter 60% at engulfing close, add 40% on break of the low.
Scale Out Strategy
Take 50% at 1:1 R:R, trail 50% with 10 EMA.
Risk Management
Volume Analysis
Volume Confirmation
Volume on the engulfing candle should be higher than the first candle — ideally 1.5x or more.
Volume Profile
Low volume first candle, high volume second candle is the textbook signature.
Volume Divergence
Declining volume on the uptrend before the engulfing pattern adds confidence.
Technical Confluence
Support Resistance
The engulfing candle's high becomes a strong resistance level.
Fibonacci Levels
Pattern at Fibonacci extension levels adds confluence. Target retracements for profit.
Moving Averages
Engulfing at or above a declining 50 MA is particularly significant.
Rsi Confirmation
RSI above 70 with a bearish reversal on the engulfing day is textbook.
Macd Confirmation
A bearish MACD crossover coinciding with the engulfing strengthens the signal.
Bollinger Bands
Engulfing at the upper Bollinger Band is a mean-reversion setup.
Vwap
Engulfing candle closing below VWAP confirms seller dominance for the session.
Ichimoku Cloud
Pattern above the cloud with the engulfing closing toward it signals weakness.
Elliott Wave
Common at the end of Wave 5 or the peak of Wave B.
Wyckoff Phase
Can represent the Upthrust failure in distribution.
Market Profile
The engulfing creates a reversal day in the market profile with a long-range close at the low.
Order Flow
Aggressive selling (negative delta) on the engulfing candle confirms institutional involvement.
Open Interest
Rising OI with the engulfing in futures confirms new short positions.
Multi-Timeframe Analysis
Higher Timeframe Alignment
A daily engulfing at weekly resistance is high conviction.
Lower Timeframe Entry
After the daily engulfing, use the 4H chart for precise entry on the follow-through candle.
Timeframe Confluence
A weekly engulfing is a major reversal signal that can impact months of price action.
Top-Down Approach
Weekly: resistance identified. Daily: engulfing forms. 4H: manage the trade.
Statistics
Historical Examples
Tesla Bearish Engulfing November 2021
successTSLA formed a massive bearish engulfing at $1,243 with volume 3x the average. The stock declined to $560 over the following six months — a 55% drop.
Lesson: The size and volume of the engulfing candle signaled major institutional distribution. The larger the engulfing relative to recent candles, the more significant.
Variations
Full Body Engulfing
The second candle engulfs the first candle's entire range (including shadows), not just the body.
Three-Candle Engulfing
The engulfing candle engulfs the bodies of the last two or three candles.
Confusion Matrix
Patterns commonly confused with Bearish Engulfing and how to distinguish them.
Bearish Dark Cloud Cover
7500% similarCheck if the second candle closes below the first candle's open. If yes = Engulfing. If it only closes below the midpoint = Dark Cloud Cover.
Key Differences
- Dark Cloud Cover closes below the midpoint but not below the open of the first candle
- Engulfing closes BELOW the first candle's open — full engulfment
- Engulfing is stronger
The Bearish Counterattack Line features a bullish candle followed by a bearish candle that gaps up at the open but closes back to the same level as the first candle's close, signaling that sellers 'counterattacked' the bullish advance.
The Dark Cloud Cover is a two-candle bearish reversal pattern where a bearish candle opens above the prior bullish candle's high and closes below its midpoint, signaling that the bullish 'sky' is being covered by a bearish 'dark cloud.'
The Bearish Doji Star is a two-candle reversal pattern featuring a strong bullish candle followed by a doji that gaps above it, signaling that buying momentum has stalled and indecision has replaced conviction at the top of an uptrend.
The bearish key reversal is a powerful single-bar reversal pattern where price makes a new high then reverses to close below the prior bar's low on high volume, signaling a decisive shift from buying to selling control.
The shooting star is a single-candle bearish reversal pattern with a small body near the low and a long upper shadow. It shows that buyers pushed price significantly higher during the session but sellers drove it back down, signaling a potential top.
The Bullish Engulfing is one of the most popular and reliable two-candle reversal patterns. A large bullish candle completely engulfs the prior bearish candle body, signaling a decisive shift from selling to buying control.
Pro Tips & Common Mistakes
Pro Tips
- The larger the engulfing candle relative to the first candle, the stronger the signal. An engulfing candle that is 2-3x the first candle's body is very powerful.
- Volume on the engulfing candle is critical. High volume confirms institutional selling. Low volume engulfing patterns are less reliable.
- The pattern is strongest when it occurs after an extended uptrend at a known resistance level.
- A bearish engulfing that also closes below a key moving average (like the 20 EMA) is a doubly confirmed signal.
Common Mistakes
- Accepting partial engulfment — the second candle must close BELOW the first candle's open, not just below its close.
- Ignoring volume. A low-volume engulfing is much less reliable.
- Trading engulfing patterns in the middle of a trend rather than at resistance levels.
- Setting stops too tight below the engulfing candle's high.
Advanced Techniques
- Use the engulfing candle's midpoint as a future resistance level for retests.
- In options, sell call spreads at the engulfing candle's high for high-probability premium capture.
- Track the frequency of bearish engulfing patterns across a sector. Multiple simultaneous engulfing patterns signal sector-wide distribution.
Institutional Perspective
The Bearish Engulfing is one of the patterns most commonly used in institutional quantitative models. Its clear definition and strong historical performance make it ideal for systematic trading. Many institutional systems require volume confirmation (>1.5x average) and trend context (at resistance) before triggering.
Fun Facts
- The Bearish Engulfing is the single most studied candlestick pattern in academic literature, with multiple peer-reviewed papers confirming its effectiveness.
- In a 2019 study of 8 million candlestick patterns across 26 stock markets, the Bearish Engulfing was found to be profitable in 23 of them.
- The pattern is so widely recognized that some argue its effectiveness should decrease due to crowding, yet it continues to perform well due to the underlying supply/demand dynamics.
Frequently Asked Questions
Strictly, only the body needs to be engulfed — the second candle opens above the first candle's close and closes below the first candle's open. If the shadows are also engulfed (full range engulfment), it is an even stronger signal.
Yes. The Engulfing completely reverses the prior candle's gains (closes below the open), while the Dark Cloud Cover only partially penetrates (closes below the midpoint). The Engulfing shows more decisive selling.