Overview
Bearish Island Reversal
Also known as: Island Top, Bearish Island Cluster, Gap Island Reversal
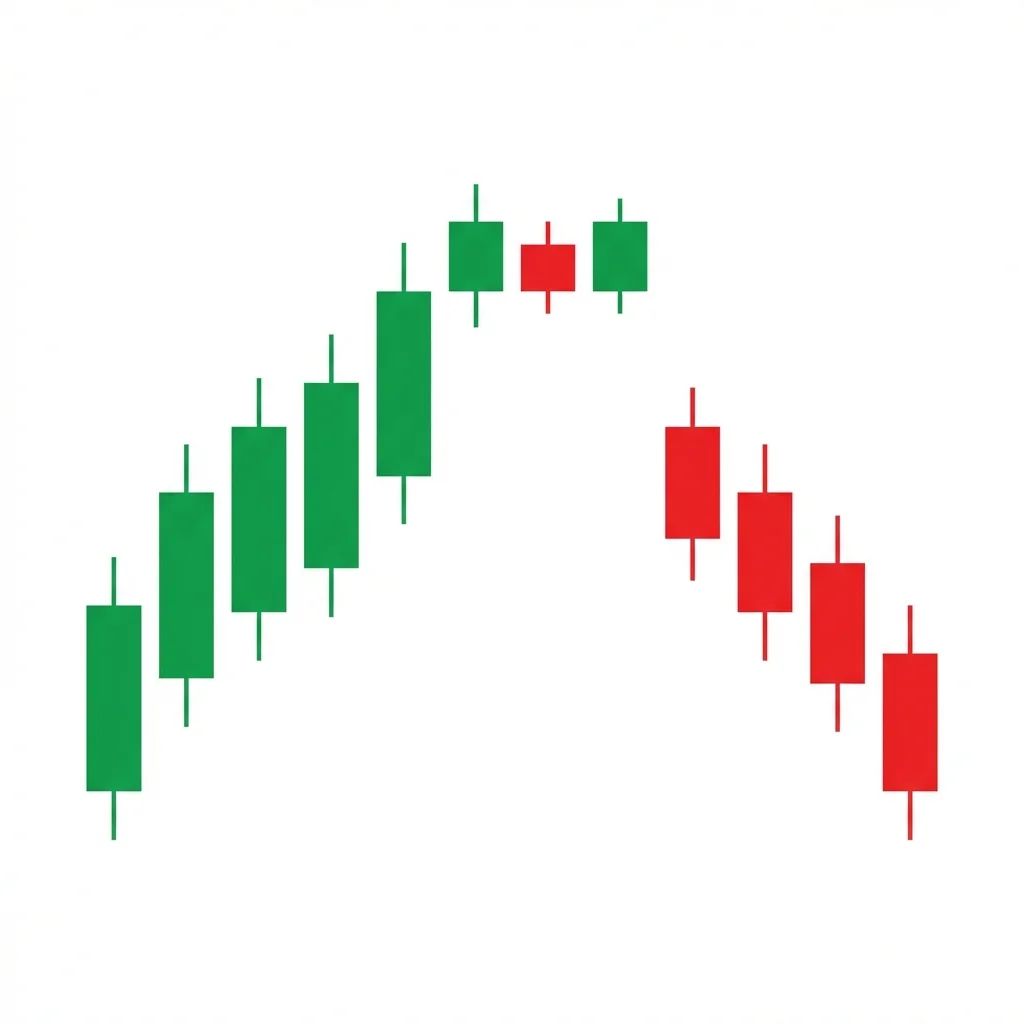
The bearish island reversal is a powerful reversal pattern where price gaps up, trades briefly in an isolated range (the island), then gaps down, leaving the island completely separated by gaps on both sides. It signals a decisive sentiment shift.
The island reversal is one of the most powerful and rare reversal patterns in technical analysis. It occurs when an exhaustion gap up isolates a group of candles at the top of a rally, followed by a breakaway gap down that leaves these candles as an 'island' — completely separated from surrounding price action by gaps on both sides. The pattern shows that euphoric buying (exhaustion gap) was immediately followed by aggressive selling (breakaway gap), with the island candles representing the exact moment of sentiment transition. Because both gaps must remain unfilled for the pattern to be valid, the island reversal has a very high success rate when confirmed.
History & Etymology
Island reversals have been observed in financial markets for over a century. They were first formally described by Schabacker in the 1930s and later detailed by Edwards and Magee. The pattern has been identified at major market turning points, including the 1929 crash, the 2000 dot-com top, and various individual stock peaks.
Named for the visual appearance of candles isolated between two gaps, resembling an island surrounded by water. The 'water' is the gap space on both sides where no trading occurred.
How It Forms
Formation Steps
- 1Exhaustion gap up: price gaps above the prior candle's high
- 2One or more candles trade in a narrow range at the top (the island)
- 3Breakaway gap down: price gaps below the island's low
- 4The island of candles is completely separated by gaps on both sides
Prerequisites
- Prior uptrend
- Exhaustion gap up creating the left gap
- Breakaway gap down creating the right gap
Confirmation Signals
- The breakaway gap down remains unfilled
- Volume is high on the breakaway gap
- Follow-through selling continues after the island
Invalidation Signals
- The breakaway gap fills completely
- Price rallies back into the island zone
- Volume is weak on the breakaway gap
Candle Breakdown
Exhaustion Gap Up
A gap up at the top of an uptrend, driven by the last burst of buying enthusiasm.
The last wave of FOMO buyers drives price up. This gap represents buying exhaustion.
Island Candle(s)
One or more candles trading in a narrow range at the elevated level. These form the 'island.'
Brief equilibrium between exhausted buyers and early sellers. The sentiment is shifting.
Breakaway Gap Down
A gap down that separates the island from subsequent price action. This gap should be large and on high volume.
Aggressive selling overwhelms remaining buyers. The gap traps every buyer who purchased on the island.
Psychology
The island reversal captures the precise moment when market sentiment flips from extreme greed to fear. Everyone who bought on the island is immediately trapped with losses, creating intense selling pressure.
Buyer Perspective
Buyers who chased the exhaustion gap up are immediately trapped when the breakaway gap down occurs. With gaps on both sides, there is no support level nearby, leading to capitulation.
Seller Perspective
Sellers recognize the exhaustion gap as the final thrust and position aggressively on the breakaway gap down. The trapped island buyers provide fuel for the decline.
Smart Money Action
Institutions sell into the exhaustion gap up and initiate shorts on the breakaway gap down. The island represents the zone where institutional distribution was completed.
Retail Trader Trap
Retail traders buy the exhaustion gap driven by FOMO. They are immediately trapped on the island with losses when the breakaway gap occurs, and their stops fuel the decline.
Emotional Cycle
Trading Strategy
Aggressive Entry
Short on the breakaway gap down candle's open or early in the session.
Conservative Entry
Wait for the breakaway gap to remain unfilled for 1-2 sessions, then enter short.
Distance from the island to the exhaustion gap, projected below the breakaway gap.
Start of the prior uptrend that led to the island.
Major support level below.
Best Conditions
- Timeframe: daily
- Timeframe: weekly
- Timeframe: 4h
- end of parabolic rally
- sentiment extremes
- catalyst-driven
- Asset: stocks
- Asset: indices
- Asset: crypto
Avoid When
- Timeframe: 1m
- Timeframe: 5m
- gradual trends
- low volatility
Confluence Factors
- Exhaustion gap occurs at a major resistance level
- RSI shows extreme overbought conditions (>80)
- Volume climax on the island candles
- Sentiment indicators at extremes
- Fibonacci extension level at the island
Scale In Strategy
Enter full position on confirmed breakaway gap — island reversals are high-conviction trades.
Scale Out Strategy
Take 33% at TP1, 33% at TP2, trail remaining.
Risk Management
Volume Analysis
Volume Confirmation
Volume must be high on the breakaway gap. Ideally, the breakaway gap volume exceeds the exhaustion gap volume.
Volume Profile
The island area should show a volume concentration that becomes a resistance zone. Gaps on both sides show price rejection.
Volume Divergence
If volume is low on the breakaway gap, the pattern may not hold — wait for additional confirmation.
Technical Confluence
Support Resistance
The island itself becomes a powerful resistance zone. Both gaps act as support/resistance levels.
Fibonacci Levels
The island often forms at a Fibonacci extension level (127.2% or 161.8%) of the prior correction.
Moving Averages
The exhaustion gap often pushes price far above the 20 EMA. The breakaway gap may bring price back to or below it.
Rsi Confirmation
RSI above 80 at the island, then crashing below 50, confirms the reversal.
Macd Confirmation
MACD showing extreme extension at the island followed by a sharp bearish crossover.
Bollinger Bands
Island forming above the upper Bollinger Band confirms extreme extension.
Vwap
Price gapping below VWAP on the breakaway confirms institutional selling.
Ichimoku Cloud
Island above the Kumo cloud, followed by a gap back into or below the cloud, is strongly bearish.
Elliott Wave
Island reversals frequently mark the end of Wave 5 or the termination of a diagonal triangle.
Wyckoff Phase
The island represents the buying climax (BC) phase of distribution. The breakaway gap is the sign of weakness (SOW).
Market Profile
The island creates a low-volume node above and below (the gaps), with a concentration on the island itself — a stranded value area.
Order Flow
Delta flips from positive to strongly negative between the exhaustion and breakaway gaps.
Open Interest
Call open interest peaks at the island level and put open interest surges on the breakaway.
Multi-Timeframe Analysis
Higher Timeframe Alignment
A weekly island reversal is an extremely rare and powerful signal. Daily island reversals are the most common.
Lower Timeframe Entry
Use the 1H chart to identify the breakaway gap in real-time and enter early in the session.
Timeframe Confluence
Island reversal visible on both daily and 4H charts is definitive.
Top-Down Approach
Weekly overbought → Daily island formation → 4H breakaway gap confirmation → Enter short.
Statistics
Historical Examples
Luckin Coffee Island Reversal
successLuckin Coffee formed an island reversal at its peak. Price gapped up to new highs, traded for a few sessions, then gapped down when fraud was exposed. The island perfectly captured the peak.
Lesson: Island reversals driven by fundamental catalysts (fraud, bad earnings) produce the most decisive moves.
Bitcoin Island Reversal at $69K
successBitcoin formed a brief island reversal near $69K. A gap up to the all-time high was followed by a gap down, beginning the descent to $15.5K over the next year.
Lesson: Island reversals in crypto at all-time highs can signal the start of multi-month bear markets.
Variations
Single-Candle Island
Just one candle forms the island, isolated by gaps on both sides.
Multi-Day Island
Several candles (3-10) form the island between the gaps.
Confusion Matrix
Patterns commonly confused with Bearish Island Reversal and how to distinguish them.
Bearish Exhaustion Gap
60% similarCount the gaps: if there are gaps on BOTH sides of the candles, it is an island reversal. If there is only one gap up that reverses, it is an exhaustion gap.
Key Differences
- Island reversal requires TWO gaps (up and down)
- Exhaustion gap only has ONE gap
- Island reversal is significantly more reliable
Bearish Key Reversal
50% similarIsland reversal requires isolation by gaps. A key reversal is a single candle that makes a new high then closes below the prior candle's low — no gap isolation required.
Key Differences
- Key reversal is a single-candle pattern
- Island reversal involves multiple candles separated by gaps
- Island reversal is rarer and more powerful
A falling window is a Japanese candlestick term for a gap down in price where the high of the current candle is below the low of the previous candle, signaling strong bearish continuation momentum.
The inverted V (V-top) is a sharp reversal pattern where a steep rally is immediately followed by an equally sharp decline, creating an inverted V shape on the chart with virtually no consolidation at the top.
The bearish key reversal is a powerful single-bar reversal pattern where price makes a new high then reverses to close below the prior bar's low on high volume, signaling a decisive shift from buying to selling control.
The Bullish Island Reversal is a powerful gap-based reversal pattern where price gaps down to form an isolated cluster, then gaps back up, leaving behind an 'island' of price action that signals a dramatic shift in sentiment.
The bearish gap fill rejection occurs when price rallies to fill a prior gap down but is rejected at or within the gap zone, confirming the gap as resistance and signaling continuation of the downtrend.
The bearish gap momentum pattern occurs when price gaps down on high volume and continues selling throughout the session without filling the gap, indicating powerful one-directional selling pressure.
Pro Tips & Common Mistakes
Pro Tips
- The island reversal is one of the few patterns with enough reliability to justify immediate entry without additional confirmation.
- Both gaps must remain unfilled for the pattern to remain valid. If either gap fills, the signal is weakened.
- A single-candle island (one candle isolated by gaps) is the most powerful variant.
- Volume on the breakaway gap should exceed volume on the exhaustion gap for maximum confidence.
Common Mistakes
- Trading partial island reversals where only one gap is clear.
- Ignoring the volume — low-volume breakaway gaps are less reliable.
- Expecting an island reversal to form in low-volatility markets — they require energetic price action.
- Setting stops too tight within the island zone rather than above the island.
Advanced Techniques
- Use gap analysis to confirm both gaps are genuine: no overlap between adjacent candles' ranges.
- Combine with options flow: massive put buying on the breakaway gap day confirms institutional bearish conviction.
- Monitor the island candles for internal reversal patterns (doji, shooting star) that add confluence.
- Use volume profile to confirm the island is a low-volume node (stranded in price) — this makes reclamation less likely.
Institutional Perspective
Island reversals represent a complete institutional sentiment flip. The exhaustion gap is the last institutional buying (or distribution into buying), and the breakaway gap is aggressive institutional selling. The island itself is where the transfer of ownership occurred.
Fun Facts
- Thomas Bulkowski rates the island reversal as one of the top 5 most reliable chart patterns based on statistical research.
- The island reversal at the 2000 dot-com peak in the NASDAQ was one of the most widely studied examples in technical analysis history.
- Island reversals are more common in stocks than forex because currency markets trade 24 hours and have fewer true gaps.
Frequently Asked Questions
An island reversal is a pattern where price is isolated between two gaps — an exhaustion gap up followed by a breakaway gap down. The candles between the gaps form an 'island' that marks the exact top of the trend.
The island reversal is one of the most reliable patterns, with a win rate of approximately 78%. Its rarity (requires two unfilled gaps) contributes to its high reliability — when both conditions are met, the signal is very strong.
Very rare. The requirement for two gaps that isolate candles limits its occurrence. On daily charts, a trader might see only a few island reversals per year across a universe of stocks.