Overview
Bearish Dark Cloud Cover
Kabuse
Also known as: Dark Cloud Cover, Kabuse Pattern
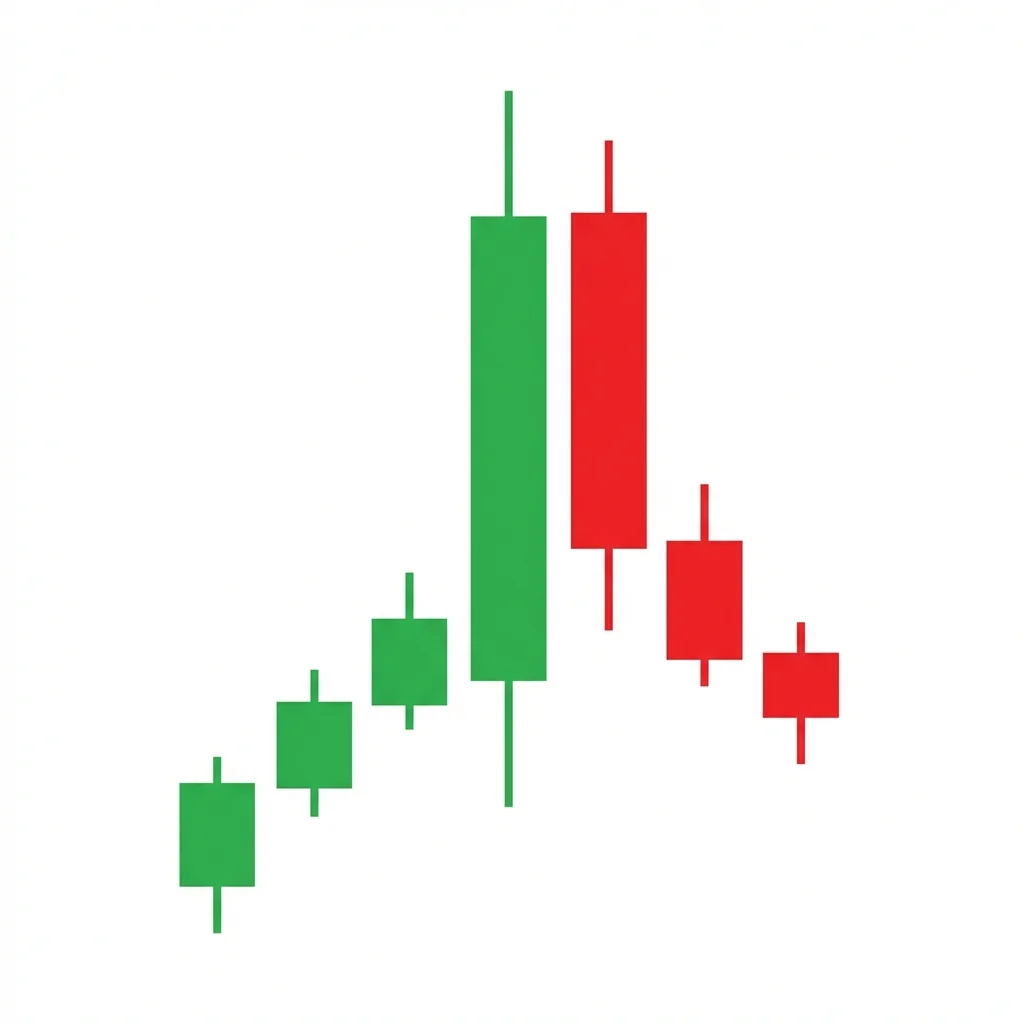
The Dark Cloud Cover is a two-candle bearish reversal pattern where a bearish candle opens above the prior bullish candle's high and closes below its midpoint, signaling that the bullish 'sky' is being covered by a bearish 'dark cloud.'
The Dark Cloud Cover is one of the most widely recognized bearish reversal patterns in candlestick analysis. The first candle is a strong bullish candle that continues the uptrend. The second candle opens above the first candle's high — an even more bullish sign initially — but then reverses sharply during the session, closing below the midpoint of the first candle's body. This penetration of the first candle's body is the critical element: it shows that sellers drove price down far enough to erase more than half of the previous session's gains. The deeper the penetration, the more bearish the signal. A Dark Cloud Cover where the second candle closes near the first candle's open approaches a Bearish Engulfing in power. The pattern is the bearish counterpart of the Piercing Line. In Japanese markets, the minimum penetration is sometimes set at 50%, while Western analysts often accept anything past the midpoint.
History & Etymology
The Dark Cloud Cover has been part of Japanese trading for centuries. The name evokes the image of a dark cloud moving over the sun, dimming what was previously a bright (bullish) sky. Steve Nison introduced the pattern to Western traders in his 1991 book, and it quickly became one of the most popular candlestick patterns due to its visual clarity and intuitive psychology.
The Japanese name 'Kabuse' means 'to cover' or 'to cap,' describing how the bearish second candle caps or covers the bullish first candle. The English name 'Dark Cloud Cover' is more evocative — the bullish uptrend is the clear sky, and the bearish candle is the dark cloud that moves in to cover it, foreshadowing a storm (selloff).
How It Forms
Formation Steps
- 1First candle: a long bullish candle continuing the uptrend
- 2Second candle: a bearish candle that opens above the first candle's high and closes below the midpoint of the first candle's body
Prerequisites
- Established uptrend
- The second candle must open above the first candle's high
- The second candle must close below the midpoint of the first candle's body
- Both candles should have substantial bodies
Confirmation Signals
- Third candle closes below the second candle's close
- Volume increases on the second candle
- Break below the first candle's low
- RSI divergence or downturn
Invalidation Signals
- Price closes above the second candle's open
- Third candle recovers above the midpoint
- Very low volume on both candles
Candle Breakdown
Bullish Candle
A strong bullish candle with a large body continuing the uptrend. Demonstrates that buyers are still in control.
Bulls are confident. The large bullish body attracts more buyers and reinforces the uptrend sentiment.
Dark Cloud Candle
A bearish candle that opens above the first candle's high (gap up) and closes below the midpoint of the first candle's body.
The gap-up open creates a final burst of optimism. But sellers immediately take over, driving price down through the first candle's midpoint. Bulls who were adding to positions on the gap up are now underwater, and those from the first candle are seeing their profits evaporate.
Psychology
The Dark Cloud Cover captures the moment when bullish exuberance turns to bearish reality. The gap-up open is the last hurrah, and the reversal below the midpoint proves that selling pressure is strong enough to overpower even the most bullish opening.
Buyer Perspective
Buyers are thrilled by the gap-up open, seeing it as confirmation of the trend. As price falls throughout the session, their euphoria turns to anxiety. By the close, more than half their previous gains are gone, and those who bought the gap are losing money.
Seller Perspective
Sellers view the gap up as a gift — an opportunity to sell at elevated prices. Their selling pushes price back through the first candle's midpoint, demonstrating that they have the power to overwhelm the bulls even when the market initially favored them.
Smart Money Action
Institutions sell aggressively into the gap-up open, using retail euphoria as exit liquidity. The close below the midpoint signals the beginning of a distribution phase.
Retail Trader Trap
Retail traders see the gap up as a buying signal and enter long. They are immediately trapped as price reverses. The penetration below the midpoint means they are losing money by the close.
Emotional Cycle
Trading Strategy
Aggressive Entry
Short at the close of the second candle once the penetration below the midpoint is confirmed.
Conservative Entry
Short on a break below the second candle's low or the first candle's open on the next session.
The first candle's open (bottom of the first body).
The previous swing low.
2:1 risk-reward projection.
Best Conditions
- Timeframe: daily
- Timeframe: weekly
- Timeframe: 4h
- at resistance
- overbought
- after extended uptrend
- Asset: stocks
- Asset: forex
- Asset: indices
- Asset: crypto
Avoid When
- Timeframe: 1m
- Timeframe: 5m
- strong momentum-driven breakout
Confluence Factors
- Pattern forms at a resistance level
- The deeper the penetration below the midpoint, the stronger
- RSI bearish divergence
- Volume spike on the second candle
- Bollinger Band rejection
Scale In Strategy
Enter 50% at the second candle close, add 50% on break below the first candle's open.
Scale Out Strategy
Take 50% at 1:1 R:R, trail the rest with 10 EMA.
Risk Management
Volume Analysis
Volume Confirmation
Higher volume on the second candle than the first adds conviction. This shows more participants are selling than were buying.
Volume Profile
The ideal pattern has high volume on both candles, with the second candle's volume being slightly higher.
Volume Divergence
Declining volume through the uptrend followed by a volume spike on the Dark Cloud Cover is a powerful combination.
Technical Confluence
Support Resistance
The second candle's high (gap-up open) becomes a strong resistance level.
Fibonacci Levels
The pattern at a Fibonacci extension adds significance. Target the 38.2% and 50% retracement of the prior upswing.
Moving Averages
A Dark Cloud Cover at a moving average resistance (e.g., a previous support level now tested as resistance) is very reliable.
Rsi Confirmation
RSI above 70 with a bearish reversal on the second candle is textbook confirmation.
Macd Confirmation
A bearish MACD crossover or declining histogram confirms the pattern.
Bollinger Bands
The gap-up open above the upper Bollinger Band with the close back inside is a classic Dark Cloud Cover + Bollinger setup.
Vwap
The second candle opening above VWAP and closing below it shows the session was seller-dominated.
Ichimoku Cloud
The pattern above the Kumo with a bearish Tenkan/Kijun cross adds confluence.
Elliott Wave
Common at the end of Wave 5 or the peak of Wave B corrections.
Wyckoff Phase
Aligns with Upthrust (UT) in distribution — the gap up fails and price falls back.
Market Profile
The gap-up open into a low-volume area with immediate rejection shows poor price acceptance.
Order Flow
Heavy passive selling (sell limit orders) absorbing aggressive buying at the gap-up level.
Open Interest
New short positions opening on the second candle (rising OI with declining price) confirm bearish intent.
Multi-Timeframe Analysis
Higher Timeframe Alignment
A daily Dark Cloud Cover at a weekly resistance is high conviction.
Lower Timeframe Entry
After the daily DCC forms, use the 1H chart to find entries on minor bounces for better risk-reward.
Timeframe Confluence
A weekly Dark Cloud Cover is a powerful signal that can set the tone for weeks of price action.
Top-Down Approach
Weekly: identify resistance. Daily: spot the Dark Cloud Cover. 4H: refine entry and stop placement.
Statistics
Historical Examples
Microsoft Dark Cloud Cover at All-Time High
successMSFT formed a textbook Dark Cloud Cover near $345. The second candle gapped above $348 but closed at $337, well below the first candle's midpoint. The stock fell 15% over the following six weeks.
Lesson: Dark Cloud Covers at all-time highs are particularly powerful because there is no overhead resistance to act as a floor — price can fall freely.
GBP/USD Dark Cloud Cover
successGBP/USD formed a Dark Cloud Cover at 1.3140 resistance. The second candle gapped up to 1.3158 but closed at 1.3065, well below the midpoint. The pair dropped 400 pips over the next month.
Lesson: In forex, the Dark Cloud Cover works well at round-number psychological resistance levels.
Variations
Deep Dark Cloud Cover
The second candle closes below the first candle's open, making it nearly an engulfing pattern.
Shallow Dark Cloud Cover
The second candle barely closes below the midpoint.
Confusion Matrix
Patterns commonly confused with Bearish Dark Cloud Cover and how to distinguish them.
Bearish Engulfing
7500% similarIf the second candle's close is below the first candle's open (fully engulfs the body), it is an Engulfing. If it only closes below the midpoint but above the open, it is a Dark Cloud Cover.
Key Differences
- Engulfing's second candle opens above the first's close AND closes below the first's open — fully engulfing
- Dark Cloud Cover's second candle only needs to close below the midpoint, not the open
- Engulfing is a stronger signal
Bearish Counterattack Line
7000% similarThe depth of penetration into the first candle determines the pattern. At the close = Counterattack. Below the midpoint = Dark Cloud Cover. Below the open = Engulfing.
Key Differences
- Counterattack Line closes AT the first candle's close, not below the midpoint
- Dark Cloud Cover penetrates deeper into the first candle's body
- Dark Cloud Cover is stronger
The Bearish Counterattack Line features a bullish candle followed by a bearish candle that gaps up at the open but closes back to the same level as the first candle's close, signaling that sellers 'counterattacked' the bullish advance.
The Bearish Doji Star is a two-candle reversal pattern featuring a strong bullish candle followed by a doji that gaps above it, signaling that buying momentum has stalled and indecision has replaced conviction at the top of an uptrend.
The Bearish Engulfing is one of the most powerful and commonly traded two-candle reversal patterns. A large bearish candle completely engulfs the prior bullish candle, demonstrating a decisive shift from buying to selling dominance.
The shooting star is a single-candle bearish reversal pattern with a small body near the low and a long upper shadow. It shows that buyers pushed price significantly higher during the session but sellers drove it back down, signaling a potential top.
The Piercing Line is a two-candle bullish reversal pattern where a bearish candle is followed by a bullish candle that opens below the low and 'pierces' above the midpoint of the first candle's body, showing strong buying recovery.
The Confirmed Shooting Star adds a bearish confirmation candle to the classic shooting star, eliminating the ambiguity of the standalone pattern and creating a higher-probability reversal signal at the top of uptrends.
Pro Tips & Common Mistakes
Pro Tips
- The deeper the second candle penetrates into the first, the more bearish. A close near the first candle's open approaches an Engulfing in strength.
- The gap up at the open of the second candle is important — it creates the trapped-buyer psychology that drives the reversal.
- In US stocks, the Dark Cloud Cover is more common than in forex because the daily close/open creates natural gaps.
- Use the first candle's midpoint as a decision level. If price retests this level and holds below it, the pattern is working. If price rises above it, the pattern may be failing.
- The Dark Cloud Cover is considered more significant in Japanese markets, where candlestick analysis originated.
Common Mistakes
- Not verifying that the second candle opens above the first candle's high — this gap is required for the pattern.
- Accepting a penetration that does not reach the midpoint as a Dark Cloud Cover — the midpoint penetration is the minimum requirement.
- Setting stops too tight below the gap-up level instead of above the second candle's high.
- Confusing the pattern with a simple bearish candle following a bullish candle (no gap requirement met).
Advanced Techniques
- Calculate the penetration percentage: (first candle close - second candle close) / first candle body length. Penetration above 60-70% is nearly as strong as an engulfing.
- Use the Dark Cloud Cover as a trigger for longer-term options strategies — selling call spreads or buying puts with 30-45 DTE.
- Track the frequency of Dark Cloud Covers across a sector. Multiple DCC patterns simultaneously suggest sector-wide distribution.
Institutional Perspective
Institutional traders view the Dark Cloud Cover as a clear sell signal because the gap-up failure demonstrates that institutional selling overwhelmed even the strongest retail buying. The penetration below the midpoint confirms the selling is aggressive, not just profit-taking.
Fun Facts
- The Dark Cloud Cover is one of the most poetically named candlestick patterns, evoking the image of an ominous storm cloud rolling in over a sunny day.
- In Japanese candlestick tradition, the pattern was used to predict weather-sensitive rice prices — the metaphor of a dark cloud covering the sun was both literal and figurative.
- The Dark Cloud Cover consistently ranks in the top 5 most popular candlestick patterns across all trading education platforms.
Frequently Asked Questions
The second candle must close below the midpoint of the first candle's body. This is the minimum requirement. The deeper the penetration, the stronger the signal. If the second candle closes below the first candle's open, it becomes a Bearish Engulfing pattern.
Strictly, yes — the second candle should open above the first candle's high (or at minimum above its close). This gap is what creates the trapped-buyer psychology. In 24-hour markets like forex, the gap may be minimal, and some analysts accept an open above the close as sufficient.
No. The Bearish Engulfing is generally considered stronger because the second candle closes below the first candle's open (complete engulfment). The Dark Cloud Cover only requires penetration past the midpoint, making it a less decisive signal.