Overview
Bearish Shooting Star
Nagare Boshi
Also known as: Shooting Star, Inverted Hammer Top, Star Reversal
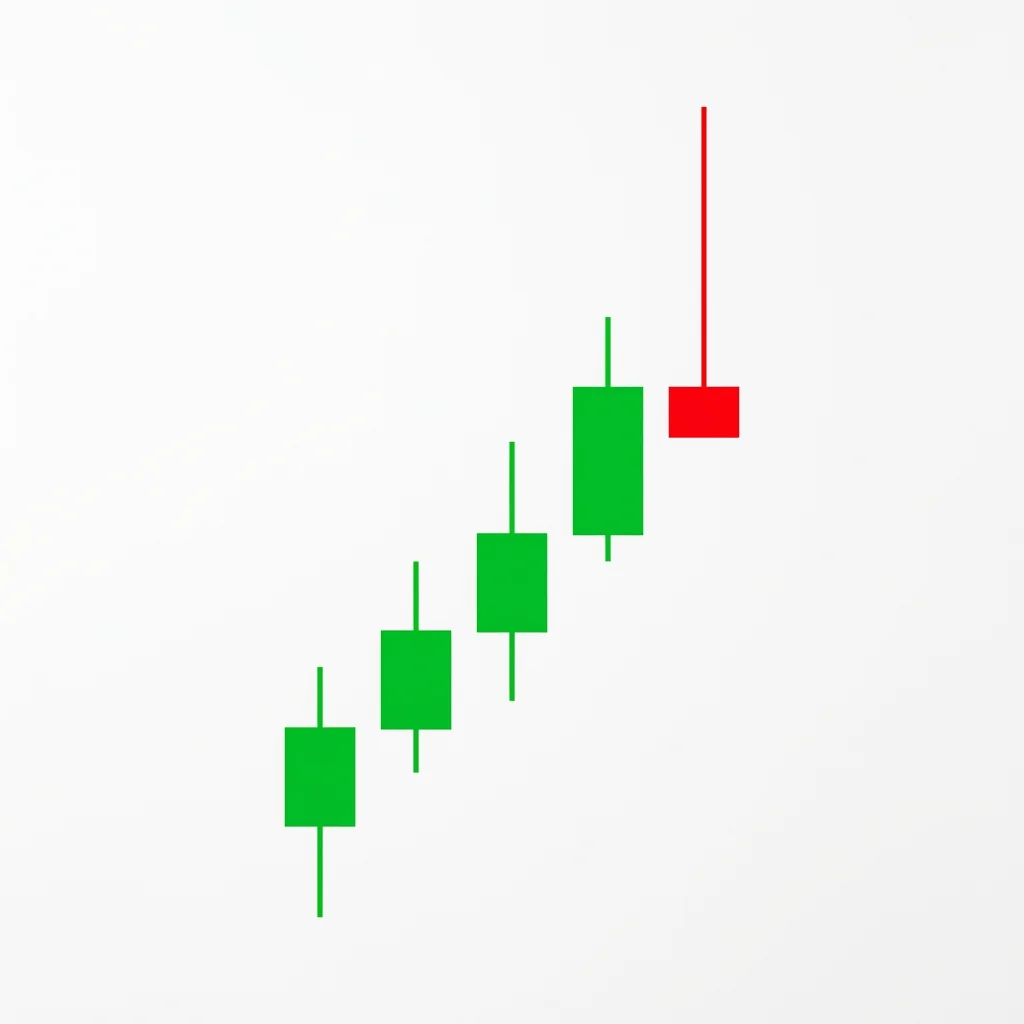
The shooting star is a single-candle bearish reversal pattern with a small body near the low and a long upper shadow. It shows that buyers pushed price significantly higher during the session but sellers drove it back down, signaling a potential top.
The shooting star is one of the most recognized candlestick patterns in technical analysis. It forms at the top of an uptrend when the session opens, rallies significantly (creating the long upper shadow), but then sellers take over and push the price back down to close near the open. The long upper shadow—at least twice the body length—visually represents the rejection of higher prices. The pattern is named for its resemblance to a shooting star falling from the sky. While a single shooting star is a warning signal, it becomes significantly more reliable when confirmed by a bearish candle on the following session. The pattern is especially powerful at resistance levels, round numbers, and when accompanied by high volume and bearish divergence on momentum indicators.
History & Etymology
The shooting star is one of the original Japanese candlestick patterns, dating back to the 18th-century rice trading markets of Japan. It was documented by Munehisa Homma, considered the father of candlestick charting. Steve Nison introduced the pattern to Western audiences in his 1991 book 'Japanese Candlestick Charting Techniques.'
Named 'shooting star' (nagare boshi in Japanese) because the long upper shadow and small body at the bottom resemble a star falling from the sky. The visual metaphor suggests that the bullish move has 'burned out' like a shooting star.
How It Forms
Formation Steps
- 1Small real body near the bottom of the candle's range
- 2Long upper shadow at least twice the length of the real body
- 3Little to no lower shadow
- 4Appears after an uptrend or at resistance
Prerequisites
- Established uptrend or rally into resistance
- The candle should gap up from the prior close (ideal but not required)
Confirmation Signals
- Next candle closes below the shooting star's body
- Volume on the shooting star is above average
- RSI showing overbought conditions
Invalidation Signals
- Price closes above the shooting star's high on the next candle
- Strong bullish follow-through
- Low volume on the shooting star
Candle Breakdown
Shooting Star
A candle with a small real body near the low of the range and a long upper shadow at least twice the body length. Little or no lower shadow.
Buyers pushed price significantly higher but were overwhelmed by sellers who drove price back down. The long upper shadow is the battlefield scar of this failed rally.
Psychology
The shooting star captures a complete shift in intra-session sentiment: initial bullish enthusiasm followed by a bearish takeover. The visual impact of the long upper shadow makes it one of the most psychologically intuitive reversal signals.
Buyer Perspective
Buyers confidently push price higher during the session, but their inability to hold gains creates doubt. The close near the low suggests they were overwhelmed.
Seller Perspective
Sellers patiently wait for the session to push higher before entering aggressively. Their ability to reverse the entire session's gains demonstrates decisive bearish intent.
Smart Money Action
Institutional sellers allow the session to rally (providing exit liquidity from late retail buyers), then sell aggressively into the strength, creating the long upper shadow.
Retail Trader Trap
Retail traders buy the breakout to new highs during the session, only to watch their positions go underwater as the session reverses.
Emotional Cycle
Trading Strategy
Aggressive Entry
Enter short at the close of the shooting star candle.
Conservative Entry
Wait for the next candle to close below the shooting star's low before entering short.
Previous swing low or nearest support level
1.5x the shooting star's total range (shadow + body)
2x the shooting star's total range
Best Conditions
- Timeframe: 1D
- Timeframe: 4h
- Timeframe: 1W
- After extended rallies
- At resistance levels
- Overbought conditions
- Asset: Stocks
- Asset: Forex
- Asset: Indices
- Asset: Crypto
Avoid When
- Timeframe: 1m
- Timeframe: 5m
- Strong momentum uptrends
- Low-volatility environments
Confluence Factors
- Forms at a known resistance level
- RSI above 70 (overbought)
- Bearish divergence on RSI or MACD
- Volume spike on the shooting star
- Appears at a Fibonacci extension level
- Near the upper Bollinger Band
Scale In Strategy
Enter initial position on the shooting star close, add if the confirmation candle continues lower.
Scale Out Strategy
Take 50% at the first support level, trail the rest with the 8 EMA.
Risk Management
Volume Analysis
Volume Confirmation
Above-average volume on the shooting star strengthens the signal, showing genuine selling activity at the highs.
Volume Profile
Volume concentrated in the upper portion of the shadow indicates aggressive selling at the highs.
Volume Divergence
A shooting star on low volume is less reliable—it may be a pause rather than a reversal.
Technical Confluence
Support Resistance
Shooting stars at established resistance levels are significantly more reliable than those at random price points.
Fibonacci Levels
Shooting stars at 127.2% or 161.8% Fibonacci extension levels are high-probability reversal signals.
Moving Averages
A shooting star at the 50 or 200 SMA/EMA resistance adds powerful confluence.
Rsi Confirmation
RSI above 70 combined with a shooting star is one of the most classic overbought reversal setups.
Macd Confirmation
MACD showing bearish divergence while a shooting star forms confirms waning momentum.
Bollinger Bands
A shooting star with the upper shadow piercing the upper Bollinger Band signals overextension.
Vwap
A shooting star forming above VWAP with the close back below confirms intraday reversal.
Ichimoku Cloud
A shooting star at the Kumo cloud resistance adds Ichimoku confirmation.
Elliott Wave
Shooting stars often mark the end of Wave 5 or Wave C in Elliott Wave patterns.
Wyckoff Phase
May appear during the UTAD (Upthrust After Distribution) in Wyckoff distribution.
Market Profile
The long upper shadow represents a failed auction above value—price explored higher and was rejected.
Order Flow
The upper shadow shows aggressive selling absorbing all buy orders at the highs.
Open Interest
Monitor open interest changes for additional confirmation of institutional participation in the move.
Multi-Timeframe Analysis
Higher Timeframe Alignment
A daily shooting star at a weekly resistance level is one of the highest probability setups.
Lower Timeframe Entry
Use the 1H chart to see the intraday reversal pattern within the daily shooting star for a tighter entry.
Timeframe Confluence
A 4H shooting star at daily resistance, confirmed by weekly overbought conditions, is ideal.
Top-Down Approach
Weekly resistance > Daily shooting star > 4H confirmation entry.
Statistics
Historical Examples
Bitcoin Shooting Star at $69,000
successBitcoin formed a weekly shooting star at its all-time high near $69,000. The long upper wick showed rejection of prices above $67,000, and the subsequent crash brought BTC to $15,500.
Lesson: Weekly shooting stars at all-time highs in crypto can signal the beginning of devastating bear markets.
Apple Shooting Star at $180 Resistance
successApple formed a daily shooting star at the $182 level, with the upper wick testing $183. The stock declined to $130 over the next six months.
Lesson: Shooting stars in large-cap stocks at resistance levels can signal multi-month corrections.
Variations
Gapped Shooting Star
A shooting star that gaps up from the prior candle's close, adding extra significance.
High-Wave Shooting Star
A shooting star with an extremely long upper shadow (3x+ the body), showing massive rejection.
Confusion Matrix
Patterns commonly confused with Bearish Shooting Star and how to distinguish them.
Bearish Gravestone Doji
8500% similarIf the open and close are virtually identical (doji), it is a gravestone doji. If there is a small but visible real body, it is a shooting star.
Key Differences
- Gravestone doji has open=close (doji body); shooting star has a small real body
- Gravestone doji has zero or near-zero lower shadow; shooting star may have a small one
- Gravestone doji is slightly more bearish due to the complete reversal to the open
Bearish Hanging Man
4000% similarCheck which shadow is long. Long upper shadow = shooting star. Long lower shadow = hanging man.
Key Differences
- Hanging man has a long LOWER shadow; shooting star has a long UPPER shadow
- They are visual opposites despite both being bearish
- Hanging man opens near the high; shooting star opens near the low
The Bearish Engulfing is one of the most powerful and commonly traded two-candle reversal patterns. A large bearish candle completely engulfs the prior bullish candle, demonstrating a decisive shift from buying to selling dominance.
The gravestone doji is a single-candle reversal pattern with the open, close, and low at the same level and a long upper shadow, resembling a gravestone. It signals that buyers pushed price higher but sellers reclaimed all gains by the close.
The hanging man is a single-candle bearish reversal pattern with a small body at the top and a long lower shadow, appearing at the top of an uptrend. It warns that selling pressure is emerging despite the continued uptrend.
A candle with a long upper shadow (at least 2-3x the body) indicates that price rallied significantly during the session but was rejected, closing near the low. It signals selling pressure and potential reversal at the top of rallies.
The Inverted Hammer is a single-candle bullish reversal pattern appearing at the bottom of downtrends. Its long upper shadow shows buyers attempted to push price higher, hinting that the selling pressure may be ending.
The Bearish Belt Hold is a single bearish candle that opens at its high and closes near its low with a long body, indicating that sellers dominated from the opening bell and controlled price action throughout the session.
Pro Tips & Common Mistakes
Pro Tips
- The longer the upper shadow relative to the body, the stronger the bearish signal.
- A bearish (red/black) shooting star body is slightly more reliable than a bullish (green/white) one.
- Always wait for confirmation—a shooting star alone is a warning, not a trade signal.
- The pattern is exponentially more powerful at confluent resistance levels.
- In fast-moving markets, the shooting star may complete within minutes on lower timeframes—be prepared for quick action.
Common Mistakes
- Trading every shooting star without context—they need to appear after uptrends or at resistance
- Ignoring the need for confirmation—a single candle is not enough
- Setting stop losses too tight—the stop should be above the wick high
- Confusing shooting stars with inverted hammers at the bottom of downtrends
- Trading shooting stars with very short upper shadows (less than 2x the body)
Advanced Techniques
- Combine shooting stars with volume profile: if the upper shadow trades into a low-volume node, the rejection is particularly significant.
- Use the shooting star's high as a 'line in the sand'—if price reclaims this level, the pattern has failed.
- In options trading, the shooting star provides a clear strike price (above the high) for selling call spreads.
- Track the intraday price action within the shooting star on lower timeframes to understand the reversal dynamics.
Institutional Perspective
The shooting star's upper shadow represents price levels where institutional sell orders were waiting. As price rallied into this zone, the large sell orders were triggered, absorbing all buying pressure and reversing the session.
Fun Facts
- The shooting star is one of the most searched candlestick patterns on the internet, rivaling the hammer and doji in popularity.
- In Japanese, 'nagare boshi' literally means 'flowing star,' evoking the image of a meteor falling from the sky.
- Steve Nison, who popularized Japanese candlestick patterns in the West, considers the shooting star one of the most visually intuitive reversal signals.
Frequently Asked Questions
A shooting star is a single-candle bearish reversal pattern characterized by a small body near the low and a long upper shadow at least twice the body length. It appears after an uptrend and signals that sellers rejected higher prices.
Yes. A shooting star is a warning signal that becomes actionable when the next candle confirms the reversal by closing below the shooting star's body or low.
Both have long upper shadows and appear at the top of uptrends. The difference is the body: a shooting star has a small real body, while a gravestone doji has the open and close at the same price (no body).