Overview
Bullish Piercing Line
Kirikomi (切り込み線)
Also known as: Piercing Pattern, Piercing Line Reversal
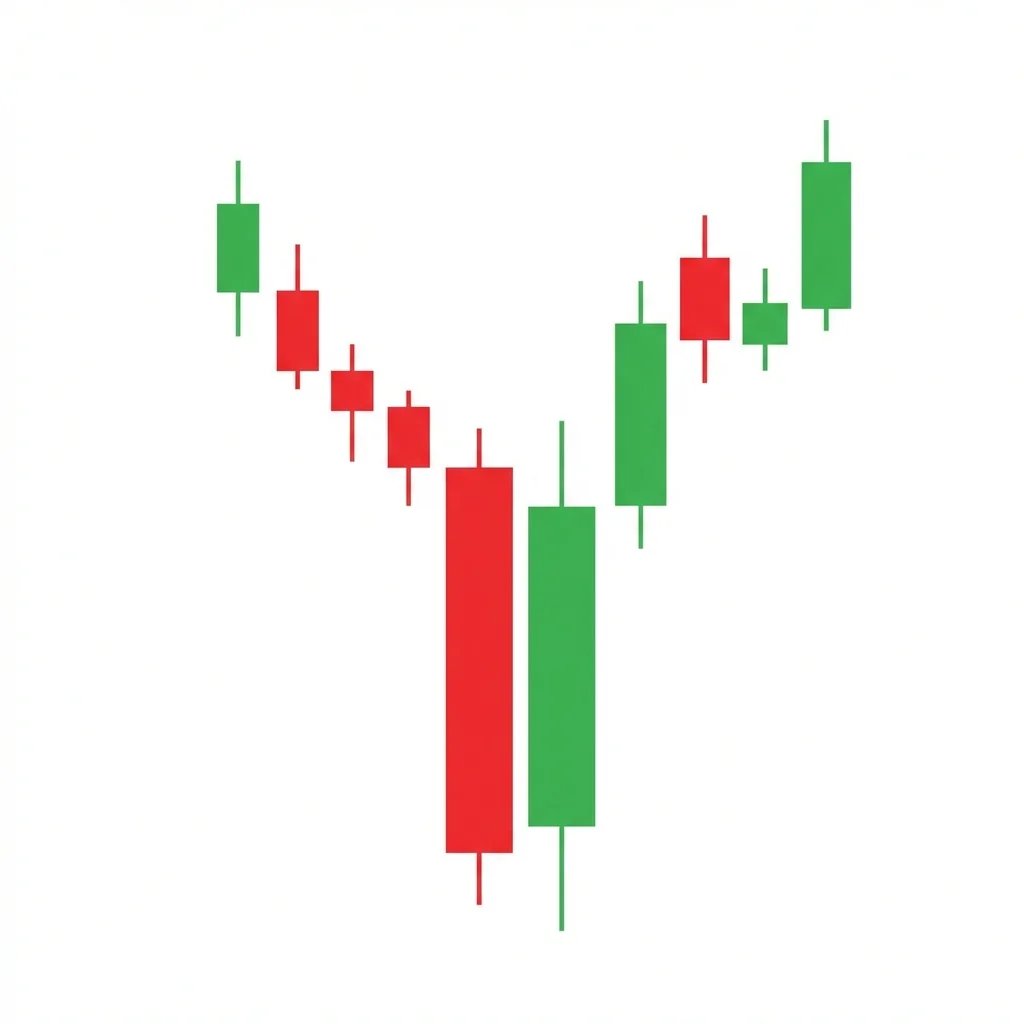
The Piercing Line is a two-candle bullish reversal pattern where a bearish candle is followed by a bullish candle that opens below the low and 'pierces' above the midpoint of the first candle's body, showing strong buying recovery.
The Piercing Line is the bullish counterpart of the Dark Cloud Cover. It appears at the bottom of a downtrend when a large bearish candle is followed by a bullish candle that opens below the bearish candle's low (a gap down, showing initial continued weakness) but then rallies powerfully to close above the midpoint of the bearish candle's body. The 'piercing' refers to the second candle's close penetrating above the midpoint of the first candle. This above-midpoint close is the critical requirement — it shows that buyers were strong enough to recover more than half of the prior session's losses. If the second candle closed above the first candle's open entirely, it would be a bullish engulfing pattern (stronger).
History & Etymology
The Piercing Line is a classical Japanese candlestick pattern described in traditional rice trading texts. It was introduced to Western traders by Steve Nison as one of the fundamental two-candle reversal patterns.
'Piercing' describes how the second candle pierces into the body of the first candle — it cuts through the midpoint like a blade cutting into the prior bearish candle. The Japanese name 'kirikomi' means 'cutting in.'
How It Forms
Formation Steps
- 1First candle: large bearish candle continuing the downtrend
- 2Second candle: bullish candle that opens below the first candle's low (gaps down) and closes above the first candle's midpoint (pierces into the body)
Prerequisites
- Prior downtrend
- Second candle opens below the first candle's low
- Second candle closes above the first candle's midpoint but below its open
Confirmation Signals
- Third candle closes above the second candle's high
- Volume increases on the second candle
- RSI shows oversold conditions
Invalidation Signals
- Third candle closes below the second candle's low
- Price fails to hold above the first candle's midpoint
- No bullish follow-through
Candle Breakdown
Bearish Candle
A large bearish candle continuing the downtrend
Bears are in control, pushing price lower with conviction.
Piercing Candle
A bullish candle opening below the first candle's low and closing above its midpoint
Despite opening even lower (more bearish), buyers mount a powerful recovery that reclaims more than half the prior losses. This is a significant show of strength.
Psychology
The Piercing Line shows that even with a gap down open (maximum bearishness), buyers were strong enough to reverse the session and close above the prior candle's midpoint. This intraday reversal from extreme weakness signals a potential bottom.
Buyer Perspective
Buyers see the gap down as a capitulation opportunity and buy aggressively. Their ability to push price above the midpoint shows genuine demand is present.
Seller Perspective
Sellers who drove the gap down are alarmed by the reversal. The close above the midpoint erodes their confidence in the downtrend's continuation.
Smart Money Action
Institutions buy the gap down, using the weak open as a liquidity event. Their buying drives the recovery above the midpoint.
Retail Trader Trap
Retail bears who added to shorts on the gap down are caught by the reversal. Their stop-loss buying above the midpoint adds to the recovery.
Emotional Cycle
Trading Strategy
Aggressive Entry
Enter at the close of the piercing candle.
Conservative Entry
Wait for a third bullish candle to confirm.
The first candle's open (top of the bearish candle) or 1:1 R:R.
Previous swing high.
2:1 R:R.
Best Conditions
- Timeframe: daily
- Timeframe: 4h
- Timeframe: weekly
- oversold
- at support
- after extended decline
- Asset: stocks
- Asset: forex
- Asset: indices
Avoid When
- Timeframe: 1m
- Timeframe: 5m
- strong bear trend
- macro crisis
- no support nearby
Confluence Factors
- Support level alignment
- RSI oversold
- Moving average support
- Fibonacci retracement level
- Volume confirms
Scale In Strategy
Enter on the piercing candle close, add on the confirmation candle.
Scale Out Strategy
Scale out at each profit target.
Risk Management
Volume Analysis
Volume Confirmation
Higher volume on the second candle than the first confirms buying conviction.
Volume Profile
Heavy volume on the recovery portion of the second candle.
Volume Divergence
Low volume on the second candle reduces the pattern's significance.
Technical Confluence
Support Resistance
Most effective at known support levels where the gap down represents a final test.
Fibonacci Levels
Piercing line at 50% or 61.8% retracement adds confluence.
Moving Averages
Pattern near the 50 or 200-day MA increases reliability.
Rsi Confirmation
RSI oversold with the second candle showing a bullish reversal in RSI.
Macd Confirmation
MACD histogram turning positive on the second candle.
Bollinger Bands
Gap below the lower band with recovery back inside.
Vwap
Gap below VWAP with the close reclaiming it.
Ichimoku Cloud
Piercing at cloud support.
Elliott Wave
Can mark the end of Wave 5 or Wave C.
Wyckoff Phase
The gap down can represent the spring, and the piercing recovery is the test.
Market Profile
Gap into a low-volume zone with recovery back into value.
Order Flow
Buy absorption on the gap-down open followed by aggressive buying.
Open Interest
Declining OI on the second candle may indicate short covering.
Multi-Timeframe Analysis
Higher Timeframe Alignment
A daily piercing line at weekly support is a strong setup.
Lower Timeframe Entry
Use 4H for confirmation entry after the daily piercing line.
Timeframe Confluence
The first candle's midpoint visible on multiple timeframes strengthens the level.
Top-Down Approach
Identify weekly support, spot daily piercing line, enter on 4H confirmation.
Statistics
Historical Examples
JPMorgan Piercing Line at Support
successJPMorgan formed a piercing line at $108 support. The gap-down open was bought aggressively, and the stock rallied 12% over the next month.
Lesson: Piercing lines in large-cap financials at key support levels are reliable reversal signals.
GBP/USD Piercing at 1.0350
successGBP/USD formed a piercing line near the all-time low at 1.0350. The pattern preceded a 15% rally.
Lesson: Piercing lines at extreme price levels with fundamental capitulation can mark major bottoms.
Variations
Deep Piercing
The second candle closes above the 75% level of the first candle's body.
On-Neck / In-Neck
The second candle closes at or near the first candle's close (below midpoint).
Confusion Matrix
Patterns commonly confused with Bullish Piercing Line and how to distinguish them.
Bullish Engulfing
8000% similarCheck where the second candle closes relative to the first candle's body. Above the open = engulfing. Above the midpoint but below the open = piercing line.
Key Differences
- Engulfing has second candle closing ABOVE first candle's open
- Piercing Line closes above the MIDPOINT but below the open
Bearish Dark Cloud Cover
9500% similarThey are mirror images. Piercing Line appears in downtrends; Dark Cloud Cover appears in uptrends.
Key Differences
- Dark Cloud Cover is bearish (at tops)
- Piercing Line is bullish (at bottoms)
The Dark Cloud Cover is a two-candle bearish reversal pattern where a bearish candle opens above the prior bullish candle's high and closes below its midpoint, signaling that the bullish 'sky' is being covered by a bearish 'dark cloud.'
The Bullish Counterattack Line is a two-candle reversal where a gap-down bullish candle rallies to close at exactly the same level as the previous bearish candle close, showing that buyers have matched sellers point for point.
The Bullish Engulfing is one of the most popular and reliable two-candle reversal patterns. A large bullish candle completely engulfs the prior bearish candle body, signaling a decisive shift from selling to buying control.
The Morning Star is a three-candle bullish reversal pattern consisting of a large bearish candle, a small star candle showing indecision, and a large bullish candle confirming the reversal. It is one of the most widely recognized and reliable bottom reversal signals.
The Confirmed Shooting Star adds a bearish confirmation candle to the classic shooting star, eliminating the ambiguity of the standalone pattern and creating a higher-probability reversal signal at the top of uptrends.
The Bearish Counterattack Line features a bullish candle followed by a bearish candle that gaps up at the open but closes back to the same level as the first candle's close, signaling that sellers 'counterattacked' the bullish advance.
Pro Tips & Common Mistakes
Pro Tips
- The second candle MUST close above the first candle's midpoint — this is the defining rule
- The deeper the second candle pierces into the first (closer to the open), the more bullish the signal
- If the second candle closes above the first candle's open entirely, it becomes a bullish engulfing (stronger)
- The gap down on the open of the second candle is important — it shows the final bearish push before the reversal
- Combine with RSI oversold conditions for significantly better win rates
Common Mistakes
- Accepting a second candle that only closes above the first candle's close (not the midpoint)
- Not requiring the gap-down open below the first candle's low
- Confusing with a bullish engulfing when the close exceeds the first candle's open
- Entering without waiting for confirmation in uncertain markets
- Placing stops too tight below the second candle's body instead of below its low
Advanced Techniques
- Quantify the 'pierce' — deeper piercing (>75% into the first candle) approaches engulfing quality
- Combine with the dark cloud cover to create a two-directional system at support/resistance
- Use the first candle's midpoint as a support level for pullback entries after the pattern
- Apply the pattern as a filter at Fibonacci retracement levels for multi-factor analysis
Institutional Perspective
The piercing line's gap-down open is often where institutional buying programs activate. The recovery above the midpoint signals that their orders were large enough to absorb all selling and drive price significantly higher.
Fun Facts
- The Japanese name 'kirikomi' means 'cutting in' — visualizing the second candle cutting into the first like a blade.
- The Piercing Line is the bullish twin of the Dark Cloud Cover — same structure, opposite direction.
- Some studies show the deeper the pierce (closer to engulfing), the higher the success rate, creating a continuum from piercing line to engulfing.
Frequently Asked Questions
A two-candle bullish reversal where a bearish candle is followed by a bullish candle that opens below the prior low and closes above the prior candle's midpoint.
The Piercing Line closes above the midpoint but BELOW the first candle's open. If it closes above the open, it becomes a Bullish Engulfing (stronger pattern).
The midpoint represents the balance point of the bearish candle. Closing above it means buyers recovered more than half the losses — a psychologically significant threshold.