Overview
Bearish Dead Cat Bounce
Also known as: Dead Cat Bounce, DCB, Relief Rally, Sucker Rally
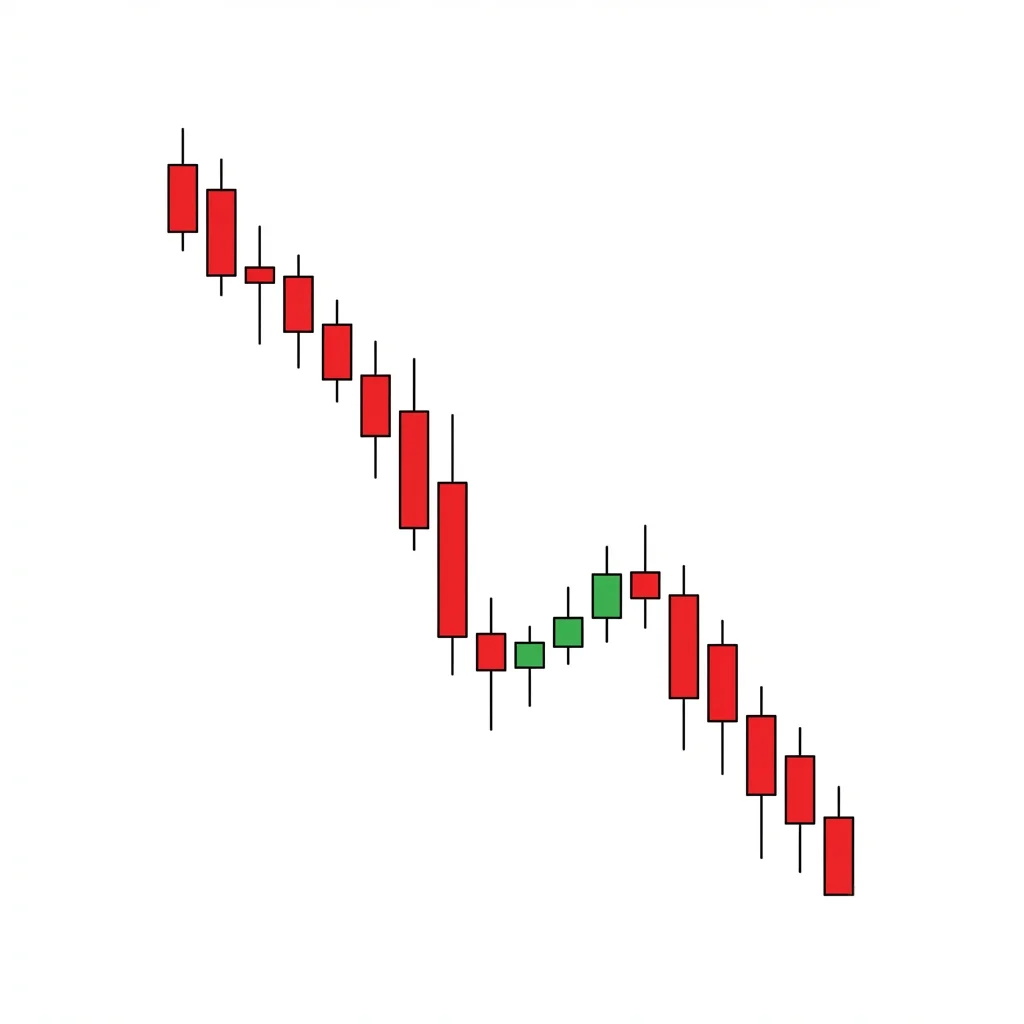
The Dead Cat Bounce is a brief, unsustainable rally in the midst of a larger decline. Named for the morbid Wall Street adage that 'even a dead cat will bounce if dropped from a great height,' the pattern traps buyers who mistake the bounce for a bottom.
The Dead Cat Bounce is one of the most well-known patterns in trading. It occurs when a stock (or any asset) experiences a sharp decline, then briefly rallies before resuming its downtrend to make new lows. The rally is not driven by genuine buying interest or improving fundamentals — it is caused by short covering, bargain hunting, and oversold conditions creating a temporary bounce. The key characteristic is that the bounce lacks conviction (low volume, weak candles) and fails to recover a meaningful portion of the decline. Traders who buy the bounce thinking 'it cannot go lower' are trapped when selling resumes. The pattern is particularly dangerous because the initial bounce can feel convincing — it may last several days or even weeks — but ultimately fails. The Dead Cat Bounce is a continuation pattern within a larger downtrend.
History & Etymology
The term 'dead cat bounce' originated on Wall Street, likely in the 1980s, from the colorful (if grim) observation that 'even a dead cat will bounce if it falls from a great height.' The earliest known print usage was in the Financial Times in 1985 describing the Singapore and Malaysian stock markets. The pattern has been observed at every major market crash, from the 1929 Great Depression to the 2008 financial crisis to the 2022 crypto winter.
The metaphor compares a falling stock price to a dead cat dropped from a height. The cat (stock price) bounces off the ground, but this does not mean it is alive (recovering) — it is simply physics. The bounce does not indicate life (bullish reversal); it is merely a mechanical response to the sharp fall.
How It Forms
Formation Steps
- 1Sharp initial decline (crash phase): price drops significantly on heavy volume
- 2Brief relief rally: price bounces 10-30% of the decline on declining volume
- 3Rally failure: the bounce stalls and price begins declining again
- 4Continuation: price breaks below the initial low and continues its downtrend
Prerequisites
- A significant sharp decline (typically 10%+ in stocks, more in crypto)
- The decline is driven by fundamental deterioration, not just technical correction
- The relief rally lacks volume conviction
- The rally fails to recover more than 50% of the initial decline (typically 20-40%)
Confirmation Signals
- Volume declines during the bounce and increases when selling resumes
- The bounce fails at a resistance level (50 MA, Fibonacci level, gap fill)
- Bearish candle patterns appear at the top of the bounce
- Price breaks below the initial low from the crash
Invalidation Signals
- The bounce recovers more than 61.8% of the decline on increasing volume
- Price forms higher lows and higher highs after the bounce
- Fundamental catalysts improve, supporting a genuine recovery
Candle Breakdown
Crash Phase
Multiple large bearish candles, often with gaps down, representing the initial sharp decline. Volume is extremely high.
Panic selling. Bad news drives capitulation. Every bounce attempt fails quickly. The decline feels relentless.
Bounce Phase
A series of bullish candles with progressively smaller bodies and declining volume. The rally is unconvincing.
Short covering triggers the initial bounce. Bargain hunters enter. Media declares 'the bottom is in.' Hope temporarily replaces fear, but the low volume betrays the lack of real conviction.
Failure Point
The rally stalls at a technical resistance level. Bearish candle patterns emerge. Volume picks up on the sell side.
Reality sets in. The fundamental problems that caused the decline have not been resolved. Selling resumes, and bounce buyers realize they bought too early.
Continuation Decline
Price breaks below the initial crash low, confirming the Dead Cat Bounce. New lows are made.
Capitulation of bounce buyers. Those who thought they 'bought the dip' are now deeply underwater and sell in panic. The original downtrend reasserts itself with force.
Psychology
The Dead Cat Bounce exploits the human desire to believe that a sharp decline is 'enough' and that prices must recover. This hope-driven buying creates a temporary rally that ultimately traps optimistic buyers and provides better exit prices for informed sellers.
Buyer Perspective
Buyers see the sharp decline as a buying opportunity. They enter during the bounce with conviction that the worst is over. As the rally stalls and reverses, they hold, then hope, then capitulate at even lower prices.
Seller Perspective
Smart sellers use the bounce to exit remaining long positions or add to shorts at better prices. They recognize that the fundamental drivers of the decline are unchanged, and the low-volume bounce signals a lack of genuine demand.
Smart Money Action
Institutional investors use the Dead Cat Bounce to reduce remaining long exposure or establish short positions. The bounce provides the liquidity they need to sell at better prices than the crash lows.
Retail Trader Trap
Retail traders are the primary victims of the Dead Cat Bounce. They see the sharp decline as a 'discount' and buy aggressively, often averaging down as the bounce fails. Financial media amplifies this by calling the bottom prematurely.
Emotional Cycle
Trading Strategy
Aggressive Entry
Short at the top of the bounce when bearish reversal signals appear (shooting star, engulfing, etc.) at resistance.
Conservative Entry
Wait for the price to break below the initial crash low, confirming the DCB.
The initial crash low (if entering from the bounce top).
The crash low minus the height of the bounce.
A measured move equal to the initial crash, projected from the DCB high.
Best Conditions
- Timeframe: daily
- Timeframe: weekly
- Timeframe: 4h
- bear market
- after earnings disappointment
- after fundamental shock
- crypto winter
- Asset: stocks
- Asset: crypto
- Asset: commodities
Avoid When
- Timeframe: 1m
- Timeframe: 5m
- temporary dip in a bull market
- after a one-time event that is resolved
Confluence Factors
- Fundamental deterioration is ongoing (earnings revisions down, guidance cuts)
- Volume declines during the bounce
- The bounce stalls at a known resistance level (50 MA, Fibonacci, gap)
- Market breadth does not improve during the bounce
- Options put/call ratio does not reset to normal during the bounce
Scale In Strategy
Short 33% at the bounce top, add 33% on break of the bounce midpoint, add 34% on break of the crash low.
Scale Out Strategy
Take 33% at crash low, 33% at measured move target, trail 34%.
Risk Management
Volume Analysis
Volume Confirmation
The bounce must have lower volume than the crash. If the bounce has equal or higher volume, it may be a genuine reversal.
Volume Profile
Crash: massive volume. Bounce: declining volume. Failure/continuation: rising volume. This is the DCB volume signature.
Volume Divergence
Price rising on declining volume during the bounce is the quintessential DCB divergence.
Technical Confluence
Support Resistance
The DCB bounce typically stalls at a prior support level that has become resistance (support-turned-resistance). The 50 MA is a common failure point.
Fibonacci Levels
The bounce commonly retraces 23.6% to 38.2% of the decline. A bounce to the 50% retracement that fails is still a DCB. Beyond 61.8%, consider that it may be a genuine reversal.
Moving Averages
The 20 EMA or 50 SMA often acts as the ceiling for the DCB bounce. Watch for rejection at these levels.
Rsi Confirmation
RSI may bounce from oversold (below 30) but fail to reach 50. An RSI that stalls below 50 during the bounce confirms lack of momentum.
Macd Confirmation
MACD may show a bullish crossover during the bounce but remains below the zero line. A bearish re-cross below zero confirms the DCB.
Bollinger Bands
The crash pushed price below the lower band. The bounce to the middle band (20 MA) that fails is a classic DCB Bollinger setup.
Vwap
The bounce failing at the anchored VWAP from the pre-crash high confirms that the average buyer since the crash is still losing money.
Ichimoku Cloud
The bounce failing at the Kijun-sen or at the lower boundary of the Kumo cloud confirms the downtrend continuation.
Elliott Wave
The DCB often represents Wave 2 or Wave 4 in an impulsive decline, or Wave B in a corrective structure.
Wyckoff Phase
The DCB can be the Automatic Rally (AR) in Wyckoff distribution, or a rally to the Last Point of Supply (LPSY) before markup begins.
Market Profile
The bounce failing at the Point of Control (POC) of the pre-crash distribution area confirms the DCB.
Order Flow
Watch for heavy passive selling (large limit sell orders) absorbing the bounce buying. The time and sales will show large prints on the ask during the rally.
Open Interest
In futures, declining open interest during the bounce (short covering) followed by rising OI on the decline (new shorts) confirms the DCB.
Multi-Timeframe Analysis
Higher Timeframe Alignment
A daily DCB during a weekly downtrend is very reliable. The weekly chart shows the larger bearish context.
Lower Timeframe Entry
Use the 1H chart to identify the exact failure point of the bounce for precise short entry.
Timeframe Confluence
A weekly DCB (bounce lasting multiple weeks) is a major bearish signal that can lead to months of decline.
Top-Down Approach
Monthly: bear trend. Weekly: DCB bounce occurring. Daily: identify the failure point. 4H: enter the short.
Statistics
Historical Examples
Lehman Brothers Dead Cat Bounce 2008
successLehman Brothers fell from $65 to $20 during the initial Bear Stearns crisis. A relief rally took it back to $40 (classic DCB retracing ~30% of the decline). The stock then resumed its decline to zero by September 2008.
Lesson: When the fundamental problem is severe (in this case, toxic mortgage assets), no bounce is sustainable. The DCB gave informed investors a final exit opportunity.
Bitcoin Dead Cat Bounce 2022
successBitcoin crashed from $31,000 to $17,600 during the LUNA/3AC crisis. It bounced to $24,500 (about 50% retracement on declining volume) before resuming its decline to $15,500 by November.
Lesson: Crypto DCBs can retrace up to 50% and still fail. Volume analysis was the key differentiator — the bounce had one-third the volume of the crash.
SPY COVID Bounce Turned Real Recovery
failureSPY crashed 35% in March 2020. What initially appeared to be a DCB actually became a V-shaped recovery. The massive fiscal and monetary stimulus changed the fundamental picture.
Lesson: Not every bounce after a crash is a DCB. If fundamentals change dramatically (trillions in stimulus), the bounce can become a genuine recovery. Always monitor the fundamental backdrop.
Variations
Multi-Bounce Dead Cat
Price makes several progressively lower bounces, creating a staircase decline with multiple DCBs.
Quick Dead Cat Bounce
The bounce lasts only 1-3 bars before price resumes its decline.
Confusion Matrix
Patterns commonly confused with Bearish Dead Cat Bounce and how to distinguish them.
Bullish Double Bottom
5000% similarWait for the second test of the low. If it holds and price rallies above the bounce high, it is a Double Bottom. If it breaks, it is a DCB.
Key Differences
- A Double Bottom has two lows at similar levels with a successful rally between them
- A DCB fails to hold above the first low and makes new lows
- Volume patterns differ — Double Bottom shows accumulation; DCB shows distribution
Bearish Bull Trap
6000% similarContext is key. A Bull Trap occurs when price breaks a level and fails. A DCB occurs after a sharp decline when a bounce fails.
Key Differences
- Bull Trap involves a breakout above resistance that fails
- DCB is a bounce within a downtrend that fails
- Bull Trap occurs at tops; DCB occurs after crashes
A Bull Trap is a false breakout above resistance that lures buyers in before immediately reversing, trapping them at elevated prices and triggering a sharp sell-off as trapped longs are forced to exit.
The Descending Triangle is a bearish continuation pattern featuring a flat support level with lower highs converging into an apex, typically resolving with a breakdown below the horizontal support as sellers gradually overwhelm buyers.
The Distribution phase is a Wyckoff concept where institutional investors systematically sell (distribute) their holdings to the public within a trading range at a market top, before the subsequent markdown (decline) begins.
The last kiss occurs when price breaks below support, rallies back to 'kiss' the broken level from below, and is rejected. The old support now acts as resistance, confirming the breakdown and offering an optimal short entry.
Bearish lower highs is a fundamental trend structure pattern where each successive swing high forms at a lower level, confirming bearish momentum and a downtrend. It is the most basic and important bearish market structure signal.
The bearish hikkake is a trap pattern where an inside bar is followed by a false upside breakout that quickly reverses, trapping buyers and triggering a selloff below the inside bar's low.
Pro Tips & Common Mistakes
Pro Tips
- The most reliable way to distinguish a DCB from a genuine recovery is volume. True recoveries have increasing volume on the bounce; DCBs have declining volume.
- Monitor the fundamental story. If the catalyst for the decline is still in play (earnings miss, bankruptcy risk, regulatory action), the bounce is likely a DCB.
- The bounce commonly retraces 23.6% to 38.2% of the decline. If it exceeds 50%, be more cautious about calling it a DCB.
- The best short entry is when the bounce stalls at a technical level (20 or 50 MA, Fibonacci retracement, gap fill) with a bearish reversal candle.
- Dead Cat Bounces are NOT the same as normal pullbacks in a downtrend. The key is the sharp, emotional initial decline followed by a relief rally.
Common Mistakes
- Buying the dip too early — 'it cannot go lower' is the mantra of DCB victims.
- Averaging down on a losing position during a DCB, compounding losses.
- Confusing short covering with genuine buying. Check volume and order flow.
- Assuming every sharp decline produces a DCB. V-shaped recoveries do happen, especially with policy changes.
- Using too tight a stop when shorting the bounce — DCBs can be volatile and whipsaw before failing.
Advanced Techniques
- Buy puts during the bounce when implied volatility (IV) has deflated from the crash peak. The IV crush during the bounce makes options cheaper for the next leg down.
- Use the put/call ratio as a DCB indicator. If the ratio normalizes too quickly during the bounce (complacency), the market is ripe for another decline.
- Monitor credit default swap (CDS) spreads for individual stocks. If CDS spreads remain elevated during the bounce, the credit market is not buying the recovery narrative.
- Use the bounce to sell credit spreads (bear call spreads) on stocks you expect to resume their decline.
Institutional Perspective
Institutional investors are often the catalysts for DCB bounces. After a sharp decline, they need to sell remaining positions but cannot do so during a crash without extreme slippage. They wait for the bounce, then use the improved liquidity to distribute. This institutional selling is the primary reason bounces fail.
Fun Facts
- The term 'Dead Cat Bounce' first appeared in print in the Financial Times in December 1985, describing the Singapore and Malaysian stock markets.
- During the 2008 financial crisis, the S&P 500 experienced at least six identifiable Dead Cat Bounces before finally bottoming in March 2009.
- The cryptocurrency market has a particularly high frequency of Dead Cat Bounces due to its retail-heavy trading base and 24/7 trading, which allows panic and relief to cycle faster.
Frequently Asked Questions
Three key differences: (1) Volume — DCBs have declining volume on the bounce; genuine recoveries have increasing volume. (2) Fundamentals — DCBs occur when the underlying problem is unresolved; genuine recoveries are supported by improving fundamentals. (3) Retracement depth — DCBs typically retrace less than 50% of the decline; genuine recoveries often exceed 61.8%.
Most DCBs retrace 23.6% to 38.2% of the initial decline, though some can reach 50%. The average is about 30%. The bounce commonly stalls at a technical level like the 20 or 50-day moving average or a Fibonacci retracement level.
Both approaches have merit. Shorting at the bounce top (aggressive) offers better prices but risks being early. Waiting for the breakdown below the crash low (conservative) has higher confirmation but worse prices. A scaled entry — short some at the top, more on the breakdown — balances both.
The phrase comes from the Wall Street saying 'even a dead cat will bounce if it falls from a great height.' The metaphor suggests that a brief bounce after a sharp decline does not indicate the asset is alive (recovering) — it is merely the mechanical response to an extreme drop.