Overview
Bearish Inverted V
Also known as: V-Top, Spike Top, Inverted V Reversal, Blow-Off Top
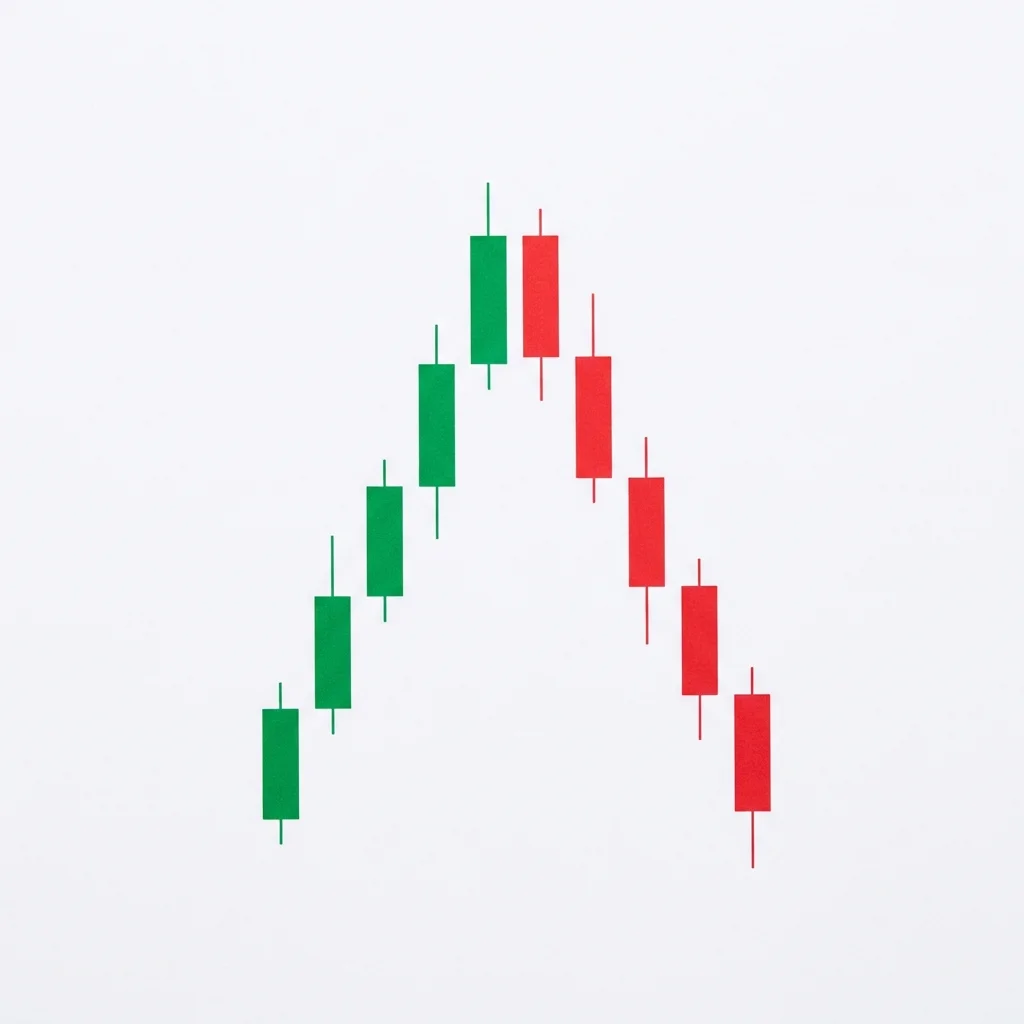
The inverted V (V-top) is a sharp reversal pattern where a steep rally is immediately followed by an equally sharp decline, creating an inverted V shape on the chart with virtually no consolidation at the top.
The inverted V is one of the most aggressive reversal patterns. Unlike head and shoulders or double tops, which give traders time to recognize the reversal, the inverted V turns on a dime. A steep, parabolic rally reaches a climax point and immediately reverses with equal or greater force. There is no consolidation, no shoulder, no retest — just a sharp reversal. This pattern often occurs in speculative blow-offs, short squeezes that fail, or after parabolic moves driven by extreme sentiment. The challenge is that by the time you recognize the pattern, much of the decline has already occurred.
History & Etymology
V-top patterns have been observed throughout market history, often at the peaks of speculative manias. The 1929 stock market peak, the 1980 silver parabolic top, and numerous crypto blow-offs have exhibited inverted V characteristics. The pattern was formally categorized by chart pattern researchers in the mid-20th century.
Named for its visual appearance — when flipped upside down, the pattern looks like the letter V. The sharp peak and symmetric sides create the inverted V shape. Also called a 'spike top' due to the pointed nature of the reversal.
How It Forms
Formation Steps
- 1Sharp, steep rally forming the left side of the V
- 2A sudden peak or climax point
- 3Equally sharp decline forming the right side of the inverted V
- 4The decline mirrors the rally's angle and speed
Prerequisites
- Strong bullish momentum into the peak
- Often accompanied by a catalyst or climax event
Confirmation Signals
- Price breaks below the midpoint of the rally leg
- Volume spikes at the peak (climax volume)
- Momentum indicators show extreme overbought followed by rapid decline
Invalidation Signals
- Price consolidates at the peak rather than reversing sharply
- The decline is much shallower than the rally
- Price reclaims the peak level
Candle Breakdown
Rally Candles
Strong bullish candles with large bodies, forming the left side of the inverted V. Momentum is extreme.
Euphoric buying. FOMO at its peak. Each candle reinforces the belief that the rally will continue.
Climax Candle
The peak candle, often with a long upper shadow or a bearish reversal (shooting star, gravestone doji). Volume is typically at its highest here.
The exact moment where buying exhaustion meets aggressive selling. Euphoria turns to fear in a single candle.
Decline Candles
Strong bearish candles mirroring the rally's intensity, forming the right side of the inverted V.
Panic selling. Trapped longs liquidate simultaneously. The symmetry with the rally creates a mirror-image decline.
Psychology
The inverted V captures the transition from extreme greed to extreme fear with virtually no transition period. The market goes from parabolic euphoria to panicked selling in a single session or even a single candle.
Buyer Perspective
Buyers are in a state of euphoria during the rally, convinced the move will continue indefinitely. The sudden reversal causes immediate, deep losses that trigger panic selling.
Seller Perspective
Smart sellers recognize the parabolic nature of the rally as unsustainable. They sell at the climax, and the mass exit creates the sharp decline that mirrors the rally.
Smart Money Action
Institutions sell into the euphoric buying, using the extreme demand as liquidity to exit large positions. The climax candle often shows their final distribution.
Retail Trader Trap
Retail traders pile in during the parabolic phase, buying the top. The sharp reversal gives them no time to react, resulting in severe losses.
Emotional Cycle
Trading Strategy
Aggressive Entry
Short on the climax candle if it shows a clear reversal signal (shooting star, gravestone doji) with extreme volume.
Conservative Entry
Wait for price to break below the midpoint of the rally, confirming the inverted V is forming.
100% retracement of the rally (back to where the parabolic move started).
Below the rally's origin by the height of the rally.
Major support level below the rally's origin.
Best Conditions
- Timeframe: daily
- Timeframe: 4h
- Timeframe: 1h
- parabolic rallies
- short squeeze collapses
- speculative manias
- Asset: crypto
- Asset: meme stocks
- Asset: commodities
- Asset: small caps
Avoid When
- Timeframe: weekly
- Timeframe: monthly
- steady trending
- low volatility
Confluence Factors
- Parabolic rally angle exceeding 60 degrees
- RSI above 80-90 at the peak
- Volume climax at the peak
- Media attention and euphoric sentiment
- Divergence between price and momentum indicators
Scale In Strategy
Enter 33% on climax reversal, 33% on break of 25% retracement, 33% on break of 50% retracement.
Scale Out Strategy
Take 33% at 50% retracement, 33% at 100% retracement, trail remaining.
Risk Management
Volume Analysis
Volume Confirmation
Climax volume at the peak is essential. Volume should be the highest of the entire rally on the reversal candle.
Volume Profile
Volume at the peak creates a high-volume node that becomes strong resistance on any retest attempt.
Volume Divergence
If volume at the peak is not significantly elevated, the reversal may be temporary rather than a V-top.
Technical Confluence
Support Resistance
The peak becomes extreme resistance. The rally's origin becomes the primary target and potential support.
Fibonacci Levels
The decline often retraces 100% or more of the rally. The 78.6% and 100% levels are key targets.
Moving Averages
Price often crashes through multiple moving averages simultaneously. The 200 SMA often acts as a magnet for the decline.
Rsi Confirmation
RSI above 80-90 at the peak, then crashing below 30. The speed of the RSI decline confirms the reversal.
Macd Confirmation
MACD showing extreme extension at the peak followed by a sharp bearish crossover.
Bollinger Bands
Price shooting above the upper Bollinger Band and then crashing below the middle band within a few sessions.
Vwap
Price rapidly moving from above VWAP to below VWAP confirms the intraday reversal.
Ichimoku Cloud
Price crashing from above the Kumo cloud to below it in rapid succession.
Elliott Wave
The inverted V often marks the end of an extended Wave 5 or a diagonal triangle's final thrust.
Wyckoff Phase
The climax point represents the buying climax (BC) in distribution, followed by the automatic reaction (AR).
Market Profile
The peak creates a thin, single-print excess that forms resistance. The rapid decline fills the single-print areas below.
Order Flow
Delta flips from extreme positive to extreme negative within 1-2 candles. Aggressive selling replaces aggressive buying.
Open Interest
Call open interest collapses and put open interest surges at the peak — a clear sign of the sentiment flip.
Multi-Timeframe Analysis
Higher Timeframe Alignment
Inverted V's on the weekly chart can mark secular trend changes. On the daily chart, they are more common during speculative episodes.
Lower Timeframe Entry
Use the 1H chart to identify the peak candle in real-time and time entries after the initial reversal.
Timeframe Confluence
If the inverted V is visible on both the daily and 4H charts, the reversal is confirmed.
Top-Down Approach
Weekly overbought → Daily parabolic rally → 4H climax candle → 1H short entry on first pullback.
Statistics
Historical Examples
GameStop Inverted V 2021
successGameStop rallied from $20 to $483 in a parabolic short squeeze, then reversed to $40 in equally sharp fashion, creating a near-perfect inverted V.
Lesson: Short squeezes that go parabolic almost always form inverted V tops. The decline is as fast as the rally.
Bitcoin Inverted V April 2021
successBitcoin rallied to $65K on the Coinbase IPO hype and reversed sharply, declining to $30K in the following weeks. The inverted V was nearly symmetric.
Lesson: Media hype events often mark the peak of inverted V formations in speculative assets.
Variations
Symmetric Inverted V
The decline mirrors the rally almost exactly in time and magnitude.
Asymmetric Inverted V
The decline is faster and steeper than the rally.
Confusion Matrix
Patterns commonly confused with Bearish Inverted V and how to distinguish them.
Bearish Climax Reversal
85% similarIf the entire formation — rally and decline — creates a symmetric inverted V, use this pattern. If you are analyzing just the peak reversal candle, use climax reversal.
Key Differences
- Climax reversal focuses on the single reversal candle
- Inverted V describes the entire symmetric formation
- Climax reversal may not have the symmetric decline
Bearish Head Shoulders
30% similarCount the peaks: one sharp peak with no consolidation = inverted V. Three peaks with a neckline = H&S.
Key Differences
- H&S has consolidation and multiple peaks; inverted V has one sharp peak
- H&S develops over weeks; inverted V can form in days
- Inverted V is far more abrupt with no warning
The Buying Climax is a Wyckoff concept describing the final blow-off top where extreme volume and wide price spreads signal that all remaining demand has been absorbed, leaving the market vulnerable to a sharp reversal and the beginning of distribution.
The Climax Reversal is a wide-range candle that forms at the top of an uptrend, opening strong and reversing to close near the low, signaling that selling pressure has overwhelmed buying and the trend may be exhausted.
The Bearish Engulfing is one of the most powerful and commonly traded two-candle reversal patterns. A large bearish candle completely engulfs the prior bullish candle, demonstrating a decisive shift from buying to selling dominance.
The bearish marubozu is a single candle with no shadows — price opened at the high and closed at the low, showing complete seller domination throughout the entire session with no buying resistance.
The shooting star is a single-candle bearish reversal pattern with a small body near the low and a long upper shadow. It shows that buyers pushed price significantly higher during the session but sellers drove it back down, signaling a potential top.
The Broadening Top (Megaphone) is a chart formation characterized by expanding price swings that create higher highs and lower lows, reflecting increasing volatility and instability at market tops before a bearish breakdown.
Pro Tips & Common Mistakes
Pro Tips
- The sharper and more parabolic the rally, the more violent the reversal will be.
- Climax volume at the peak is the single most important confirmation signal.
- Do not try to catch the exact top — the speed of the reversal makes precise top-picking extremely difficult.
- The best entry is often waiting for the 25-50% retracement of the rally, confirming the V-top is forming.
Common Mistakes
- Trying to short the exact peak — the timing is nearly impossible in real-time.
- Using standard position sizing — the volatility of inverted V patterns requires reduced size.
- Expecting a consolidation at the top — inverted V's reverse immediately without warning.
- Holding long positions during parabolic rallies expecting further upside.
Advanced Techniques
- Use real-time sentiment indicators (social media mentions, Google Trends) to identify peak euphoria.
- Monitor funding rates in crypto — extremely positive funding rates often precede inverted V reversals.
- Use options implied volatility: a spike in IV at the peak suggests market makers pricing in a reversal.
- Look for exchange-specific data: record trading volumes and new account registrations signal retail FOMO peaks.
Institutional Perspective
Institutions are typically the ones selling at the peak of the inverted V. They use the extreme buying demand to exit positions completely, knowing that the parabolic move is unsustainable. The reversal occurs when institutional selling exceeds retail buying.
Fun Facts
- The most famous inverted V in history was the Hunt Brothers' silver squeeze of 1980, which rallied silver from $6 to $50 and back to $11 in just months.
- Inverted V tops are more common in crypto markets than any other asset class due to the speculative nature and retail-dominated order flow.
- Behavioral finance research shows that the pain of the inverted V decline feels approximately 2.5x more intense than the pleasure of the rally (loss aversion).
Frequently Asked Questions
An inverted V top is a sharp reversal pattern where a steep, parabolic rally is immediately followed by an equally sharp decline with little to no consolidation at the peak. It forms a V shape when inverted.
Trading the exact peak is extremely difficult. The best approach is to wait for the 25-50% retracement of the rally, confirming the reversal, then enter short with a stop above the peak. Reduce position size due to high volatility.
Inverted V declines often retrace 100% of the parabolic rally, returning price to where the rally began. In speculative assets, the decline can exceed 100% of the rally.