Overview
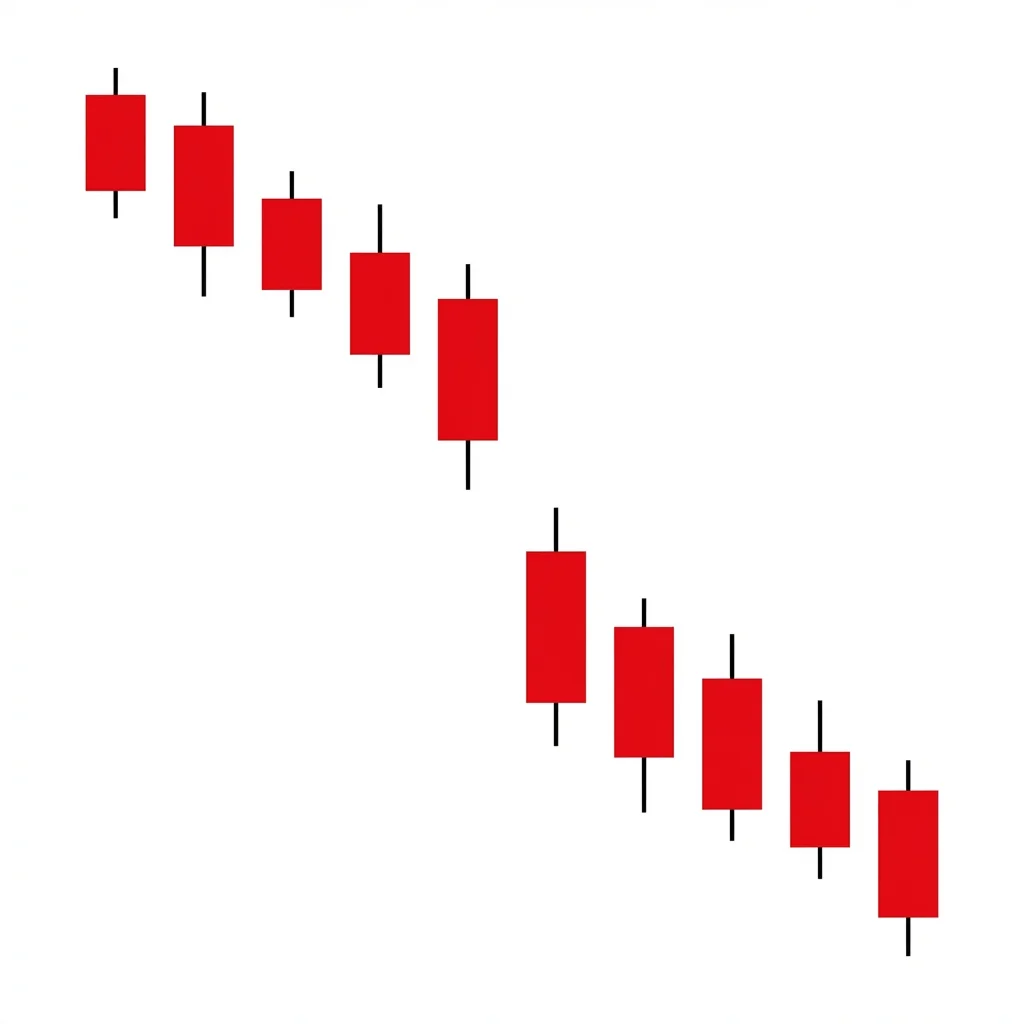
Bearish Falling Window
Makado
Also known as: Bearish Gap Down, Falling Gap, Downside Window
A falling window is a Japanese candlestick term for a gap down in price where the high of the current candle is below the low of the previous candle, signaling strong bearish continuation momentum.
The falling window occurs when bearish momentum is so strong that price opens significantly lower than the prior candle's low, leaving a visible gap on the chart. In Japanese candlestick theory, windows are considered powerful continuation signals. The gap itself often acts as future resistance — when price eventually rallies back to the window, it tends to stall. Traders view unfilled falling windows as confirmation that sellers remain firmly in control and that the downtrend is likely to persist.
History & Etymology
The concept of windows originates from Japanese rice trading in the 18th century. Munehisa Homma and other rice traders observed that gaps in price represented powerful shifts in supply and demand. The Japanese term 'makado' literally means 'window,' and these formations were considered among the most reliable continuation signals in the Sakata method of technical analysis.
The term 'window' is the Japanese equivalent of 'gap' in Western technical analysis. 'Falling' denotes the downward direction. Japanese traders poetically viewed the empty space on the chart as an open window through which momentum flows.
How It Forms
Formation Steps
- 1First candle closes in a downtrend
- 2Second candle opens below the low of the first candle, creating a gap (window)
- 3The gap remains unfilled — the high of the second candle stays below the low of the first
Prerequisites
- Existing downtrend
- Gap between candle bodies or shadows
Confirmation Signals
- Window remains open on subsequent candles
- Increased selling volume on the gap candle
- Follow-through selling after the window
Invalidation Signals
- Price fills the window (gap) completely
- Strong bullish reversal candle closing above the window
- Volume dries up immediately after the gap
Candle Breakdown
Pre-Gap Candle
A candle forming within an existing downtrend, establishing the upper boundary of the window.
Sellers are already in control; this candle sets the stage for the gap.
Gap Candle
Opens below the low of the previous candle, creating the window. The high of this candle must remain below the previous candle's low.
Overnight or session-break panic selling drives price sharply lower, with no buying interest to fill the gap.
Psychology
The falling window represents a sudden acceleration in bearish sentiment, where sellers overwhelm buyers so decisively that price skips an entire range with no transactions.
Buyer Perspective
Buyers who were holding positions are shocked by the gap down, triggering panic selling and stop-loss cascades. New buyers are reluctant to step in, perceiving the gap as a sign of further weakness.
Seller Perspective
Sellers gain extreme confidence from the gap, viewing it as validation. Many add to short positions or initiate new ones, expecting the downtrend to accelerate.
Smart Money Action
Institutional sellers often engineer falling windows by dumping large positions after hours or during pre-market, knowing the gap will trigger retail stop losses and create a cascade effect.
Retail Trader Trap
Retail traders may attempt to 'buy the dip' into the gap, only to find the window acts as strong resistance, trapping them in losing long positions.
Emotional Cycle
Trading Strategy
Aggressive Entry
Short immediately on the open of the gap candle or on confirmation that the first few minutes of trading fail to fill the gap.
Conservative Entry
Wait for a retest of the window's lower boundary (top of the gap) that fails, then enter short on the rejection candle.
1:1 risk-reward based on the size of the window projected downward.
Next significant support level or previous swing low.
Measured move: the distance of the prior downtrend leg projected from the window.
Best Conditions
- Timeframe: daily
- Timeframe: 4h
- Timeframe: 1h
- trending down
- high volatility
- bear market
- Asset: stocks
- Asset: indices
- Asset: crypto
Avoid When
- Timeframe: 1m
- Timeframe: 5m
- low volatility
- sideways chop
- strong uptrend
Confluence Factors
- Window occurs at a broken support level
- RSI confirms bearish momentum without oversold reading
- Moving averages are aligned bearishly
- Window aligns with a Fibonacci extension level
- Multiple windows stacked in the same downtrend
Scale In Strategy
Add to the position if price retests the window and rejects, confirming resistance.
Scale Out Strategy
Take partial profits at 1:1 R:R, move stop to breakeven, let remainder run to TP2/TP3.
Risk Management
Volume Analysis
Volume Confirmation
Volume should spike on the gap candle, confirming institutional participation in the selling.
Volume Profile
Look for a volume void in the window area — this confirms no buying interest exists in that price range.
Volume Divergence
If volume decreases on the gap candle, the window may fill quickly — avoid the trade.
Technical Confluence
Support Resistance
The falling window itself becomes a resistance zone. Price will often rally back to the window before resuming the downtrend.
Fibonacci Levels
If the window aligns with the 38.2% or 50% Fibonacci retracement of the current leg, it strengthens the resistance.
Moving Averages
A falling window below the 20 and 50 EMA confirms strong bearish momentum. The EMAs often align with the window as resistance.
Rsi Confirmation
RSI should be trending below 50 and ideally showing no bullish divergence. A reading between 30-45 is optimal.
Macd Confirmation
MACD histogram expanding in the negative direction confirms momentum behind the gap.
Bollinger Bands
Price gapping below the lower Bollinger Band on the window candle suggests extreme selling but may indicate a short-term oversold bounce before continuation.
Vwap
Gap below VWAP on an intraday basis confirms institutional selling. VWAP often aligns with the window as resistance.
Ichimoku Cloud
A falling window below the Kumo cloud is extremely bearish. The window may align with the Senkou Span B as resistance.
Elliott Wave
Falling windows commonly occur in Wave 3 or Wave C, where momentum is strongest.
Wyckoff Phase
Falling windows are characteristic of the markdown phase, especially during signs of weakness (SOW) events.
Market Profile
The window represents a gap in the market profile, creating a low-volume node that acts as a barrier to upside.
Order Flow
Delta should be strongly negative on the gap candle, showing aggressive selling. Check for iceberg orders at the window level.
Open Interest
In futures/options, rising open interest on the gap confirms new short positions being initiated.
Multi-Timeframe Analysis
Higher Timeframe Alignment
A falling window on the daily chart within a weekly downtrend is the strongest setup. Check that the weekly trend is clearly bearish.
Lower Timeframe Entry
Use the 15-minute or 1-hour chart to time entries on retests of the window. Look for lower timeframe rejection patterns at the window level.
Timeframe Confluence
The window should be visible on at least two timeframes for maximum reliability.
Top-Down Approach
Start with the weekly trend direction, identify the daily falling window, then use the 4H chart for precise entry timing.
Statistics
Historical Examples
Netflix Earnings Gap Down 2022
successNetflix gapped down over 35% after reporting subscriber losses, creating a massive falling window. The window acted as resistance for months as the stock continued to decline.
Lesson: Earnings gaps in fundamentally deteriorating situations create extremely powerful falling windows that rarely fill quickly.
EUR/USD Post-ECB Gap
partialEUR/USD created a falling window on the 4H chart after a hawkish ECB surprise. The window held as resistance for two sessions before eventually being filled.
Lesson: Forex falling windows on lower timeframes have a higher fill rate than daily windows on stocks.
Variations
Runaway Falling Window
A falling window that occurs in the middle of a strong downtrend with expanding volume.
Exhaustion Falling Window
A falling window occurring after an extended downtrend, often with climactic volume.
Confusion Matrix
Patterns commonly confused with Bearish Falling Window and how to distinguish them.
Bearish Exhaustion Gap
70% similarCheck the trend context: if the downtrend is already extended with multiple legs, the gap is more likely an exhaustion gap. If the trend is young, it is a falling window.
Key Differences
- Exhaustion gaps occur at the END of a trend, falling windows in the MIDDLE
- Exhaustion gaps show volume climax, falling windows show strong but not climactic volume
- Exhaustion gaps are quickly filled, falling windows tend to hold
Bearish Downside Tasuki Gap
60% similarIf the candle after the gap is bullish and partially fills the window but doesn't close above it, you have a downside tasuki gap rather than a simple falling window.
Key Differences
- Tasuki gap includes a third bullish candle that partially fills the window
- Falling window has no fill attempt
- Tasuki gap is a 3-candle pattern, falling window is 2 candles
The Downside Tasuki Gap is a bearish continuation pattern in a downtrend where a gap-down is partially but not completely filled by a bullish candle, suggesting that the downtrend will continue as the gap acts as resistance.
The bearish gap momentum pattern occurs when price gaps down on high volume and continues selling throughout the session without filling the gap, indicating powerful one-directional selling pressure.
The bearish marubozu is a single candle with no shadows — price opened at the high and closed at the low, showing complete seller domination throughout the entire session with no buying resistance.
A bearish runaway gap (or measuring gap) is a gap down that occurs in the middle of a strong downtrend, signaling acceleration of selling pressure. It often marks the midpoint of the total move, making it useful for projecting the ultimate price target.
Three black crows is a powerful bearish reversal pattern consisting of three consecutive long bearish candles, each opening within the prior candle's body and closing near its low. It signals strong, persistent selling pressure and a likely trend reversal.
The Bullish Rising Window is a gap-up pattern where the second candle's low is entirely above the first candle's high, creating a visible window (gap) that acts as future support and signals trend continuation.
Pro Tips & Common Mistakes
Pro Tips
- In Japanese candlestick theory, a falling window that remains unfilled for 3+ sessions is considered a strong continuation signal.
- Stack multiple falling windows — when you see 2 or 3 in the same downtrend, the trend is extremely strong.
- The midpoint of the window often acts as a secondary resistance level.
- Use the window as your invalidation level for short trades entered after the gap.
Common Mistakes
- Trying to buy into a falling window expecting a quick reversal — most windows hold as resistance.
- Confusing an exhaustion gap for a falling window — always assess trend maturity.
- Setting stops too tight below the window — allow room for a partial retest.
- Ignoring the volume profile within the window — low volume nodes are harder to reclaim.
Advanced Techniques
- Use volume profile to identify exact resistance within the window — the top of the gap is strongest.
- Combine falling windows with Ichimoku cloud analysis: a window below the Kumo is powerfully bearish.
- Monitor options flow around the window level — large put buying confirms institutional bearish conviction.
- Use delta divergence on the retest of the window to time short entries precisely.
Institutional Perspective
Institutions use falling windows as reference points for adding to short positions. The window's upper boundary becomes a key level where institutional limit sell orders cluster, making it a natural resistance zone.
Fun Facts
- Japanese traders considered windows (gaps) to be one of the most important formations — Homma's original Sakata method placed heavy emphasis on them.
- The saying 'the window must close' is a common Japanese market proverb, meaning gaps tend to eventually fill — but 'eventually' can mean months or years.
- In the original Japanese texts, three consecutive falling windows was considered one of the most bearish signals possible.
Frequently Asked Questions
A bearish falling window is a gap down where the high of the current candle is below the low of the previous candle. It signals strong bearish momentum and typically acts as a continuation pattern in downtrends.
Trade by entering short either on the gap itself or on a failed retest of the window level. Place your stop loss above the window and target the next support level or a measured move projection.
No, not all falling windows fill. In strong downtrends, windows can remain open for weeks or months. Generally, about 60% of windows eventually get retested, but only a portion of those fully fill.