Overview
Bullish Island Reversal
Also known as: Island Bottom, Island Cluster Reversal, Exhaustion Island
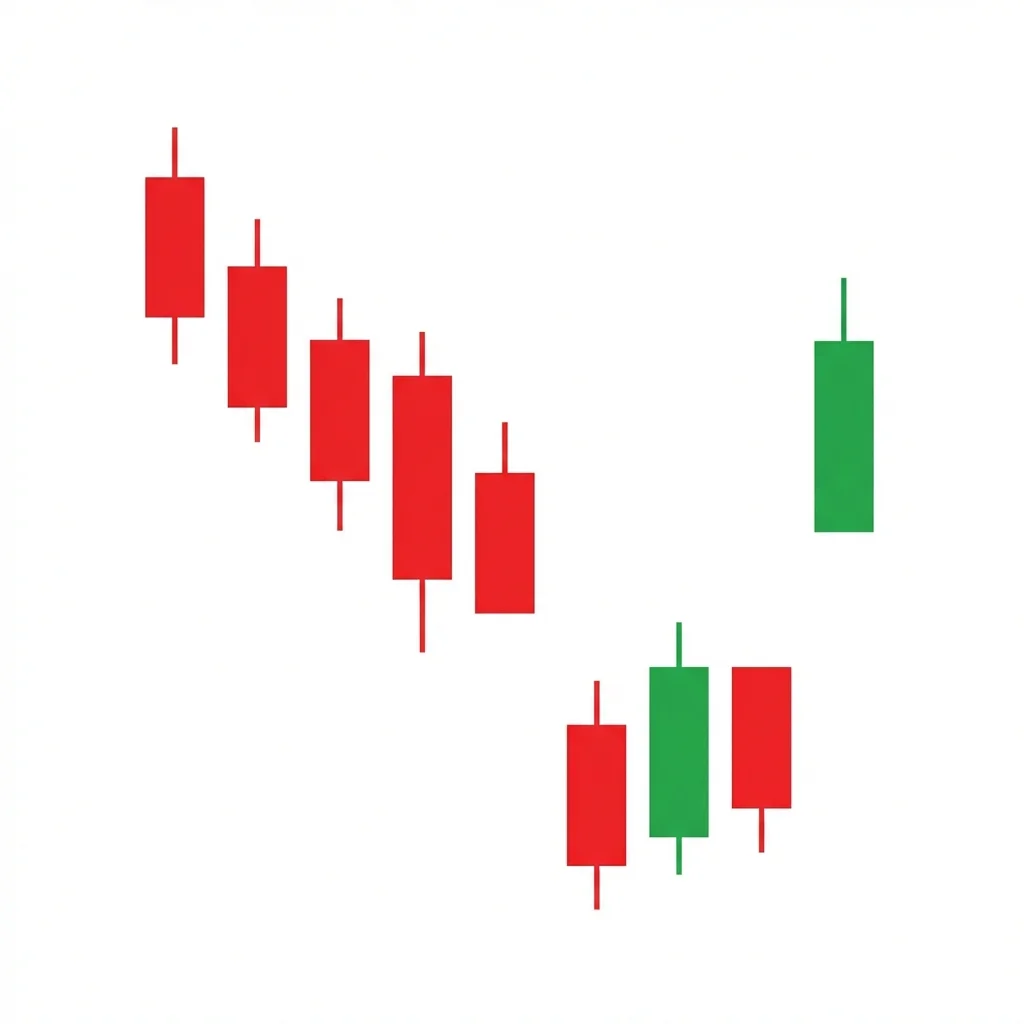
The Bullish Island Reversal is a powerful gap-based reversal pattern where price gaps down to form an isolated cluster, then gaps back up, leaving behind an 'island' of price action that signals a dramatic shift in sentiment.
The Bullish Island Reversal occurs when an exhaustion gap down at the end of a downtrend is followed by a reversal and then a breakaway gap up. The price action between the two gaps is isolated — like an island surrounded by water (gaps). This creates one of the most powerful reversal signals in technical analysis because it represents a complete and sudden shift in market sentiment. The exhaustion gap down marks the final bearish push, and the breakaway gap up signals that buyers have seized control. Both gaps unfilled means the market has decisively reversed.
History & Etymology
Island reversals have been documented since the early days of bar chart analysis. Edwards and Magee discussed them as significant reversal patterns in their foundational work. The pattern became particularly notable in stock trading where gaps are common due to overnight price changes.
The name describes the visual appearance: the cluster of candles between the two gaps is isolated from the surrounding price action, resembling an island surrounded by water (the gaps).
How It Forms
Formation Steps
- 1An exhaustion gap down that separates price from the prior trading range
- 2One or more candles trading in an isolated range (the island)
- 3A breakaway gap up that leaves the island behind, with no overlap in price between the gaps
Prerequisites
- Prior downtrend leading into the exhaustion gap down
- A clear gap down that creates separation from prior price action
- A subsequent gap up that creates separation on the other side, forming the island
Confirmation Signals
- Gap up closes and is not filled in subsequent bars
- Volume surges on the gap up day
- Price continues higher after the gap up
Invalidation Signals
- The gap up is filled (price drops back into the island range)
- Volume is weak on the gap up
- Price fails to hold above the island
Candle Breakdown
Exhaustion Gap Down
Price gaps down from the prior range, marking the final push of the downtrend
Panic selling reaches a climax. This is the capitulation gap where the last bears pile in.
Island Candle(s)
One or more candles trading in an isolated range between the two gaps
The market pauses in a narrow range. Sellers are exhausted and buyers begin to accumulate.
Breakaway Gap Up
Price gaps up and away from the island, leaving it isolated below
Buyers take control decisively. The gap up traps anyone who sold during the island phase.
Psychology
The island reversal captures one of the most dramatic sentiment shifts possible. Panic selling creates the gap down, a brief pause occurs on the island, and then a complete reversal is signaled by the gap up. It represents a 180-degree turn in market psychology.
Buyer Perspective
Buyers who accumulated during the island phase are immediately rewarded by the gap up. New buyers are attracted by the powerful reversal signal.
Seller Perspective
Sellers who entered on the exhaustion gap down are trapped on the island. The gap up makes it impossible to exit at reasonable prices, forcing them to cover at higher levels.
Smart Money Action
Institutions use the panic gap down to absorb supply from retail sellers. They accumulate on the island and profit from the gap up reversal.
Retail Trader Trap
Retail traders who panic-sold on the gap down or shorted during the island are left with losses as the gap up traps them on the wrong side.
Emotional Cycle
Trading Strategy
Aggressive Entry
Buy on the open of the gap up day if pre-market activity confirms the gap.
Conservative Entry
Wait for the gap up candle to close and confirm the gap is not being filled.
The level where the exhaustion gap down originated (filling the prior gap area).
2x the island-to-gap-up distance projected higher.
Prior swing highs above the exhaustion gap.
Best Conditions
- Timeframe: daily
- Timeframe: weekly
- after panic selling
- earnings-driven gaps
- oversold bounces
- Asset: stocks
- Asset: ETFs
- Asset: indices
Avoid When
- Timeframe: 1m
- Timeframe: 5m
- Timeframe: 15m
- low-volatility environments
- continuous trading (no gaps)
- futures (24-hour markets)
Confluence Factors
- Island forms at a major support level
- RSI extremely oversold before the pattern
- Volume confirms both gaps
- Fundamental catalyst drives the gap up (earnings beat, etc.)
- Sector or market turning simultaneously
Scale In Strategy
Enter full position on the gap up — the pattern is binary (works or doesn't).
Scale Out Strategy
Take one-third at the prior gap area, one-third at 2:1 R:R, trail the rest.
Risk Management
Volume Analysis
Volume Confirmation
High volume on both gaps is essential. The gap up should have higher volume than the gap down.
Volume Profile
Volume climax on the gap down, steady on the island, and surging on the gap up is textbook.
Volume Divergence
Low volume on the gap up suggests the reversal may lack conviction.
Technical Confluence
Support Resistance
The island area becomes a strong support zone that should not be revisited. The gaps create permanent support/resistance.
Fibonacci Levels
The gap down often lands near a Fibonacci extension level, and the gap up returns price toward key retracements.
Moving Averages
The gap up often reclaims an important moving average (20 or 50-day), adding confirmation.
Rsi Confirmation
RSI should be deeply oversold before the pattern and surge above 50 on the gap up.
Macd Confirmation
MACD bullish crossover on the gap up day provides strong momentum confirmation.
Bollinger Bands
The island typically forms outside the lower band, and the gap up reclaims the band.
Vwap
The gap up should reclaim multi-day VWAP to confirm the sentiment shift.
Ichimoku Cloud
The gap up through Ichimoku levels is especially significant.
Elliott Wave
Island reversals often mark the termination of Wave 5 or Wave C extremes.
Wyckoff Phase
The pattern can mark the selling climax in Wyckoff accumulation.
Market Profile
The island forms in a price region that becomes permanently rejected — a single print area.
Order Flow
Massive buy absorption on the island followed by initiative buying on the gap up.
Open Interest
Rising OI on the gap up confirms new long positions rather than just short covering.
Multi-Timeframe Analysis
Higher Timeframe Alignment
A daily island reversal at a weekly support level is extremely powerful.
Lower Timeframe Entry
Use the 30-minute chart to identify the gap up and enter early in the gap up session.
Timeframe Confluence
The pattern is primarily a daily phenomenon — lower timeframes don't produce true gaps.
Top-Down Approach
Confirm weekly support, identify the daily island reversal, use the opening session for entry.
Statistics
Historical Examples
Apple Earnings Island Reversal
successApple gapped down on an earnings warning, traded in a tight range for two days, then gapped up on better-than-expected guidance. The island reversal preceded a 30% rally.
Lesson: Earnings-driven island reversals are among the most powerful because they combine technical and fundamental catalysts.
S&P 500 COVID Island Bottom
successThe S&P 500 formed a brief island pattern at the March 2020 lows, with gaps isolating the panic bottom before a massive reversal higher.
Lesson: Island reversals at major market bottoms can mark the start of sustained recovery rallies.
Variations
Single-Candle Island
Only one candle exists between the gaps — a single day of isolated trading.
Extended Island Cluster
Multiple candles (5-15) trade in the island range before the gap up.
Confusion Matrix
Patterns commonly confused with Bullish Island Reversal and how to distinguish them.
Bullish Gap Down Reversal
7000% similarIf there are gaps on BOTH sides of the isolated price action, it's an island reversal. If only one gap, it's a gap reversal.
Key Differences
- Gap down reversal is a single-gap pattern; island reversal has two gaps
- The island is isolated by gaps on both sides
The bearish island reversal is a powerful reversal pattern where price gaps up, trades briefly in an isolated range (the island), then gaps down, leaving the island completely separated by gaps on both sides. It signals a decisive sentiment shift.
The Bullish Engulfing is one of the most popular and reliable two-candle reversal patterns. A large bullish candle completely engulfs the prior bearish candle body, signaling a decisive shift from selling to buying control.
The Gap and Go occurs when price gaps up on a catalyst, and instead of filling the gap, continues higher as momentum buying drives the stock to new levels throughout the session.
A Bullish Key Reversal occurs when price makes a new low during a downtrend but reverses to close above the prior bar's high on heavy volume, signaling a dramatic single-day shift in control from sellers to buyers.
A falling window is a Japanese candlestick term for a gap down in price where the high of the current candle is below the low of the previous candle, signaling strong bearish continuation momentum.
The bearish gap fill rejection occurs when price rallies to fill a prior gap down but is rejected at or within the gap zone, confirming the gap as resistance and signaling continuation of the downtrend.
Pro Tips & Common Mistakes
Pro Tips
- The gaps on BOTH sides must remain unfilled for the island reversal to remain valid
- Higher volume on the gap up than the gap down is the strongest confirmation signal
- This pattern is most common and most powerful in individual stocks due to overnight gap mechanics
- A single-candle island (one day of isolated trading) is more powerful than a multi-candle island
- Set your stop at the island — if price revisits the island, the pattern has failed
Common Mistakes
- Calling it an island reversal when only one gap exists (both gaps are required)
- Not verifying that the gaps don't overlap — there must be clear separation on both sides
- Entering after the gap up has already moved too far, degrading the risk-reward ratio
- Not using stops — if the breakaway gap fills, exit immediately as the pattern has failed
- Trying to find island reversals in 24-hour markets where true gaps are rare
Advanced Techniques
- Scan for stocks gapping up after previously gapping down within the last 5 days
- Use pre-market data to identify potential island gap-ups before the market opens
- Measure the 'empty space' between the gaps — larger gaps indicate stronger reversals
- Combine with earnings/news analysis to understand the fundamental driver behind the gaps
Institutional Perspective
Institutions recognize island reversals as among the strongest reversal signals. The two unfilled gaps create a 'no-man's land' that acts as permanent support. Fund managers often establish or increase positions on the gap up day, knowing the pattern's high success rate.
Fun Facts
- The island reversal is one of the few patterns that creates a permanent 'void' in the price chart — a range that is never traded through again if the pattern succeeds.
- Some of the most dramatic stock market bottoms in history have featured island reversals, including several bear market endings.
- The pattern is almost exclusive to markets that close overnight — 24-hour markets like forex rarely produce true island reversals.
Frequently Asked Questions
A Bullish Island Reversal occurs when price gaps down, trades in an isolated range for one or more days, then gaps back up, leaving behind an 'island' of price action. The two gaps signal a dramatic shift from bearish to bullish sentiment.
Island reversals are relatively rare because they require two unfilled gaps in close succession. They occur most commonly in individual stocks during earnings season or after major news events.
If price drops back into the island area (filling the breakaway gap up), the pattern is considered failed. Exit the trade immediately as the reversal thesis is invalidated.