Overview
Bearish Key Reversal
Also known as: Key Reversal Day, Outside Reversal Day, Key Bearish Reversal Bar
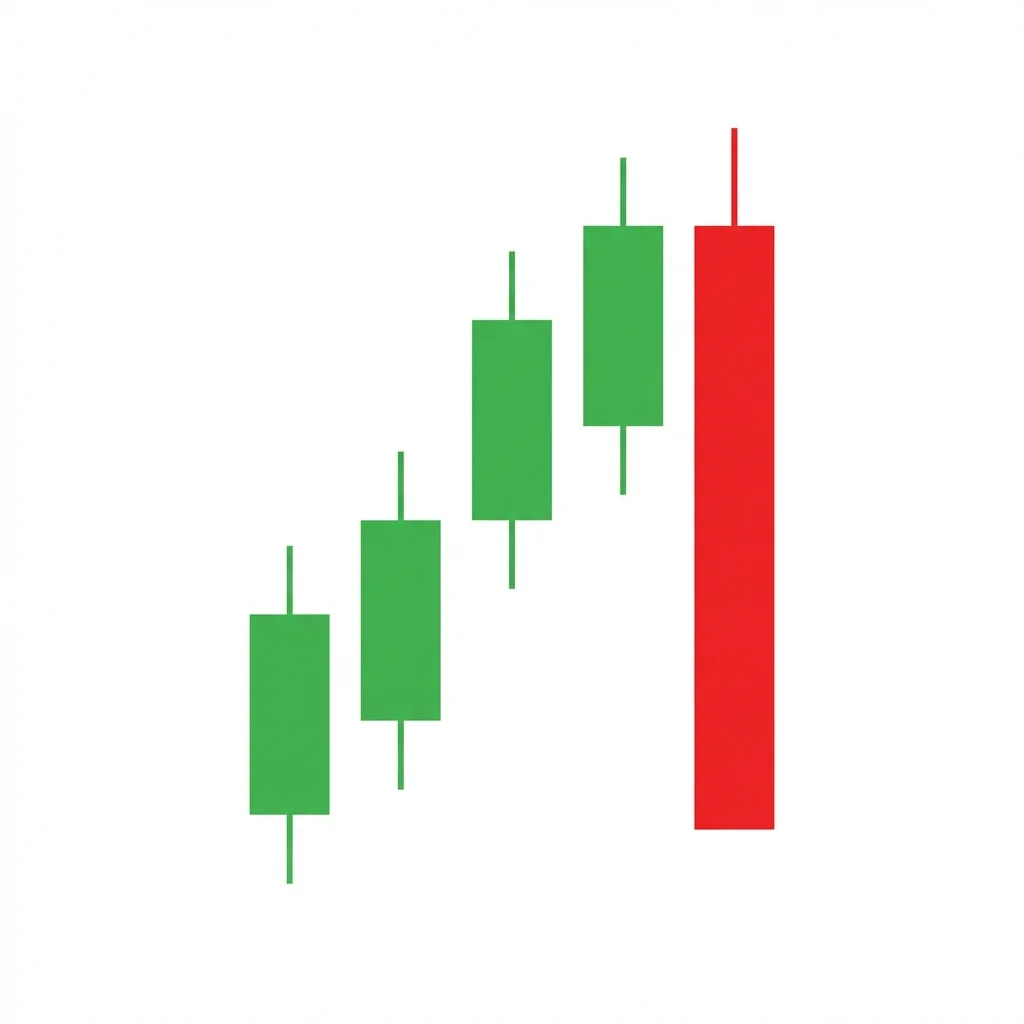
The bearish key reversal is a powerful single-bar reversal pattern where price makes a new high then reverses to close below the prior bar's low on high volume, signaling a decisive shift from buying to selling control.
The key reversal is a Western technical analysis concept that identifies a single session where the balance of power shifts dramatically. The session opens with bullish continuation, pushing to a new high, but during the session, sellers overwhelm buyers so decisively that price closes below the prior session's low. This complete rejection of higher prices, combined with high volume, signals that institutional selling has entered the market with force. The key reversal is particularly powerful because it shows that buyers had their best shot (new high) and failed completely.
History & Etymology
The key reversal day is one of the oldest Western technical analysis patterns, used by traders since at least the early 20th century. It was popularized in bar chart analysis before candlesticks became common in Western markets. The pattern was a favorite of pit traders who could observe the intraday shift in sentiment directly.
Called a 'key' reversal because it marks a KEY turning point in the trend. The reversal is significant enough to potentially change the direction of the entire trend, unlike minor pullbacks.
How It Forms
Formation Steps
- 1Price makes a new high above the prior candle's high (or a new trend high)
- 2Price reverses sharply during the session
- 3Price closes below the prior candle's low
- 4Volume is significantly above average
Prerequisites
- Prior uptrend
- New high made during the session
Confirmation Signals
- Volume is 1.5x or more above average
- Close is in the lower 25% of the session's range
- Follow-through selling the next session
Invalidation Signals
- Price recovers above the key reversal's high the next session
- Volume is low on the key reversal day
- No follow-through selling within 2 sessions
Candle Breakdown
Key Reversal Bar
A candle that opens near its high, makes a new high above the prior bar, then reverses to close below the prior bar's low. The body is typically bearish with a long upper shadow.
The ultimate failed breakout. Bulls pushed to new highs with conviction, but sellers overwhelmed them so completely that the close is below the prior bar's entire range.
Psychology
The key reversal represents a complete intraday sentiment reversal. The session starts with peak bullish enthusiasm (new high), transitions through shock as selling intensifies, and ends with bears in complete control (close below prior low).
Buyer Perspective
Buyers are initially elated by the new high. As the reversal unfolds, elation turns to disbelief, then fear. By the close, buyers who entered on the new high are deeply underwater.
Seller Perspective
Sellers waited for the new high to attract maximum buying before entering aggressively. The reversal from new highs gives them extreme confidence in their thesis.
Smart Money Action
Institutions use the new high as a liquidity event — retail breakout orders provide the demand they need to sell large positions. The reversal is the visible footprint of institutional distribution.
Retail Trader Trap
Retail breakout traders buy the new high with tight stops. The reversal triggers all their stops, which feeds the decline further.
Emotional Cycle
Trading Strategy
Aggressive Entry
Short near the close of the key reversal day if the close is in the bottom 25% of the range.
Conservative Entry
Wait for the next session to trade below the key reversal's low, confirming the reversal.
Full range of the key reversal bar projected downward.
Prior significant support level.
Start of the rally that preceded the reversal.
Best Conditions
- Timeframe: daily
- Timeframe: weekly
- Timeframe: 4h
- end of uptrend
- at resistance
- high volatility
- Asset: stocks
- Asset: indices
- Asset: commodities
- Asset: crypto
Avoid When
- Timeframe: 1m
- Timeframe: 5m
- strong bull market breakout
- low volatility
Confluence Factors
- New high at a known resistance level
- RSI bearish divergence at the new high
- Volume is highest in the last several sessions
- MACD declining despite the new high
- Key reversal occurs at a Fibonacci extension
Scale In Strategy
Enter 75% on the key reversal close, add 25% on the next session's break below the reversal low.
Scale Out Strategy
Take 50% at TP1, trail remainder.
Risk Management
Volume Analysis
Volume Confirmation
Volume must be significantly above average. This is non-negotiable for a valid key reversal.
Volume Profile
The upper shadow represents a volume spike at rejected prices. The close near the low shows volume-weighted selling dominance.
Volume Divergence
A key reversal on low volume is not a key reversal — it is just a wide-range bar.
Technical Confluence
Support Resistance
The key reversal's high becomes strong resistance. The new high that was rejected is the most significant level.
Fibonacci Levels
Key reversal at a 127.2% or 161.8% Fibonacci extension is extremely powerful.
Moving Averages
A key reversal far above the 20 EMA confirms overextension and increases the probability of follow-through.
Rsi Confirmation
RSI making a lower high (divergence) while price makes a new high on the key reversal is the strongest confirmation.
Macd Confirmation
MACD histogram declining on the key reversal day despite the new high confirms momentum divergence.
Bollinger Bands
Key reversal piercing the upper Bollinger Band and closing back inside (or below the middle band) is very bearish.
Vwap
Closing below VWAP on the key reversal day confirms that sellers controlled the session despite the new high.
Ichimoku Cloud
Key reversal above the Kumo cloud failing and closing below the Tenkan-Sen is bearish.
Elliott Wave
Key reversals frequently mark the end of Wave 5, especially when accompanied by momentum divergence.
Wyckoff Phase
The key reversal is an upthrust (UT) or upthrust after distribution (UTAD) in Wyckoff terminology.
Market Profile
The new high creates a buying tail (excess) that is immediately rejected. The close at the low shows seller acceptance.
Order Flow
Massive negative delta despite the new high shows aggressive selling absorbing all breakout buying.
Open Interest
Put-call ratio spiking on the key reversal day confirms institutional hedging at the new high.
Multi-Timeframe Analysis
Higher Timeframe Alignment
Weekly key reversals are among the most powerful reversal signals in all of technical analysis.
Lower Timeframe Entry
Use the intraday chart to see the reversal unfold from the new high — enter as the reversal becomes clear.
Timeframe Confluence
Daily key reversal within a weekly shooting star candle is extremely bearish.
Top-Down Approach
Monthly resistance → Weekly overbought → Daily key reversal → Enter short.
Statistics
Historical Examples
Crude Oil Key Reversal 2008
successCrude oil hit $147.27 (all-time high) then reversed to close below the prior day's low on record volume. This key reversal marked the exact top, and oil declined to $32 over the next 5 months.
Lesson: Key reversals at all-time highs in commodities with extreme volume can mark generational tops.
Tesla Key Reversal 2021
successTesla made a new all-time high above $1,243 then reversed sharply to close below the prior day's low on high volume. The stock declined over 50% in the following months.
Lesson: Key reversals in mega-cap stocks can signal major trend changes that take months to play out.
Variations
Key Reversal from All-Time High
Key reversal at an all-time high with record or near-record volume.
Moderate Key Reversal
Key reversal above the prior bar but not at an all-time high, with moderately above-average volume.
Confusion Matrix
Patterns commonly confused with Bearish Key Reversal and how to distinguish them.
Bearish Outside Reversal
85% similarIf the bar makes a NEW high above the prior bar's high AND closes below the prior bar's low, it is a key reversal. If it just has a wider range without a new high, it is an outside reversal.
Key Differences
- Key reversal requires a NEW high (new trend high or above prior bar's high)
- Outside reversal just requires the range to engulf the prior bar
- Key reversal has the additional new-high requirement
Bearish Shooting Star
70% similarCheck the close: if it is BELOW the prior bar's low, it is a key reversal. If it is at or above the prior bar's low, it is a shooting star.
Key Differences
- Key reversal closes below the prior bar's low
- Shooting star closes above the prior bar's low (usually within its range)
- Key reversal is more decisive and reliable
The Bearish Engulfing is one of the most powerful and commonly traded two-candle reversal patterns. A large bearish candle completely engulfs the prior bullish candle, demonstrating a decisive shift from buying to selling dominance.
A bearish outside reversal occurs when a candle's range completely engulfs the prior candle's entire range (highs and lows), closing near its low. It signals that sellers have overwhelmed buyers and a reversal is likely.
The shooting star is a single-candle bearish reversal pattern with a small body near the low and a long upper shadow. It shows that buyers pushed price significantly higher during the session but sellers drove it back down, signaling a potential top.
A Bullish Key Reversal occurs when price makes a new low during a downtrend but reverses to close above the prior bar's high on heavy volume, signaling a dramatic single-day shift in control from sellers to buyers.
The Bearish Belt Hold is a single bearish candle that opens at its high and closes near its low with a long body, indicating that sellers dominated from the opening bell and controlled price action throughout the session.
The Bearish Closing Marubozu is a single bearish candle with no lower shadow — the close is at the exact low of the session. This indicates that sellers controlled the session and maintained pressure through the very last trade, a sign of strong bearish conviction.
Pro Tips & Common Mistakes
Pro Tips
- The volume is non-negotiable — a key reversal without high volume is just a wide-range bar.
- The new high requirement is what separates a key reversal from a standard outside bar — the new high attracts breakout orders that fuel the reversal.
- The close should be in the bottom 25% of the range for maximum bearish impact.
- Weekly key reversals are far more significant than daily ones — they can mark multi-month trend changes.
Common Mistakes
- Calling any wide-range bearish bar a key reversal — the new high and high volume requirements must be met.
- Ignoring the volume requirement — low volume 'key reversals' fail frequently.
- Not checking for a new high — the bar must exceed the prior bar's high.
- Setting stops too tight below the key reversal high — allow some buffer for retest.
Advanced Techniques
- Combine with RSI divergence for maximum confidence — a new price high with a lower RSI high on the key reversal is extremely bearish.
- Use options unusual activity: heavy put buying or call selling on the key reversal day confirms institutional positioning.
- Monitor the intraday chart to see the key reversal unfold — the reversal from new highs creates a specific order flow signature.
- Look for key reversals simultaneously across correlated assets for sector-wide reversal confirmation.
Institutional Perspective
Key reversals are one of the most watched signals by institutional traders. The new high provides the liquidity event needed for large position exits. The volume spike confirms institutional participation in the reversal.
Fun Facts
- The key reversal was one of the first patterns taught to new floor traders at the Chicago exchanges.
- The most famous key reversal in history occurred in crude oil on July 11, 2008, marking the exact all-time high at $147.27.
- Some trading desks have automated alerts specifically for key reversals because they have one of the highest signal-to-noise ratios among single-bar patterns.
Frequently Asked Questions
A key reversal occurs when price makes a new high (above the prior bar's high) during the session but reverses to close below the prior bar's low on high volume. It signals a decisive shift from buying to selling control.
High volume confirms institutional participation. Without high volume, the reversal may just be a wide-range bar without conviction. Volume above 1.5x the average is typically required.
A key reversal closes BELOW the prior bar's low, while a shooting star closes within or above the prior bar's range. The key reversal is more decisive because it completely engulfs the prior bar's range.