Overview
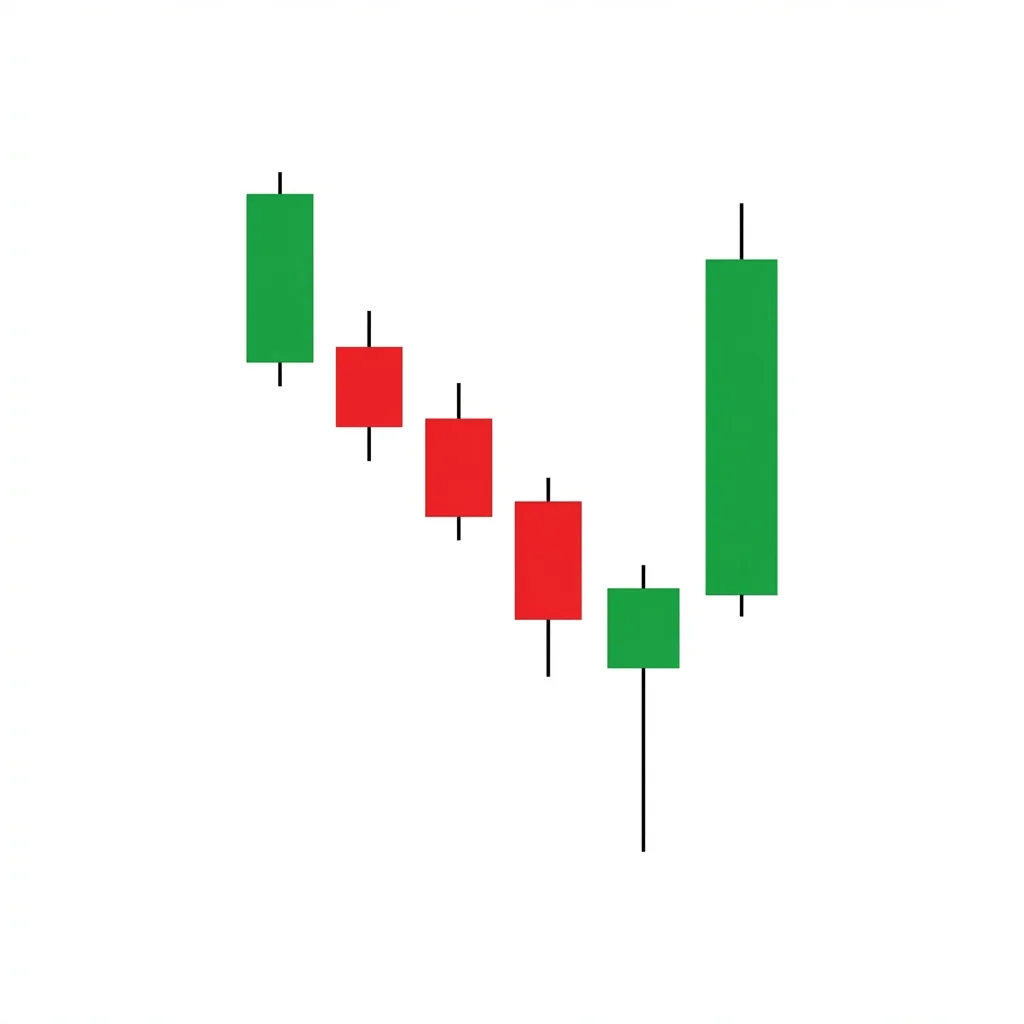
Bullish Confirmed Hammer
Karakasa
Also known as: Hammer with Confirmation, Verified Hammer, Two-Bar Hammer Setup
The Bullish Confirmed Hammer adds a confirmation candle to the classic hammer pattern, significantly improving reliability by proving that buyers who defended the lows maintained control into the next session.
A standalone hammer is a well-known reversal signal, but experienced traders know that a single candle needs confirmation. The Confirmed Hammer pattern solves this by requiring a bullish follow-through candle that closes above the hammer's high. The hammer itself shows that sellers pushed price significantly lower during the session but buyers fought back, recovering most or all of the losses (creating the long lower shadow). The confirmation candle proves this was not just an intraday anomaly but the beginning of a genuine shift. Together, the two candles tell a clear story: sellers tried and failed, and buyers have now taken the lead.
History & Etymology
The hammer (Karakasa in Japanese) is one of the oldest and most recognized candlestick patterns, dating back to the Japanese rice futures markets. The concept of requiring confirmation was emphasized by Steve Nison, who warned traders against acting on single-candle patterns without follow-through.
The hammer gets its name from its appearance, which looks like a hammer or mallet with a long handle (the lower shadow) and a head (the body). The Japanese name Karakasa means umbrella, referencing the similar shape.
How It Forms
Formation Steps
- 1First candle: hammer with a small body at the top and a long lower shadow at least 2x the body length
- 2Second candle: bullish confirmation candle that closes above the hammer high
Prerequisites
- Established downtrend of at least 3-5 bars
- Hammer must have a lower shadow at least 2x the body length
- Small or no upper shadow on the hammer
Confirmation Signals
- Second candle closes above the hammer high
- Volume increases on the confirmation candle
- The confirmation candle has a sizeable bullish body
Invalidation Signals
- Second candle closes below the hammer low
- No follow-through after confirmation
- Volume decreases on the confirmation candle
Candle Breakdown
Hammer
A candle with a small body at or near the high and a long lower shadow at least twice the body length.
Sellers pushed price sharply lower, but buyers fought back aggressively to close near the high. The long lower shadow represents rejected lower prices.
Confirmation Candle
A bullish candle closing above the hammer high, confirming the reversal.
Buyers maintain control from the previous session. Closing above the hammer high validates the rejection of lower prices and confirms the trend change.
Psychology
The confirmed hammer captures a two-act narrative: Act 1 (the hammer) shows sellers being defeated despite their best effort; Act 2 (the confirmation) proves that the defeat was permanent and buyers are now in charge.
Buyer Perspective
Buyers see the long lower shadow as proof that selling pressure failed. The confirmation candle gives them confidence to enter with conviction.
Seller Perspective
Sellers who drove price lower during the hammer session see their profits evaporate. The confirmation candle above the hammer high forces remaining shorts to cover.
Smart Money Action
Institutions often place large buy orders during the hammer's lower shadow, creating the recovery. The confirmation candle is where they add to positions as the reversal is verified.
Retail Trader Trap
Retail traders who sold during the hammer's intraday drop are caught at the worst prices. Those who waited to short the close are squeezed by the confirmation.
Emotional Cycle
Trading Strategy
Aggressive Entry
Enter long at the close of the hammer if the body is bullish and volume is high.
Conservative Entry
Enter after the confirmation candle closes above the hammer high.
At the nearest overhead resistance level.
At a 1:2 risk-reward measured from the stop to entry.
At the swing high that preceded the downtrend.
Best Conditions
- Timeframe: 4h
- Timeframe: daily
- Timeframe: weekly
- After downtrends at support levels
- Oversold market conditions
- At major moving averages
- Asset: stocks
- Asset: forex
- Asset: crypto
- Asset: futures
Avoid When
- Timeframe: 1m
- Timeframe: 5m
- In freefall bear markets
- Near no significant support
Confluence Factors
- Hammer at a key support level
- RSI oversold (below 30)
- Hammer lower shadow pierces and recovers a moving average
- Volume spike on both candles
- Bullish divergence on oscillators
Scale In Strategy
Enter 60% on the confirmation candle, add 40% on a pullback to the hammer close area.
Scale Out Strategy
Take 50% at the first resistance target, trail the remainder with the 10 EMA.
Risk Management
Volume Analysis
Volume Confirmation
Both candles should have above-average volume. High volume on the hammer shows a battle; high volume on the confirmation shows resolution.
Volume Profile
Volume should be concentrated in the lower portion of the hammer's range (buying at the lows).
Volume Divergence
Low volume on the confirmation candle weakens the signal considerably.
Technical Confluence
Support Resistance
The hammer low becomes a very significant support level. A confirmed hammer at a pre-existing support level is one of the highest-conviction setups.
Fibonacci Levels
A confirmed hammer at the 50% or 61.8% Fibonacci retracement is a textbook entry.
Moving Averages
Hammers bouncing off the 50 or 200 SMA with confirmation are among the most reliable signals in technical analysis.
Rsi Confirmation
RSI below 30 during the hammer with a recovery above 30 on confirmation is ideal.
Macd Confirmation
A bullish MACD crossover near the hammer adds strong confluence.
Bollinger Bands
A hammer that pierces the lower Bollinger Band and recovers inside confirms mean reversion.
Vwap
On intraday charts, a hammer that dips below VWAP and confirms above it shows buyers reclaiming fair value.
Ichimoku Cloud
A hammer at the Kijun-sen or Senkou Span B with confirmation is a high-quality setup.
Elliott Wave
Confirmed hammers often mark the end of Wave 2 or Wave 4 corrections.
Wyckoff Phase
The hammer can serve as the spring and the confirmation as the Sign of Strength in a mini-accumulation.
Market Profile
The hammer lower shadow creates a rejection tail in the market profile, and confirmation shows price accepting higher value.
Order Flow
Aggressive buy orders at the hammer low (visible as positive delta spikes) confirm institutional demand.
Open Interest
Rising open interest on the confirmation candle confirms new long positions being established.
Multi-Timeframe Analysis
Higher Timeframe Alignment
A daily confirmed hammer at a weekly support level is one of the most reliable setups.
Lower Timeframe Entry
Use the 1-hour chart to time the entry within the confirmation candle session.
Timeframe Confluence
A weekly hammer confirmed by a daily bullish candle is extremely powerful.
Top-Down Approach
Weekly support level, daily hammer formation, 4-hour entry timing.
Statistics
Historical Examples
SPY Confirmed Hammer at 200-Day SMA
successSPY formed a textbook hammer with a long lower shadow touching the 200-day SMA. The next session confirmed with a strong bullish close above the hammer high, launching a rally that lasted through year-end.
Lesson: Confirmed hammers at the 200-day SMA are among the most reliable setups because they combine pattern recognition with a universally watched technical level.
Variations
Gap-Up Confirmed Hammer
The confirmation candle gaps up above the hammer high.
High-Volume Confirmed Hammer
Both candles have volume more than 2x the average.
Confusion Matrix
Patterns commonly confused with Bullish Confirmed Hammer and how to distinguish them.
Bullish Hammer
8000% similarA confirmed hammer specifically includes the confirmation candle closing above the hammer high, making it a two-candle pattern.
Key Differences
- Standalone hammer has no confirmation requirement
- Confirmed hammer requires a bullish follow-through candle
Bullish Engulfing
5500% similarCheck if the second candle body fully contains the first candle body. If yes, it may be an engulfing. If not but it closes above the hammer high, it is a confirmed hammer.
Key Differences
- Engulfing requires the second candle body to engulf the first
- Confirmed hammer only requires closing above the hammer high
The Confirmed Shooting Star adds a bearish confirmation candle to the classic shooting star, eliminating the ambiguity of the standalone pattern and creating a higher-probability reversal signal at the top of uptrends.
The Bullish Engulfing is one of the most popular and reliable two-candle reversal patterns. A large bullish candle completely engulfs the prior bearish candle body, signaling a decisive shift from selling to buying control.
The Inverted Hammer is a single-candle bullish reversal pattern appearing at the bottom of downtrends. Its long upper shadow shows buyers attempted to push price higher, hinting that the selling pressure may be ending.
The Piercing Line is a two-candle bullish reversal pattern where a bearish candle is followed by a bullish candle that opens below the low and 'pierces' above the midpoint of the first candle's body, showing strong buying recovery.
The Bullish Three Inside Up is a three-candle reversal pattern that combines a bullish harami with a confirming third candle that closes above the first candle's open, providing a more reliable reversal signal than the harami alone.
The Bearish Counterattack Line features a bullish candle followed by a bearish candle that gaps up at the open but closes back to the same level as the first candle's close, signaling that sellers 'counterattacked' the bullish advance.
Pro Tips & Common Mistakes
Pro Tips
- The longer the hammer lower shadow, the more significant the rejection of lower prices
- A bullish hammer body (close above open) is slightly more reliable than a bearish hammer body
- The confirmation candle should ideally have above-average volume to validate the reversal
- Hammers at confluent support levels (Fibonacci + moving average + horizontal) have the highest win rates
- Do not wait too long for confirmation since a gap up on the second day that is too large makes entry difficult
Common Mistakes
- Trading the hammer before confirmation since hammers alone fail about 40% of the time
- Ignoring the 2x body-to-shadow ratio requirement and calling any candle with a lower shadow a hammer
- Placing stops above the hammer low rather than below it
- Trading hammers in the middle of a range where they have less significance
Advanced Techniques
- Use the 1-hour chart to watch the hammer form in real-time and prepare for the confirmation
- Measure the hammer shadow length relative to ATR to filter for only significant hammers (shadow > 1.5x ATR)
- Combine with options flow: large call buying during the hammer session confirms institutional positioning
Institutional Perspective
Institutional algorithms are programmed to buy at key support levels when hammers form. The confirmation candle is where they add to positions, and their buying creates the strong follow-through that makes this pattern work.
Fun Facts
- The hammer is the most recognized single-candle pattern worldwide and is usually the first pattern taught to new traders.
- Research shows that confirmed hammers at the 200-day SMA have a win rate above 70%, making them one of the most reliable setups in technical analysis.
- In Japanese culture, the hammer shape (Karakasa umbrella) was considered a symbol of protection, fitting for a pattern that protects against further downside.
Frequently Asked Questions
Standalone hammers fail about 40% of the time. Adding a confirmation candle that closes above the hammer high improves the win rate to approximately 65%. The one-day delay in entry is a small price to pay for the significant improvement in reliability.
Yes. A hammer can have either a bullish or bearish body. However, a bullish body (close above open) is slightly more reliable because it shows buyers won the session outright. A bearish body still qualifies as long as the lower shadow is at least 2x the body length.