Overview
Bullish Inverted Hammer
Tohba (倒バ)
Also known as: Inverse Hammer, Gravestone Reversal at Bottom
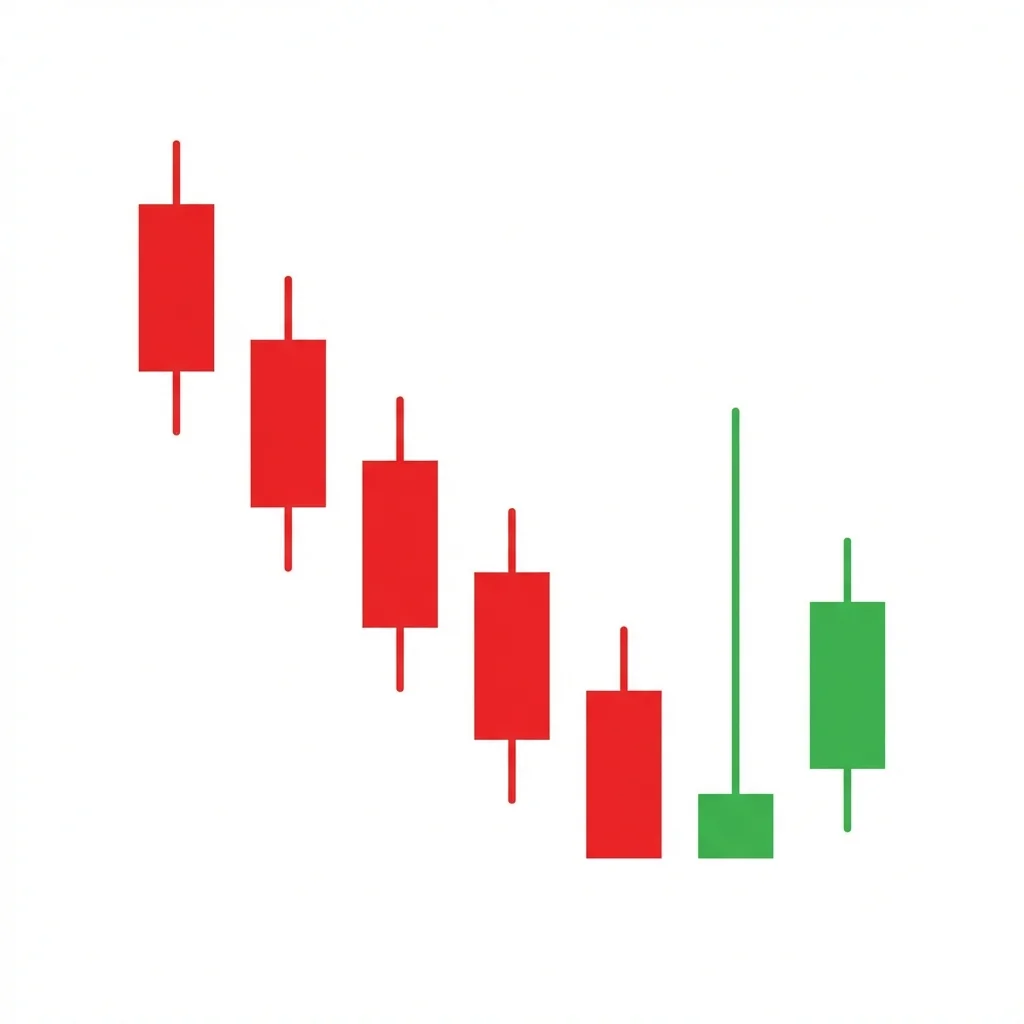
The Inverted Hammer is a single-candle bullish reversal pattern appearing at the bottom of downtrends. Its long upper shadow shows buyers attempted to push price higher, hinting that the selling pressure may be ending.
The Inverted Hammer forms during a downtrend and has a small body near the low with a long upper shadow. While it may seem counterintuitive as a bullish signal (the upper shadow shows rejection of higher prices), the key insight is that buyers were willing to push price significantly higher during the session. In the context of a downtrend, this buyer aggression is noteworthy. The pattern requires confirmation — typically a bullish candle closing above the inverted hammer's body — because the long upper shadow alone could indicate continued selling.
History & Etymology
The Inverted Hammer is part of the traditional Japanese candlestick repertoire. It was distinguished from the shooting star (its bearish counterpart that appears at tops) by Steve Nison, who emphasized the critical importance of context in candlestick interpretation.
The name describes the visual: it looks like a hammer held upside down, with the 'handle' pointing upward (the long upper shadow) and the 'head' at the bottom (the small body).
How It Forms
Formation Steps
- 1Small real body near the low of the candle
- 2Long upper shadow at least 2-3 times the body length
- 3Little to no lower shadow
Prerequisites
- Established downtrend
- Small body at or near the candle's low
- Upper shadow at least twice the body length
Confirmation Signals
- Next candle closes above the inverted hammer's high
- Gap up on the following candle
- Increased volume on the confirmation candle
Invalidation Signals
- Next candle closes below the inverted hammer's low
- Continued selling pressure after the pattern
- No bullish follow-through within 2-3 bars
Candle Breakdown
Inverted Hammer
A candle with a small body near its low and a long upper shadow, appearing at the bottom of a downtrend
Buyers attempted to push price significantly higher during the session. Although sellers pushed it back down, the buying attempt itself is significant in a downtrend.
Psychology
The Inverted Hammer shows that despite the prevailing downtrend, buyers had the strength to push price significantly higher intraday. While sellers regained control by the close, this buying attempt signals potential exhaustion of the downtrend.
Buyer Perspective
Buyers made a strong intraday push, indicating willingness to fight the downtrend. Even though they lost the session battle, their aggression hints at a potential turning point.
Seller Perspective
Sellers pushed price back down from the intraday high, but their inability to close the candle at the session's low shows diminishing conviction.
Smart Money Action
The long upper shadow may represent institutional testing of higher prices — probing whether sell orders thin out above. If they do, a reversal is imminent.
Retail Trader Trap
Retail bears see the upper shadow rejection as bearish, potentially adding to shorts, only to be caught by the confirmation candle breaking higher.
Emotional Cycle
Trading Strategy
Aggressive Entry
Enter long at the close of the inverted hammer with a stop below its low.
Conservative Entry
Wait for the next candle to close above the inverted hammer's high, confirming the reversal.
Previous swing high or 1:1 risk-reward.
2:1 risk-reward or next resistance zone.
The high of the inverted hammer's upper shadow extended upward.
Best Conditions
- Timeframe: daily
- Timeframe: 4h
- Timeframe: weekly
- oversold conditions
- at support levels
- after extended downtrend
- Asset: stocks
- Asset: forex
- Asset: crypto
- Asset: commodities
Avoid When
- Timeframe: 1m
- Timeframe: 5m
- strong downtrend with momentum
- approaching support in a crash
- low liquidity
Confluence Factors
- Pattern at a key support level
- RSI oversold or showing bullish divergence
- Near a major moving average
- Fibonacci support level alignment
- Volume spike on the inverted hammer
Scale In Strategy
Enter 50% on confirmation, add 50% on the first pullback that holds above the inverted hammer's low.
Scale Out Strategy
Take one-third at each profit target, trail the remainder.
Risk Management
Volume Analysis
Volume Confirmation
High volume on the inverted hammer suggests genuine buying interest. Volume increase on confirmation candle is ideal.
Volume Profile
Above-average volume validates the intraday buying attempt.
Volume Divergence
Low volume on the inverted hammer reduces the pattern's significance.
Technical Confluence
Support Resistance
Most effective at established support levels where buyers are expected to appear.
Fibonacci Levels
Strong at the 50% or 61.8% Fibonacci retracement levels.
Moving Averages
Pattern near the 200-day MA adds significant weight to the reversal signal.
Rsi Confirmation
RSI below 30 or showing bullish divergence significantly improves reliability.
Macd Confirmation
MACD histogram flattening or positive crossover near the pattern is bullish.
Bollinger Bands
Inverted hammer at or below the lower Bollinger Band suggests an oversold bounce.
Vwap
Below VWAP with subsequent reclaim adds intraday confirmation.
Ichimoku Cloud
Pattern below the cloud with a Tenkan-Kijun cross provides support for the reversal.
Elliott Wave
Often appears at the end of Wave 5 or Wave C terminations.
Wyckoff Phase
Can form during the selling climax or spring phase of accumulation.
Market Profile
Pattern at the Value Area Low or naked Point of Control adds confluence.
Order Flow
Buy-side aggression visible during the upper shadow confirms genuine interest.
Open Interest
Stable or declining open interest on the pattern suggests short-covering potential.
Multi-Timeframe Analysis
Higher Timeframe Alignment
A daily inverted hammer at weekly support is a strong reversal signal.
Lower Timeframe Entry
After the daily inverted hammer, use the 4H or 1H chart to find the exact confirmation entry.
Timeframe Confluence
Inverted hammers on both daily and 4H charts at the same price level increase conviction.
Top-Down Approach
Identify weekly support, look for daily inverted hammer, enter on 4H confirmation.
Statistics
Historical Examples
Gold Inverted Hammer at Support
successGold formed an inverted hammer at the $1,620 support level. The next day confirmed with a strong bullish candle, and gold rallied to $1,730 over the following weeks.
Lesson: Inverted hammers at major commodity support levels can signal significant reversals.
Netflix Failed Inverted Hammer
failureNetflix formed an inverted hammer after a major earnings miss. However, the next candle broke lower, and the pattern failed as fundamental selling continued.
Lesson: Candlestick patterns are overridden by major fundamental catalysts. Always check the news before trading.
Variations
Bullish Inverted Hammer with Gap Down
The inverted hammer gaps down from the prior candle, showing initial weakness before the buying attempt.
Long-Legged Inverted Hammer
An inverted hammer with an exceptionally long upper shadow (4x+ body size).
Confusion Matrix
Patterns commonly confused with Bullish Inverted Hammer and how to distinguish them.
Bearish Shooting Star
9500% similarContext is everything. If the candle appears after a downtrend, it's an inverted hammer (bullish). After an uptrend, it's a shooting star (bearish).
Key Differences
- Shooting star appears at the top of an uptrend; inverted hammer at the bottom of a downtrend
- Same candle shape but opposite context and meaning
Bullish Hammer
7000% similarThe shadow direction is opposite. Hammer: long lower shadow. Inverted Hammer: long upper shadow.
Key Differences
- Hammer has a long lower shadow; inverted hammer has a long upper shadow
- Both are bullish reversal signals at downtrend bottoms
The shooting star is a single-candle bearish reversal pattern with a small body near the low and a long upper shadow. It shows that buyers pushed price significantly higher during the session but sellers drove it back down, signaling a potential top.
The Bullish Doji Star is a two-candle pattern where a doji gaps below a bearish candle, signaling that selling momentum has stalled and a potential reversal is forming.
The Dragonfly Doji is a powerful single-candle reversal signal where sellers push price significantly lower during the session, but buyers fight back to close at the opening level, creating a T-shaped candle that signals complete rejection of lower prices.
The Bullish Engulfing is one of the most popular and reliable two-candle reversal patterns. A large bullish candle completely engulfs the prior bearish candle body, signaling a decisive shift from selling to buying control.
The Bullish Takuri is a single-candle reversal pattern characterized by an extremely long lower shadow and a tiny body near the candle's high. It is a stronger version of the hammer, indicating aggressive rejection of lower prices and a high probability of trend reversal.
The Bearish Belt Hold is a single bearish candle that opens at its high and closes near its low with a long body, indicating that sellers dominated from the opening bell and controlled price action throughout the session.
Pro Tips & Common Mistakes
Pro Tips
- Always wait for the confirmation candle — the inverted hammer alone has a high false signal rate
- A bullish (green) inverted hammer body is slightly more reliable than a bearish (red) one
- The longer the upper shadow relative to the body, the more significant the buying attempt
- Volume matters — high volume on the inverted hammer validates the buying interest
- The pattern is essentially a failed attempt at a shooting star, which makes it bullish in context
Common Mistakes
- Confusing it with a shooting star — context (uptrend vs downtrend) determines the pattern
- Entering without waiting for confirmation, leading to premature entries
- Ignoring the prior trend requirement — the pattern is meaningless without a preceding downtrend
- Placing stops too tight above the body instead of below the candle's low
- Treating it as a high-probability signal when it's actually moderate reliability
Advanced Techniques
- Use the upper shadow as a price target indicator — the high of the shadow is often retested
- Combine with order flow to verify that the upper shadow represents genuine buying, not a liquidity sweep
- Look for an inverted hammer followed by an engulfing candle for a compound reversal signal
- Use the candle's body as a key level — price closing above it on the next bar is initial confirmation
Institutional Perspective
Institutions view the inverted hammer's upper shadow as a probe of sell-side depth. If the probe reveals thin resistance, they may begin accumulating on the next session's open. The confirmation candle breaking above the shadow's high often triggers algorithmic buy programs.
Fun Facts
- The inverted hammer and shooting star are identical in appearance — only the market context (downtrend vs uptrend) determines which name applies.
- Statistically, a green (bullish close) inverted hammer has a slightly higher success rate than a red (bearish close) one.
- The inverted hammer is sometimes called a 'reverse hammer' but this is technically incorrect — 'inverted' is the standard term.
Frequently Asked Questions
The inverted hammer is bullish when it appears at the bottom of a downtrend. The same candle shape at the top of an uptrend is called a shooting star and is bearish. Context determines the signal.
Although the upper shadow shows that buyers were pushed back, the key insight is that buyers had the strength to rally price significantly during the session. In a downtrend, this buying aggression hints at a potential reversal.
Yes. The inverted hammer is a moderate-reliability signal that strongly benefits from confirmation — typically a bullish candle closing above the inverted hammer's body or high on the next session.