Overview
Bearish Three Black Crows
Sanba Garasu
Also known as: Three Black Crows, Three Crows, Identical Three Crows
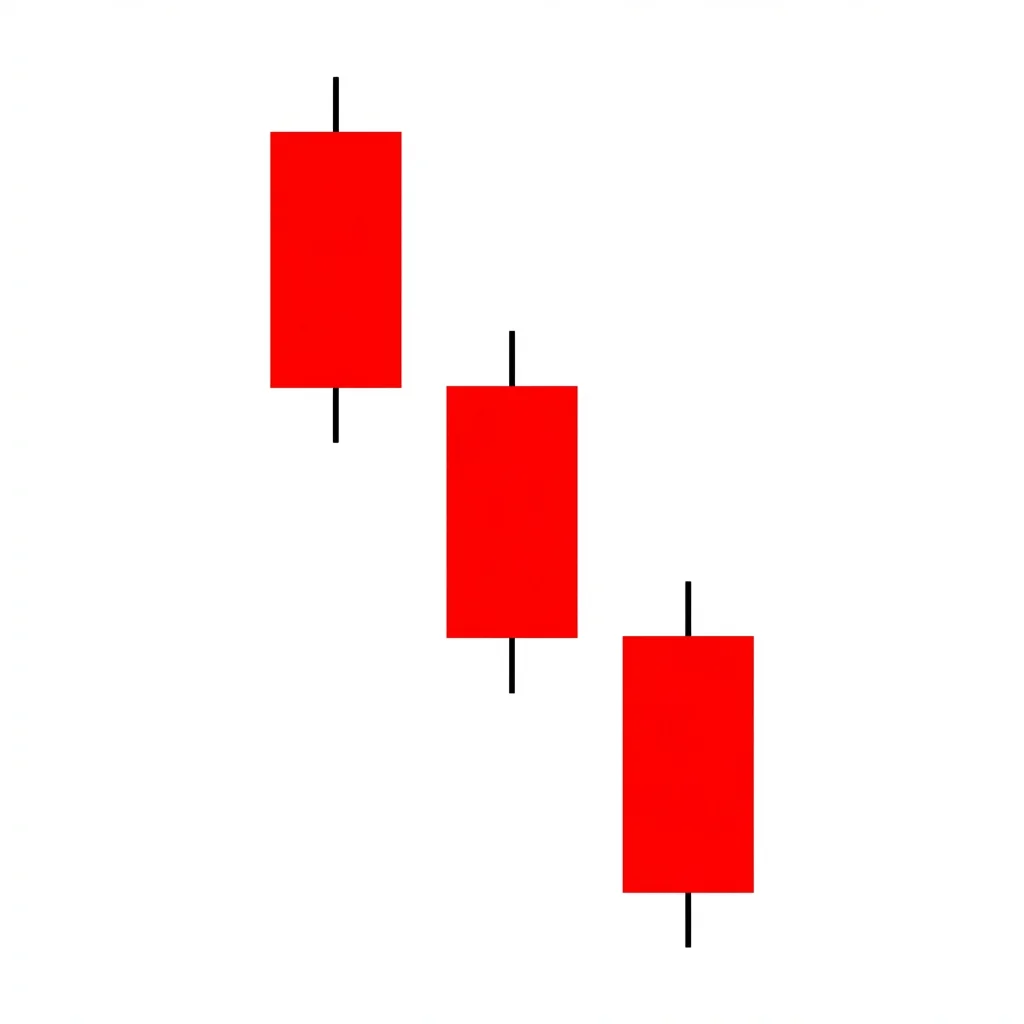
Three black crows is a powerful bearish reversal pattern consisting of three consecutive long bearish candles, each opening within the prior candle's body and closing near its low. It signals strong, persistent selling pressure and a likely trend reversal.
Three black crows is one of the most widely recognized and respected bearish candlestick patterns. It consists of three consecutive long-bodied bearish candles that each open within the body of the preceding candle and close at or near their lows. The progressive decline with no significant bounces demonstrates that sellers have taken decisive control. The pattern is named after crows sitting on a tree branch—in Japanese culture, crows are omens of bad news. The pattern is most significant when it appears after an uptrend or at resistance, signaling that bullish momentum has been conclusively broken. Each candle should be roughly similar in size, and the lack of lower shadows (close near the low) indicates that sellers maintained control throughout each session without any meaningful pushback from buyers.
History & Etymology
The three black crows is one of the oldest patterns in Japanese candlestick analysis, dating back to the 18th-century rice markets. It was considered a strong warning signal by Japanese traders, and the crow metaphor (crows being omens of misfortune) reflected the severity of the bearish signal. Steve Nison popularized the pattern in the West.
'Three' refers to the three candles. 'Black' is the traditional Japanese color for bearish candles. 'Crows' is a metaphor—in Japanese folklore, crows are associated with bad omens and misfortune, appropriate for a bearish reversal signal.
How It Forms
Formation Steps
- 1First candle is a long bearish candle closing near its low
- 2Second candle opens within the body of the first candle and closes lower near its low
- 3Third candle opens within the body of the second candle and closes even lower near its low
- 4Each candle progressively closes lower, creating a staircase of bearish candles
Prerequisites
- Prior uptrend or rally
- Each candle should have a long real body
- Each candle should close at or near its session low
Confirmation Signals
- Fourth candle continues lower
- Volume increases on each successive candle
- No significant lower shadows (closes near the lows)
Invalidation Signals
- A strong bullish candle immediately follows the three crows
- Volume decreases across the three candles
- Significant lower shadows showing buying support
Candle Breakdown
First Crow
A long bearish candle that opens within or above the prior bullish candle and closes near its low, marking the beginning of the reversal.
The first major signal that sellers have arrived. The long body and close near the low show that selling pressure lasted all session.
Second Crow
Opens within the first crow's body and closes lower near its own low, confirming persistent selling.
Selling pressure is not a one-day event—it persists. Buyers who hoped the first day was a fluke are now worried.
Third Crow
Opens within the second crow's body and closes lower near its low, completing the three-candle reversal with emphatic selling.
Three consecutive days of relentless selling eliminates any remaining bullish hope. The pattern commands respect.
Psychology
Three black crows represent a sustained, decisive shift from bullish to bearish sentiment over three consecutive sessions. The absence of recovery attempts makes this one of the most psychologically impactful reversal signals.
Buyer Perspective
Buyers watch helplessly as three straight sessions close near their lows with no bounces. Each day deepens their losses and erodes their confidence. By the third day, most have capitulated.
Seller Perspective
Sellers are emboldened by each successive day of lower prices. The pattern gives them conviction that the trend has changed, encouraging them to add to short positions.
Smart Money Action
Institutional selling programs execute over multiple days, creating the three-candle pattern. The persistent selling without allowing bounces shows controlled, deliberate distribution.
Retail Trader Trap
Retail traders who hold through the first candle hoping for a bounce are trapped as the pattern continues for two more sessions.
Emotional Cycle
Trading Strategy
Aggressive Entry
Enter short at the close of the second crow, anticipating the third.
Conservative Entry
Wait for the three crows to complete, then enter on the fourth candle or on a pullback.
Equal to the total height of the three crows projected downward
Next major support level
2x the three-crows height for extended moves
Best Conditions
- Timeframe: 1D
- Timeframe: 1W
- Timeframe: 4h
- After extended rallies
- At major resistance
- Earnings season
- Asset: Stocks
- Asset: Indices
- Asset: Crypto
- Asset: Forex
Avoid When
- Timeframe: 1m
- Timeframe: 5m
- Strong bull markets with momentum
- Low-volume environments
Confluence Factors
- Pattern occurs at a resistance level
- Increasing volume across the three candles
- RSI falling from overbought
- Moving average death cross forming
- Bearish divergence on MACD
Scale In Strategy
Enter initial position after the third crow, add on pullbacks that hold below the first crow's body.
Scale Out Strategy
Take 50% at the measured move, trail the rest with the 20 EMA.
Risk Management
Volume Analysis
Volume Confirmation
Increasing volume across the three candles is ideal—each crow should have equal or higher volume than the previous one.
Volume Profile
Heavy volume concentrated in the body of each candle (not the shadows) confirms genuine selling.
Volume Divergence
Decreasing volume across the three candles suggests the selling may exhaust, reducing the pattern's reliability.
Technical Confluence
Support Resistance
The top of the first crow becomes a strong resistance level. The bottom of the third crow is the initial support test.
Fibonacci Levels
The pattern often begins at a Fibonacci extension level of the prior rally, adding context to the reversal.
Moving Averages
Three black crows often break below the 20 EMA, with the EMA then acting as resistance.
Rsi Confirmation
RSI dropping sharply from above 70 during the three crows confirms the overbought reversal.
Macd Confirmation
MACD crossing below the signal line and the histogram turning negative during the pattern confirms the momentum shift.
Bollinger Bands
Price moving from above the upper band to below the middle band during the three crows signals a significant shift.
Vwap
Price crossing below VWAP on the second or third crow confirms the intraday trend change.
Ichimoku Cloud
Three crows breaking below the Tenkan-sen and approaching the Kijun-sen adds Ichimoku confirmation.
Elliott Wave
Three black crows often mark the beginning of a corrective wave after a completed 5-wave impulse.
Wyckoff Phase
Can signal the transition from distribution to markdown in the Wyckoff cycle.
Market Profile
The pattern creates a series of lower value areas on consecutive days, confirming the downward rotation.
Order Flow
Three consecutive days of net selling (negative delta) is a powerful order flow confirmation.
Open Interest
Monitor open interest changes for additional confirmation of institutional participation in the move.
Multi-Timeframe Analysis
Higher Timeframe Alignment
Daily three black crows at a weekly resistance level is one of the strongest bearish setups available.
Lower Timeframe Entry
Use the 4H chart to identify the optimal entry after the daily three crows complete—look for a pullback to the midpoint of the third crow.
Timeframe Confluence
Three crows on the daily chart confirmed by a weekly bearish candle provides extremely high conviction.
Top-Down Approach
Weekly resistance > Daily three black crows > 4H entry on pullback.
Statistics
Historical Examples
Dow Jones Three Black Crows 2020
successThe Dow formed three black crows at the onset of the COVID crash, with each day declining 3%+. The pattern preceded a 37% crash over the next month.
Lesson: Three black crows during a fundamental crisis can signal the beginning of a historic sell-off.
Bitcoin Three Black Crows at $64,000
successBTC formed three black crows after reaching $64,000, with each candle dropping 5%+. The pattern preceded a crash to $30,000 over the next two months.
Lesson: Three black crows in crypto at all-time highs can signal the beginning of severe corrections.
Variations
Identical Three Crows
Each candle opens exactly at the prior candle's close price.
Three Crows with Volume Climax
The third crow has the highest volume of the three, suggesting a selling climax.
Confusion Matrix
Patterns commonly confused with Bearish Three Black Crows and how to distinguish them.
Bearish Identical Three Crows
9000% similarCheck the opening prices: if each candle opens exactly at the prior candle's close, it is identical three crows. If they open within the body (but not at the close), it is standard three black crows.
Key Differences
- Identical three crows require each candle to open exactly at the prior close
- Standard three crows allow the open to be within the prior body
- Identical version is rarer but slightly more bearish
Bearish Three Declining Soldiers
7000% similarCompare the body sizes: if all three are similar and long, it is three black crows. If the bodies get progressively smaller, it is three declining soldiers.
Key Differences
- Three declining soldiers have progressively smaller bodies
- Three black crows have similar-sized long bodies
- Declining soldiers suggest weakening momentum
The Bearish Engulfing is one of the most powerful and commonly traded two-candle reversal patterns. A large bearish candle completely engulfs the prior bullish candle, demonstrating a decisive shift from buying to selling dominance.
The identical three crows pattern consists of three bearish candles where each opens at or near the previous candle's close, creating a staircase-like decline. It is a stronger variant of the three black crows with more specific opening criteria.
Three declining soldiers feature three consecutive bearish candles with progressively smaller bodies, indicating that while selling continues, its momentum is weakening. The pattern signals a reversal but with less conviction than three black crows.
Three White Soldiers is one of the strongest bullish reversal patterns: three consecutive long bullish candles with progressively higher closes, each opening within the prior candle's body, signaling a powerful shift from bearish to bullish sentiment.
The Bearish Abandoned Baby is one of the rarest and most reliable top reversal patterns in candlestick analysis. It features a doji that is completely isolated by gaps on both sides, signaling an abrupt and dramatic shift from buying to selling pressure.
The Bearish Advance Block shows three consecutive bullish candles with progressively smaller bodies and longer upper shadows, signaling that buying momentum is weakening and a reversal or consolidation is likely.
Pro Tips & Common Mistakes
Pro Tips
- The pattern is most powerful when all three candles close within the lower 25% of their ranges—no significant lower shadows.
- Increasing volume across the three candles adds significant conviction. Decreasing volume weakens the signal.
- After three black crows, a minor bounce is common. Use this bounce as a better entry rather than chasing the sell-off.
- The pattern at the end of a five-wave Elliott impulse is one of the highest probability reversal signals in all of technical analysis.
- Three black crows on a weekly chart are rare but devastating—respect them as major trend change signals.
Common Mistakes
- Accepting candles with long lower shadows as valid crows—each should close near its low
- Not requiring long bodies—small-bodied candles weaken the pattern significantly
- Entering too late, after the pattern has already produced a large move
- Ignoring the trend context—three bearish candles in a strong uptrend may just be a pullback
- Not using a stop loss because the pattern 'always works'—it fails 28% of the time
Advanced Techniques
- Measure the average body size of the three crows—if the third is significantly smaller, momentum may be waning (advance block variation).
- Combine with options strategies: sell call spreads above the first crow's high for defined-risk bearish exposure.
- Use the pattern as a signal to examine the broader market—three black crows in a major index often precede sector-wide weakness.
- In futures markets, check open interest: increasing open interest during the three crows confirms new short positions are being established.
Institutional Perspective
Three black crows represent three consecutive sessions of institutional selling. The persistent close-near-the-low signature shows that sell programs ran through the entire session without any significant algorithmic buying to halt the decline.
Fun Facts
- In Japanese culture, crows are messengers of the gods, but their appearance in the candlestick world is decidedly negative—they bring the 'message' of a bearish reversal.
- The three black crows pattern has been backtested extensively and consistently ranks among the top 5 most reliable bearish reversal patterns.
- During the 2008 financial crisis, three black crows appeared on multiple major indices simultaneously in September, marking the beginning of the crash.
Frequently Asked Questions
Three black crows are three consecutive long bearish candles, each opening within the prior candle's body and closing near its session low. The pattern signals a strong bearish reversal after an uptrend.
The three black crows has an approximate 72% win rate, making it one of the most reliable bearish reversal patterns. It is especially powerful at resistance levels with increasing volume.
Three black crows are three standalone bearish candles. Three inside down starts with a bullish candle, followed by a bearish harami, and then a bearish confirmation candle. They are structurally very different patterns.