Overview
Bearish Buying Climax
Also known as: Buying Climax, BC, Volume Climax Top, Blow-Off Top
The Buying Climax is a Wyckoff concept describing the final blow-off top where extreme volume and wide price spreads signal that all remaining demand has been absorbed, leaving the market vulnerable to a sharp reversal and the beginning of distribution.
The Buying Climax (BC) is a cornerstone concept in Wyckoff methodology. It represents the moment when a rising market reaches a fever pitch of speculative buying. Price surges sharply — often parabolically — on the highest volume of the entire rally. This extreme volume represents the final wave of demand: retail FOMO buying, short covering, and momentum chasing all converging at once. Smart money uses this climactic demand to offload massive positions into willing buyers. The result is that all available demand is consumed in a short period, leaving no buyers remaining above the climax level. Price then reverses sharply in what Wyckoff called the 'Automatic Reaction' (AR). The BC and AR together establish the boundaries of the distribution range that typically follows, where institutions slowly sell their remaining positions before the markdown phase begins.
History & Etymology
The Buying Climax concept was developed by Richard Wyckoff in the 1930s as part of his comprehensive market methodology. Wyckoff observed that major market tops were preceded by extreme volume and wide price spreads as the 'composite operator' (institutional smart money) distributed their holdings into peak public demand. The concept has been validated repeatedly at major market tops, from the 1929 crash to the 2000 dot-com bubble to the 2021 meme stock mania.
The term 'buying climax' describes the climactic peak of buying activity. Just as a dramatic climax is the peak moment of tension, the Buying Climax is the peak of buying pressure — after which all energy is spent and the trend reverses. The word 'climax' implies that this is the final, most intense phase.
How It Forms
Formation Steps
- 1Price accelerates sharply upward, often parabolically, in the final stage of an uptrend
- 2Volume spikes to the highest levels of the entire rally — often 3-5x average
- 3The price range widens dramatically (wide-range candle or series of wide candles)
- 4Price reverses sharply from the peak, often closing near the low of the session
- 5Follow-through selling occurs on the subsequent bars
Prerequisites
- Extended uptrend preceding the climax
- Accelerating price movement in the final phase
- Extreme volume spike — the highest of the entire rally
- Wide price spread (range) on the climax bar
Confirmation Signals
- Price closes in the lower half of the climax bar's range
- The next bar closes below the climax bar's low
- Volume remains elevated on the reversal
- The Automatic Reaction (AR) follows within 1-5 bars
Invalidation Signals
- Price consolidates above the climax high and continues higher
- Volume was not significantly elevated relative to the trend
- Price makes a new high on even higher volume shortly after
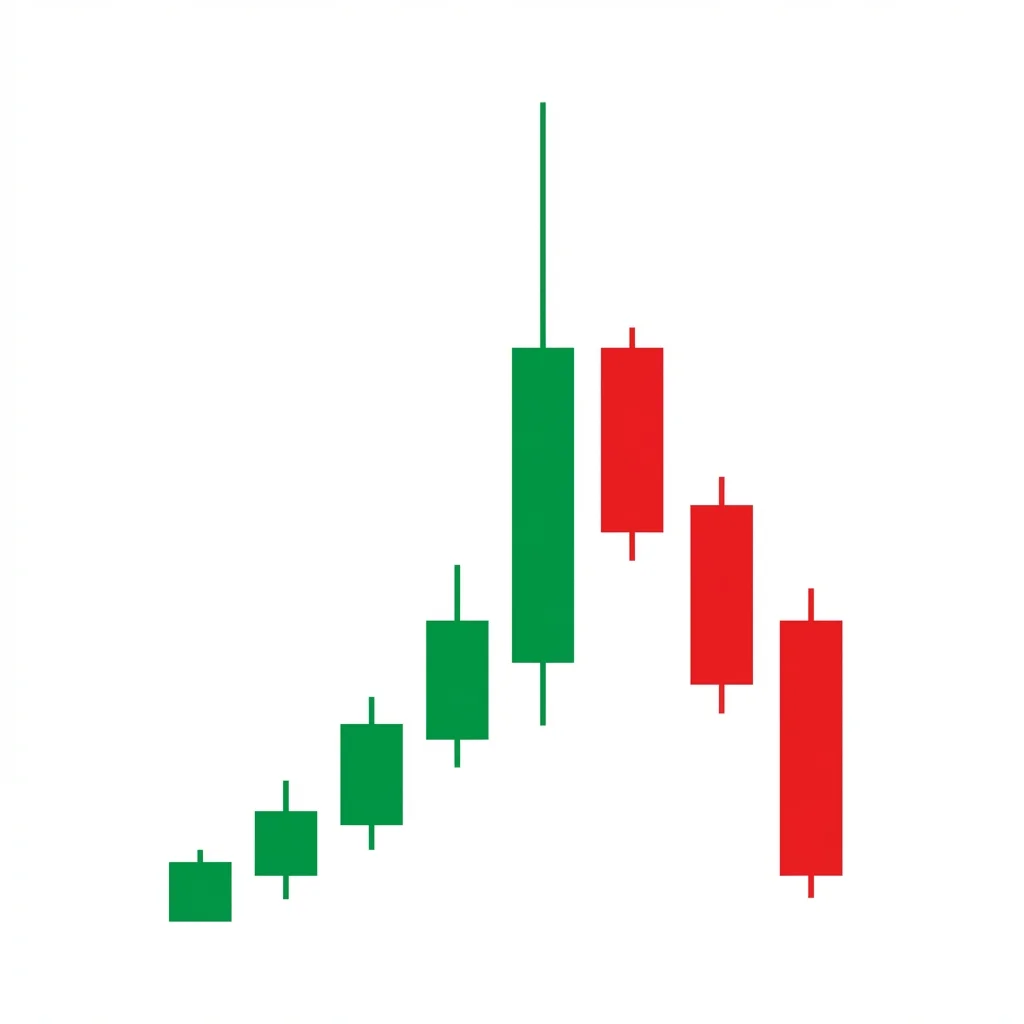
Candle Breakdown
Pre-Climax Acceleration
One or more candles showing accelerating upward momentum with increasing volume and widening price ranges.
Greed and FOMO intensify. Late buyers enter aggressively. Media coverage attracts the public. Parabolic price action feels unstoppable.
Climax Bar
The widest-range candle on the highest volume. Price often opens strong but closes in the lower portion of its range, creating a long upper shadow.
Maximum euphoria at the open. The volume represents the final surge of buying. Smart money sells aggressively into this demand. The close near the low shows supply overwhelming demand.
Automatic Reaction
A sharp bearish candle or series of candles following the climax. This is Wyckoff's Automatic Reaction (AR) — the natural consequence of exhausted demand.
Panic. Buyers from the climax are immediately underwater. Early sellers take profits. The lack of remaining buyers causes price to fall rapidly.
Psychology
The Buying Climax captures the moment of maximum public optimism, which paradoxically signals the end of the rally. It demonstrates that markets top on the greatest excitement and bottom on the greatest despair.
Buyer Perspective
Buyers are in a state of euphoria. They believe the rally will continue forever and fear missing out. The extreme volume represents their collective desperation to participate. They are buying at the worst possible prices from sellers who have been waiting for this moment.
Seller Perspective
Smart money sellers have been waiting for this moment. The extreme volume provides the liquidity they need to exit enormous positions without crashing the market. Each buy order is met with institutional selling. By the close, smart money has largely exited or is net short.
Smart Money Action
Institutions have been distributing throughout the uptrend but save their largest selling for the Buying Climax. The extreme public demand at the top provides the perfect exit opportunity. Some institutions actively encourage the climax by placing visible buy orders early in the session before switching to aggressive selling.
Retail Trader Trap
The Buying Climax is the ultimate retail trap. The most volume, the most media attention, and the strongest price action all converge to pull in the maximum number of retail buyers at the worst possible moment. Many retail traders will point to the strong volume as 'confirmation' of the move, not understanding that climactic volume signals exhaustion, not continuation.
Emotional Cycle
Trading Strategy
Aggressive Entry
Short when the climax bar closes in its lower third with extreme volume, without waiting for further confirmation.
Conservative Entry
Wait for the Automatic Reaction (a bearish candle closing below the climax bar's low) before entering short.
The start of the parabolic acceleration (where the trend steepened).
The 50% retracement of the entire rally that preceded the climax.
The origin of the uptrend — the swing low that started the entire move.
Best Conditions
- Timeframe: daily
- Timeframe: weekly
- Timeframe: 4h
- end of extended uptrend
- speculative mania
- meme stock rallies
- cryptocurrency bubbles
- Asset: stocks
- Asset: crypto
- Asset: commodities
Avoid When
- Timeframe: 1m
- Timeframe: 5m
- steady institutional accumulation
- low-volatility grind higher
Confluence Factors
- Extreme RSI (above 80)
- Price far above all major moving averages
- Media coverage at peak levels
- Social media sentiment at euphoric levels
- Parabolic price acceleration preceding the climax
- Record margin debt or leverage in the market
Scale In Strategy
Enter 33% on the climax bar close, add 33% on AR confirmation, add 34% on the first lower high.
Scale Out Strategy
Take 25% at the parabolic acceleration start, 25% at the 50% retracement, trail 50% with the 20 EMA.
Risk Management
Volume Analysis
Volume Confirmation
Volume MUST be extreme — the highest of the entire rally, ideally 3-5x the 20-day average. Without extreme volume, it is not a true Buying Climax.
Volume Profile
The volume profile should show a massive spike at the top with a rapid drop-off. This indicates all demand was consumed in a short period.
Volume Divergence
Price making higher highs on declining volume leading up to the climax, followed by the volume spike, is the classic divergence-then-climax pattern.
Technical Confluence
Support Resistance
The climax high becomes the ultimate resistance level. The AR low establishes initial support. These two levels define the upcoming distribution trading range.
Fibonacci Levels
After the climax, target the 38.2%, 50%, and 61.8% retracements of the rally. The AR typically reaches the 38.2% level.
Moving Averages
During a BC, price is typically far above all moving averages. The 20 EMA becomes the first target, and the 50 and 200 MAs become subsequent targets.
Rsi Confirmation
RSI above 80 during the climax, followed by a sharp RSI reversal, is textbook. Some BCs show RSI above 90.
Macd Confirmation
MACD makes its highest reading of the trend at the climax, then begins declining sharply. A bearish MACD crossover after the BC confirms the reversal.
Bollinger Bands
Price blowing through the upper Bollinger Band by 2+ standard deviations is common during a BC. The reversion to the mean (middle band) is the natural resolution.
Vwap
On the climax day, price opens above VWAP and may stay above it, but the close near the low of the range shows that the VWAP-weighted average buyer is already losing money.
Ichimoku Cloud
The BC pushes price far above all Ichimoku lines. The subsequent correction typically targets the Kijun-sen first, then the Kumo cloud.
Elliott Wave
The Buying Climax represents the exhaustion of Wave 5 or the end of Wave 3 (the extended wave). It is the blow-off top that terminates the impulse.
Wyckoff Phase
The BC is the first event in the Wyckoff Distribution schematic. It is followed by the Automatic Reaction (AR), then the Secondary Test (ST), then distribution proper.
Market Profile
The BC creates a very long TPO range with single prints at the extremes — a B-shaped profile indicating buying excess.
Order Flow
Delta (buy volume minus sell volume) may show a positive spike at the climax that immediately turns negative. Large passive sells absorbing aggressive buys is the key footprint.
Open Interest
In futures, record open interest at the climax confirms maximum speculation. Declining OI after the climax shows positions being closed.
Multi-Timeframe Analysis
Higher Timeframe Alignment
A weekly Buying Climax is a major structural event that can signal a multi-month trend reversal. A monthly BC is generational.
Lower Timeframe Entry
After the daily BC, use the 1-hour chart to identify the distribution range and find re-entry points on Secondary Tests.
Timeframe Confluence
A daily BC occurring while the weekly chart shows extreme RSI and parabolic extension is the highest-conviction setup.
Top-Down Approach
Monthly: parabolic extension. Weekly: overbought. Daily: Buying Climax forms. 4H: trade the distribution range.
Statistics
Historical Examples
GameStop (GME) Buying Climax January 2021
successGME surged from $20 to $483 in a few weeks, with volume on the climax day reaching over 90 million shares (vs. a typical 5 million). The stock collapsed 90% in the following weeks as the buying climax exhausted all demand.
Lesson: The meme stock mania created one of the most extreme Buying Climaxes in market history. The 1,800% volume increase was a textbook signal that all demand was being consumed.
Crude Oil Buying Climax in 2008
successCrude oil spiked to $147 per barrel on massive volume after a parabolic rally. The Buying Climax marked the exact top. Oil fell 78% to $32 over the next six months.
Lesson: Commodity Buying Climaxes at the end of speculative bubbles can produce the most extreme reversals. The parabolic acceleration and extreme volume were textbook Wyckoff signals.
Variations
Blow-Off Top
An extreme Buying Climax where price goes parabolic (near-vertical) before collapsing. Volume is 5-10x average.
Rolling Buying Climax
Multiple climax-like volume spikes over several sessions, each failing to push price significantly higher.
Confusion Matrix
Patterns commonly confused with Bearish Buying Climax and how to distinguish them.
Bearish Climax Reversal
8000% similarThe Buying Climax MUST have the extreme volume characteristic — the highest of the entire rally. If volume is merely elevated, it may be a Climax Reversal but not a true BC.
Key Differences
- Climax Reversal can occur without extreme volume
- Buying Climax specifically requires the highest volume of the rally
- BC is a Wyckoff concept; Climax Reversal is a broader term
Bearish Exhaustion Gap
5500% similarIf there is a gap at the top with extreme volume, it could be both. If there is no gap but extreme volume, it is a BC. If there is a gap without extreme volume, it is an Exhaustion Gap.
Key Differences
- Exhaustion Gap involves a gap; BC does not require one
- BC focuses on extreme volume; Exhaustion Gap focuses on the gap structure
- Both signal exhaustion but through different mechanisms
The Bearish Abandoned Baby is one of the rarest and most reliable top reversal patterns in candlestick analysis. It features a doji that is completely isolated by gaps on both sides, signaling an abrupt and dramatic shift from buying to selling pressure.
A Bull Trap is a false breakout above resistance that lures buyers in before immediately reversing, trapping them at elevated prices and triggering a sharp sell-off as trapped longs are forced to exit.
The Climax Reversal is a wide-range candle that forms at the top of an uptrend, opening strong and reversing to close near the low, signaling that selling pressure has overwhelmed buying and the trend may be exhausted.
The Distribution phase is a Wyckoff concept where institutional investors systematically sell (distribute) their holdings to the public within a trading range at a market top, before the subsequent markdown (decline) begins.
The Bearish Engulfing is one of the most powerful and commonly traded two-candle reversal patterns. A large bearish candle completely engulfs the prior bullish candle, demonstrating a decisive shift from buying to selling dominance.
The shooting star is a single-candle bearish reversal pattern with a small body near the low and a long upper shadow. It shows that buyers pushed price significantly higher during the session but sellers drove it back down, signaling a potential top.
Pro Tips & Common Mistakes
Pro Tips
- The single most important characteristic of a Buying Climax is the volume. If volume is not the highest of the entire rally (by a significant margin), it is probably not a true BC.
- The Buying Climax is the START of the distribution process, not the end. After the BC and AR, expect a distribution range to form that can last weeks or months before the final markdown.
- Do not chase the short immediately. The distribution range after the BC often produces a Secondary Test (ST) that retests near the climax high — this can be a better entry point.
- Parabolic price acceleration leading into the BC is crucial context. If the price was grinding higher steadily, the volume spike may represent continuation, not exhaustion.
- Watch sentiment indicators (social media, put/call ratio, surveys). Maximum bullish sentiment at the time of a volume climax is the strongest confirmation.
Common Mistakes
- Confusing high volume in a healthy uptrend with a Buying Climax. The BC requires EXTREME volume combined with a wide price spread and subsequent reversal.
- Shorting the BC immediately without considering that a distribution range may form — the Secondary Test can take price back near the high.
- Using tight stops above the climax high — volatility at tops is extreme and tight stops will be hit frequently.
- Ignoring the Wyckoff framework. The BC is part of a larger distribution process. Understanding the full schematic improves trade management.
- Mistaking a mid-trend volume spike for a BC. The true BC occurs at the end of an extended, accelerating uptrend.
Advanced Techniques
- Use the Wyckoff distribution schematic to trade the entire post-BC phase: short at the Secondary Test (ST), add at the Upthrust (UT), and hold through the Sign of Weakness (SOW) and Last Point of Supply (LPSY).
- Monitor the Volume Spread Analysis (VSA) bars: ultra-high volume with a close in the lower third of the range is the VSA signature of a BC.
- Calculate the Effort vs. Result ratio — if volume (effort) is extreme but price gain (result) is proportionally small, supply is overwhelming demand.
- Use the heat map of options open interest to identify where maximum call buying occurred during the BC — these are the levels where maximum pain will be felt.
Institutional Perspective
For institutional traders, the Buying Climax is the ideal exit opportunity. The extreme public demand provides unlimited liquidity to sell into. Many funds have standing orders to reduce positions when volume exceeds 3x average and price is above the upper Bollinger Band. The post-BC distribution range is then used to exit remaining positions before the markdown phase.
Fun Facts
- The Buying Climax concept was developed by Richard Wyckoff over 90 years ago, yet it predicted the GameStop and meme stock tops with textbook precision in 2021.
- The largest Buying Climax in history by dollar volume may have been the overall crypto market top in November 2021, where over $100 billion traded in a single day across exchanges.
- Jesse Livermore, one of the greatest traders of all time, described the Buying Climax as 'the moment when the crowd is buying what smart men are selling' — a quote that perfectly captures the pattern.
Frequently Asked Questions
A true Buying Climax should have volume at least 3x the 20-day average, and ideally 5x or more. It must be the highest volume of the entire rally. If volume is merely 'above average,' it is not a Buying Climax.
In Wyckoff methodology, the BC is followed by the Automatic Reaction (AR), then a Secondary Test (ST) of the BC area, and then a distribution trading range. Eventually, the Sign of Weakness (SOW) and Last Point of Supply (LPSY) signal the beginning of the markdown phase.
You can, but be aware that the distribution range after the BC can last weeks or months, and the Secondary Test may take price back near the BC high. The safest entries are at the ST or after a confirmed break of the AR low.
A blow-off top is an extreme version of a Buying Climax where price goes parabolic before collapsing. All blow-off tops are Buying Climaxes, but not all BCs are blow-off tops. The BC can be less dramatic while still showing the characteristic extreme volume reversal.