Overview
Bearish Climax Reversal
Also known as: Climax Top, Exhaustion Reversal, Climactic Selling Reversal
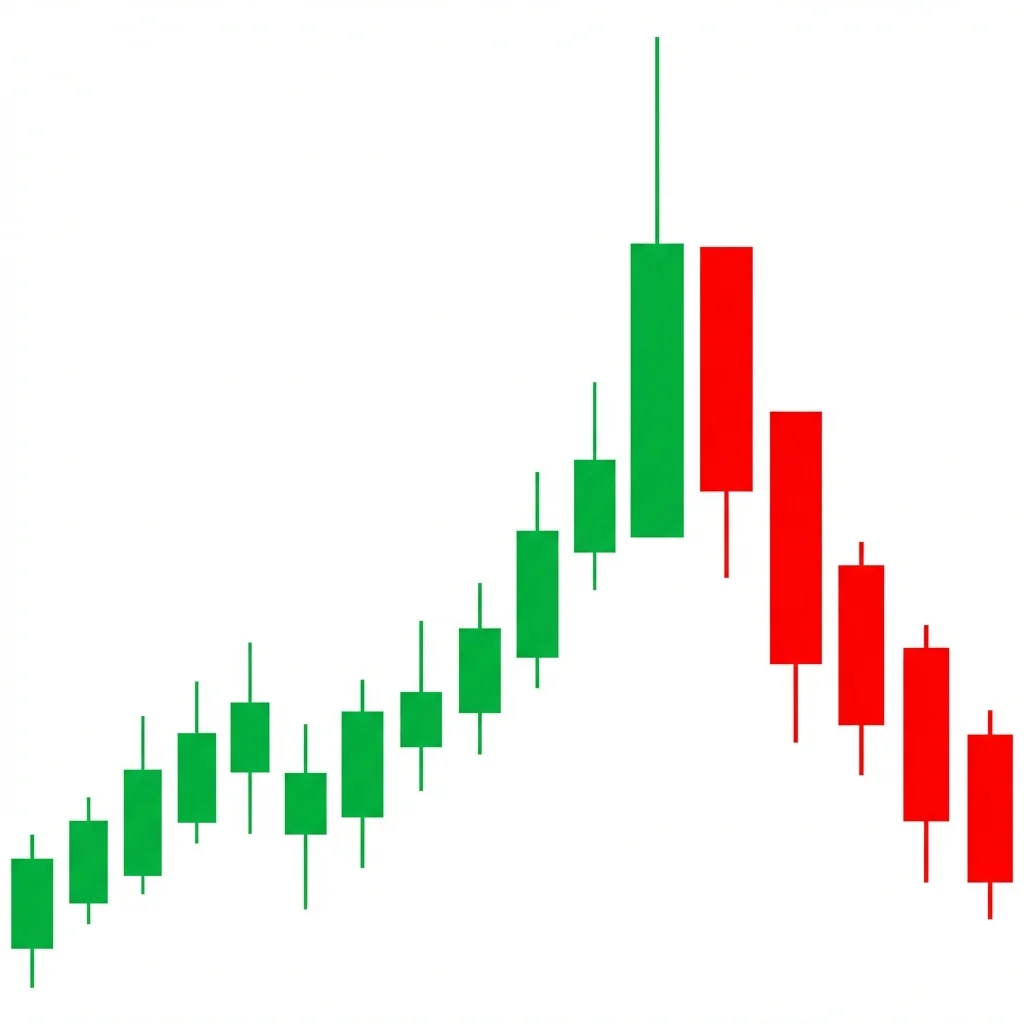
The Climax Reversal is a wide-range candle that forms at the top of an uptrend, opening strong and reversing to close near the low, signaling that selling pressure has overwhelmed buying and the trend may be exhausted.
The Bearish Climax Reversal is a dramatic single-candle or short multi-candle pattern that occurs when a trending market makes a final push higher before sellers aggressively reverse the move within the same session or over 2-3 sessions. Unlike the Buying Climax (which requires extreme volume), the Climax Reversal focuses on price action — specifically the wide range and the reversal from high to low. The candle typically opens at or near its high, pushes to new trend highs, but then reverses sharply to close in the lower third of its range. This intra-session reversal indicates that whatever buying enthusiasm existed at the open was completely overwhelmed by selling before the close. The pattern is a generalized version of more specific reversal candles like the shooting star and bearish engulfing, distinguished by the emphasis on the widened range and climactic context.
History & Etymology
The Climax Reversal concept draws from both Japanese candlestick analysis and Western technical analysis. The idea that wide-range reversal bars signal trend changes was documented by Richard Wyckoff and later refined by Tom Williams in his Volume Spread Analysis (VSA) methodology. Williams specifically categorized wide-spread down-close bars on high volume as signs of professional selling.
The term 'climax' indicates that the pattern marks the peak intensity of a trend. 'Reversal' indicates the immediate change of direction. Together, 'climax reversal' describes the peak moment where a trend exhausts itself and reverses.
How It Forms
Formation Steps
- 1A wide-range candle (or 2-3 candle sequence) that makes a new high of the trend
- 2The candle opens strong but reverses during the session to close in the lower portion of its range
- 3The range of the candle is significantly wider than recent candles (typically 2x or more)
- 4Volume is elevated but does not need to be at extreme climax levels
Prerequisites
- Extended uptrend of at least 10+ bars
- Acceleration in price prior to the climax bar
- Wide range on the reversal candle — at least 1.5x the average range
Confirmation Signals
- Close in the lower third of the candle's range
- Follow-through selling on the next bar
- Long upper shadow indicating rejection from highs
- Volume above average (though not necessarily extreme)
Invalidation Signals
- Price recovers above the climax bar's high within 2 bars
- The reversal candle is not significantly wider than average
- Strong buying resumes immediately
Candle Breakdown
Climax Reversal Bar
A wide-range candle that opens near the high, makes a new trend high, then reverses to close near the low. The range is at least 1.5-2x the average range.
The session begins with bullish enthusiasm, potentially gap-up. But as the session progresses, sellers emerge with force. The close near the low represents a complete intra-session sentiment shift from greed to fear.
Psychology
The Climax Reversal represents the decisive moment when the balance of power shifts within a single session. Buyers who were confident at the open are demoralized by the close. The wide range leaves bulls who bought earlier in the session holding significant losses.
Buyer Perspective
Buyers enter aggressively at the open, pushing price to new highs. As the session progresses, their orders are being absorbed by sellers. By the close, buyers from the first half of the session are already underwater, creating anxiety and a desire to exit.
Seller Perspective
Sellers wait for the initial bullish enthusiasm to exhaust itself, then step in with large sell orders. The wide range reversal shows their dominance. The close near the low signals they intend to press their advantage.
Smart Money Action
Institutions often trigger the initial move higher to attract retail buying at the open, then reverse the price by selling into the demand. The wide range provides them with excellent prices to distribute.
Retail Trader Trap
Retail traders buy the new high at the open, expecting continuation. The intra-session reversal catches them off guard, and by the close they are holding significant unrealized losses. Many will hold overnight hoping for a recovery that does not come.
Emotional Cycle
Trading Strategy
Aggressive Entry
Short at the close of the climax reversal candle.
Conservative Entry
Short on a break below the climax candle's low on the following bar.
The nearest support level or the 20-period moving average.
The 50% retracement of the uptrend move.
The origin (swing low) of the preceding uptrend.
Best Conditions
- Timeframe: daily
- Timeframe: weekly
- Timeframe: 4h
- after extended uptrend
- overbought conditions
- near resistance
- Asset: stocks
- Asset: indices
- Asset: commodities
- Asset: crypto
Avoid When
- Timeframe: 1m
- Timeframe: 5m
- early in a new uptrend
- strong momentum with institutional buying
Confluence Factors
- Pattern forms at a resistance level
- RSI above 70 with bearish divergence
- The climax bar range is 2x+ the average
- Volume spikes on the reversal portion
- Higher timeframe also shows overbought conditions
Scale In Strategy
Enter 50% on the climax bar close, add 50% on break of the climax bar's low.
Scale Out Strategy
Take 50% at the first support level, trail the rest with the 10 EMA.
Risk Management
Volume Analysis
Volume Confirmation
Above-average volume strengthens the signal. The higher the volume, the more significant the reversal.
Volume Profile
Volume should be concentrated in the second half of the session (during the reversal) rather than the first half (during the rally).
Volume Divergence
If volume was declining during the uptrend and spikes on the climax reversal bar, this is strong confirmation.
Technical Confluence
Support Resistance
The climax bar's high becomes a strong resistance level. The range of the bar often defines a supply zone.
Fibonacci Levels
The climax often occurs at a Fibonacci extension level. Target the 38.2% and 50% retracements of the prior uptrend.
Moving Averages
The climax bar frequently pushes price far from the 20 EMA. The first target is mean reversion to this average.
Rsi Confirmation
RSI above 70 with a bearish reversal on the climax bar is classic. An RSI reading that peaks above 80 and closes below 70 on the same bar is very bearish.
Macd Confirmation
MACD making its highest reading then showing a bearish shift on the climax bar adds confirmation.
Bollinger Bands
The climax bar typically touches or exceeds the upper Bollinger Band before closing back inside it — a textbook band rejection.
Vwap
A climax bar that opens above VWAP and closes below it shows the session's average buyer is losing money.
Ichimoku Cloud
The climax pushing far above the Tenkan-sen before reversing back toward it signals exhaustion.
Elliott Wave
Climax Reversals commonly mark the end of Wave 3 or Wave 5 terminals.
Wyckoff Phase
Related to the Buying Climax in Wyckoff, but without the strict extreme volume requirement.
Market Profile
The climax bar creates a long TPO range with single prints at the high — a P-shaped profile indicating excess.
Order Flow
Watch for a delta shift within the bar — positive delta in the first half, negative delta in the second half.
Open Interest
Rising open interest on the reversal portion suggests new shorts are being established.
Multi-Timeframe Analysis
Higher Timeframe Alignment
A daily Climax Reversal at weekly resistance is very high conviction.
Lower Timeframe Entry
After the daily climax bar, use the 1H chart to identify the breakdown point for precise entry.
Timeframe Confluence
A 4H Climax Reversal that forms at the daily overbought level provides excellent timeframe confluence.
Top-Down Approach
Weekly: overbought/at resistance. Daily: Climax Reversal forms. 4H: entry refinement.
Statistics
Historical Examples
Tesla Climax Reversal at $414 in 2021
successTSLA made a climax reversal after the Hertz order news. The daily candle had the widest range in months, opened near the high and closed near the low. The stock declined 36% over the next two months.
Lesson: News-driven rallies often create climax reversals as the initial excitement is met with institutional selling.
Gold Climax Reversal in August 2020
successGold made a climax reversal near $2,075 per ounce. The daily candle had the widest range of the entire rally and closed in its lower third on high volume. Gold subsequently fell 15% over the next three months.
Lesson: Commodity climax reversals at round-number milestones are particularly reliable because they attract both retail buying and institutional selling.
Variations
Multi-Bar Climax Reversal
The climax occurs over 2-3 bars rather than a single bar, with a sharp rally followed by sharp reversal candles.
Gap and Climax Reversal
The climax bar gaps up at the open before reversing to close at the low, combining a gap pattern with the reversal.
Confusion Matrix
Patterns commonly confused with Bearish Climax Reversal and how to distinguish them.
Bearish Buying Climax
8000% similarCheck the volume. If it is extremely elevated (3x+ average), it is a Buying Climax. If volume is above average but not extreme, it is a Climax Reversal.
Key Differences
- Buying Climax requires extreme volume (3-5x average)
- Climax Reversal focuses on the wide range and close position
- BC is a Wyckoff-specific concept; CR is more general
Bearish Shooting Star
6000% similarA Shooting Star has a small body with a long upper shadow. A Climax Reversal can have a larger body but the emphasis is on the wide range and the trend context.
Key Differences
- Shooting Star has specific shadow-to-body ratio requirements
- Climax Reversal emphasizes the wide range relative to recent candles
- Shooting Star is a defined candlestick; CR is more about context
The Buying Climax is a Wyckoff concept describing the final blow-off top where extreme volume and wide price spreads signal that all remaining demand has been absorbed, leaving the market vulnerable to a sharp reversal and the beginning of distribution.
The Dark Cloud Cover is a two-candle bearish reversal pattern where a bearish candle opens above the prior bullish candle's high and closes below its midpoint, signaling that the bullish 'sky' is being covered by a bearish 'dark cloud.'
The Bearish Engulfing is one of the most powerful and commonly traded two-candle reversal patterns. A large bearish candle completely engulfs the prior bullish candle, demonstrating a decisive shift from buying to selling dominance.
The bearish key reversal is a powerful single-bar reversal pattern where price makes a new high then reverses to close below the prior bar's low on high volume, signaling a decisive shift from buying to selling control.
The shooting star is a single-candle bearish reversal pattern with a small body near the low and a long upper shadow. It shows that buyers pushed price significantly higher during the session but sellers drove it back down, signaling a potential top.
The Bullish Climax Reversal occurs when extreme panic selling exhausts all remaining supply, creating a volume spike at the low that marks the turning point from bearish to bullish control.
Pro Tips & Common Mistakes
Pro Tips
- Measure the range of the climax bar relative to the 14-day ATR. If the bar's range is 2x or more the ATR, it qualifies as a climactic move.
- The close position within the bar is critical. A close in the lower 25% is highly bearish. A close near the midpoint is ambiguous.
- Combine the Climax Reversal with volume analysis for best results. High volume strengthens the signal; low volume weakens it.
- Look at the intraday chart of the climax day. If the selling intensified in the final hours, the next day is likely to see follow-through.
Common Mistakes
- Confusing any wide-range bearish candle with a Climax Reversal. The context matters — it must occur after an extended uptrend.
- Using too tight a stop. The climax bar's range is wide by definition, so the stop above its high may be far from entry.
- Not adjusting position size for the wider stop distance, leading to excessive dollar risk.
- Expecting an immediate crash. The Climax Reversal may lead to distribution, not an immediate sharp decline.
Advanced Techniques
- Use Volume Spread Analysis (VSA) to categorize the bar: ultra-wide spread, close on the low, high volume = professional selling.
- Combine with market internals. If the climax bar occurs on a day when advancing/declining stocks diverge from the index, the reversal is more credible.
- Analyze the opening vs. closing range. If the candle opened in the top 10% and closed in the bottom 10%, the intra-session reversal was complete.
Institutional Perspective
Institutions identify climax reversals by monitoring the TICK indicator (net up-ticking stocks) and cumulative delta. A session that starts with extremely positive TICK and ends with negative TICK, combined with a wide range reversal bar, signals institutional selling domination.
Fun Facts
- Tom Williams, who studied under a Wyckoff disciple, called wide-range down-close bars on high volume 'End of Rising Market' bars — his colorful way of naming the Climax Reversal.
- Climax Reversals are more common on Fridays because institutional traders prefer to establish short positions before the weekend, adding selling pressure to an already exhausted market.
- The widest-range daily candle in an uptrend often turns out to be the last candle of the uptrend — a statistical fact that supports the Climax Reversal concept.
Frequently Asked Questions
The Climax Reversal is distinguished by its context and range. It must occur after an extended uptrend, the range must be significantly wider than recent candles (1.5-2x average), and it should open near the high and close near the low.
Above-average volume strengthens the signal, but unlike the Buying Climax, extreme volume (3-5x average) is not required. The focus is on the price action — the wide range and close position.
Calculate your risk per share (stop minus entry) and divide your maximum dollar risk by this amount. The wider the climax bar, the fewer shares you should take to maintain consistent risk percentage.