Overview
Bearish Bull Trap
Also known as: Bull Trap, False Breakout, Fakeout, Upthrust
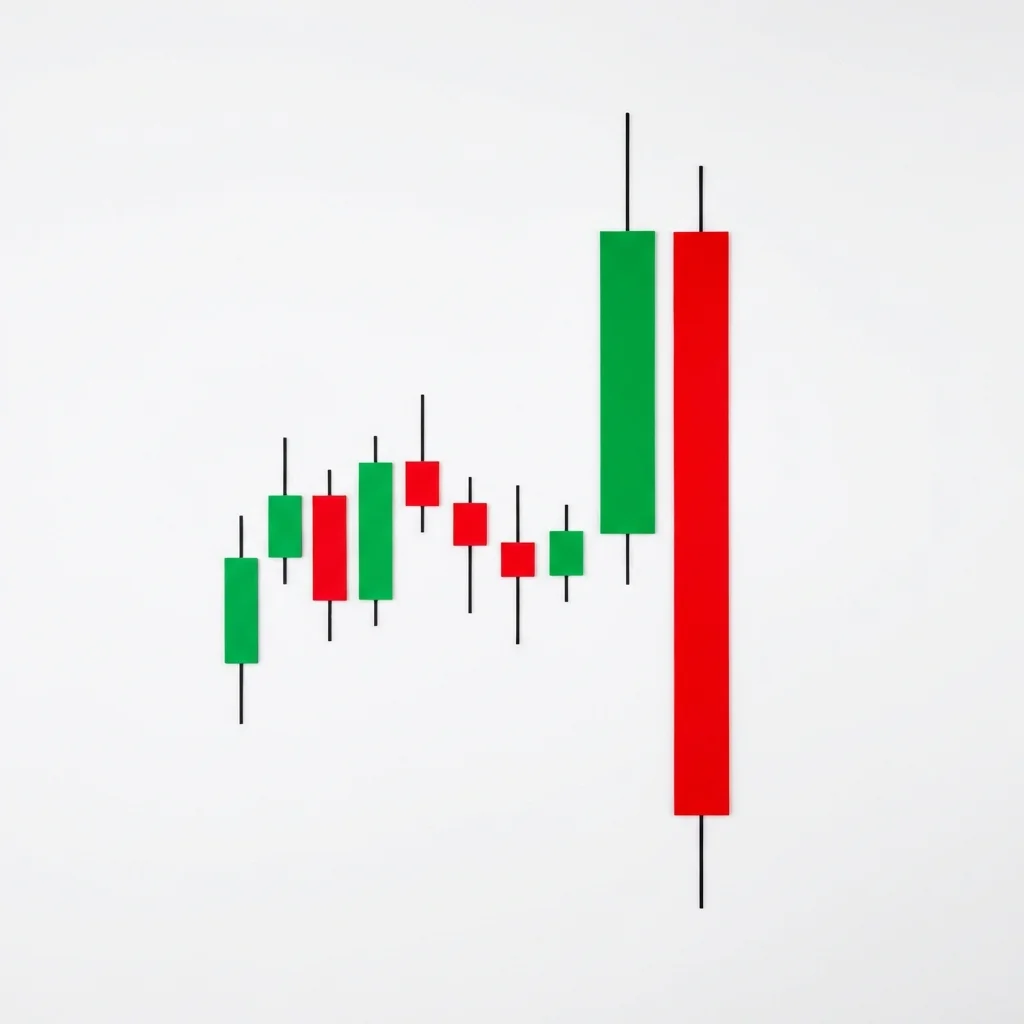
A Bull Trap is a false breakout above resistance that lures buyers in before immediately reversing, trapping them at elevated prices and triggering a sharp sell-off as trapped longs are forced to exit.
The Bull Trap is one of the most common and devastating patterns in trading. It occurs when price breaks above a resistance level — a previous high, a trendline, or a horizontal support/resistance zone — enticing bulls to enter long positions. However, the breakout quickly fails, and price reverses back below the resistance level. Trapped buyers are now holding losing positions above a level that was supposed to be 'support' (former resistance). As their stops are triggered and they capitulate, the selling accelerates, often leading to a decline that exceeds the depth of the original approach to resistance. Bull Traps are a manifestation of smart money tactics — institutional players often push price above resistance to trigger buy stops and absorb retail breakout orders, then reverse the price to profit from the ensuing panic.
History & Etymology
The concept of the Bull Trap has been recognized since the early days of technical analysis. Richard Wyckoff described the mechanism as an 'Upthrust' in his methodology from the 1930s, explaining how manipulative interests push prices above resistance to trigger buying before reversing. The pattern gained renewed attention with the rise of algorithmic and high-frequency trading, which can execute false breakouts with mechanical precision.
The name 'bull trap' is self-explanatory — it is a trap that catches bulls (buyers). The false breakout above resistance acts as bait, luring bulls into positions that immediately move against them. Like a physical trap, the price snaps back after the initial move, trapping those who entered.
How It Forms
Formation Steps
- 1Price approaches a well-defined resistance level or previous high
- 2Price breaks above the resistance level, often on a bullish candle
- 3The breakout fails quickly — price reverses and closes back below the resistance level
- 4Follow-through selling drives price well below the failed breakout level
Prerequisites
- Clear resistance level, previous high, or trendline that price breaks above
- The breakout initially attracts buyers
- The reversal back below resistance occurs within 1-5 bars
Confirmation Signals
- Price closes back below the resistance level after breaking above it
- Volume is low on the breakout but high on the reversal
- Bearish engulfing or other reversal candle at the breakout level
- RSI divergence at the breakout level
Invalidation Signals
- Price sustains above the breakout level for multiple bars
- Strong volume supports the breakout
- Higher lows form above the breakout level
Candle Breakdown
Breakout Candle
A bullish candle that breaks above the resistance level, often with a strong close above resistance.
Excitement peaks as the breakout occurs. Breakout traders enter long. Buy stops above resistance are triggered. The move looks convincing but volume may not fully support it.
Reversal Candle
A bearish candle that reverses back below the resistance level. May be a shooting star, bearish engulfing, or simply a strong bearish candle.
Shock and disbelief. Buyers who just entered see their profits evaporate. The long upper shadow above resistance and close below it confirms the trap.
Confirmation Candle
Follow-through selling that confirms the trap. Price moves well below the resistance level as trapped buyers exit.
Capitulation. Trapped bulls cut losses. New shorts pile in. The selling becomes self-reinforcing.
Psychology
The Bull Trap exploits the most common retail trading strategy — buying breakouts above resistance. By understanding that institutions need retail buying to sell into, the Bull Trap reveals the predatory dynamics of market structure.
Buyer Perspective
Buyers have been watching the resistance level and waiting for a breakout. When it happens, they rush in with market orders and buy stops. The immediate reversal puts them in a losing position at the worst possible level — right above resistance that has now become a ceiling.
Seller Perspective
Sellers — particularly institutions — may have engineered the breakout by pushing price above resistance to trigger buy stops. Once these orders are filled (providing them with counterparty liquidity to sell), they reverse the price. The trapped buyers' stop-loss orders provide additional selling pressure.
Smart Money Action
Smart money often initiates the false breakout by pushing price above resistance with limited capital. This triggers retail buy stops and breakout orders, providing institutional sellers with the liquidity they need to establish or add to short positions. The reversal is then driven by their accumulated selling and the mechanical stop-loss cascade of trapped buyers.
Retail Trader Trap
The Bull Trap is the quintessential retail trap. Breakout buying above resistance is taught in every basic trading course, and institutions know this. The false breakout specifically targets retail buy stops and market entries, providing the liquidity for institutional distribution.
Emotional Cycle
Trading Strategy
Aggressive Entry
Short when price closes back below the resistance level after the false breakout.
Conservative Entry
Wait for a second candle to close below the resistance level, confirming the trap.
The support level that preceded the approach to resistance (recent swing low).
2x the distance of the false breakout above resistance, projected downward.
Major support level or the 61.8% retracement of the rally into resistance.
Best Conditions
- Timeframe: daily
- Timeframe: 4h
- Timeframe: 1h
- range-bound market
- distribution phase
- near major resistance
- overbought conditions
- Asset: stocks
- Asset: indices
- Asset: forex
- Asset: crypto
Avoid When
- Timeframe: 1m
- strong trend breakout with institutional momentum
Confluence Factors
- Low volume on the breakout
- RSI bearish divergence at the breakout
- Breakout occurs at a round number (psychological resistance)
- Multiple timeframe resistance at the same level
- Market breadth does not confirm the breakout
Scale In Strategy
Enter 50% on the close below resistance, add 50% on confirmation candle.
Scale Out Strategy
Take 50% at 1:1 R:R, trail the rest with 10 EMA.
Risk Management
Volume Analysis
Volume Confirmation
The ideal Bull Trap has average or below-average volume on the breakout and above-average volume on the reversal. Low breakout volume is the biggest red flag.
Volume Profile
Look for a volume vacuum above resistance (no buying follow-through) followed by a volume surge on the reversal.
Volume Divergence
If volume has been declining as price approached resistance, the breakout is more likely to be a trap.
Technical Confluence
Support Resistance
The Bull Trap occurs specifically at resistance levels. After the trap, the resistance level is reinforced and the trap high becomes a new strong resistance.
Fibonacci Levels
Bull Traps at Fibonacci extension levels (127.2%, 161.8%) are particularly powerful because these are common institutional take-profit zones.
Moving Averages
A Bull Trap above the 200-day moving average is extremely common. Price pierces above the 200 MA, triggers stops, then reverses sharply below it.
Rsi Confirmation
RSI divergence (price makes a higher high at the trap while RSI makes a lower high) is one of the strongest confirmations of a Bull Trap.
Macd Confirmation
MACD not confirming the new high and showing a bearish crossover at the trap level adds confluence.
Bollinger Bands
A Bull Trap above the upper Bollinger Band that immediately reverses back inside is a classic mean-reversion setup.
Vwap
On intraday charts, a Bull Trap above VWAP that closes below it is a clear signal that the breakout is false.
Ichimoku Cloud
A failed breakout above the Kumo cloud that closes back below is a powerful Ichimoku-based Bull Trap signal.
Elliott Wave
Bull Traps often occur at the end of Wave 5 where a throw-over above the channel line is quickly reversed.
Wyckoff Phase
The Bull Trap is Wyckoff's 'Upthrust After Distribution' (UTAD) — a false breakout above the trading range used to trap buyers before marking down.
Market Profile
The Bull Trap often occurs at the upper value area boundary or at a prior Point of Control that has become resistance.
Order Flow
Look for a spike in buy stops being triggered above resistance followed by aggressive market sell orders driving price back down.
Open Interest
In futures, rising open interest on the breakout that reverses with even higher OI on the reversal suggests new shorts are entering aggressively.
Multi-Timeframe Analysis
Higher Timeframe Alignment
A Bull Trap on the daily chart at a weekly resistance level is high conviction. The weekly timeframe traders are defending that level.
Lower Timeframe Entry
After identifying the daily Bull Trap, use the 15-minute or 1-hour chart to time the short entry as price falls back below resistance.
Timeframe Confluence
The most powerful Bull Traps occur when multiple timeframes show resistance at the same level — e.g., daily horizontal resistance aligned with weekly downtrend line.
Top-Down Approach
Weekly: identify major resistance. Daily: watch for Bull Trap. 4H: enter the short. 1H: manage the trade.
Statistics
Historical Examples
Bitcoin Bull Trap at $69,000 in 2021
successBitcoin broke above $67,000 resistance to briefly touch $69,000. The breakout failed within 24 hours, and BTC reversed sharply. Over the next year, Bitcoin fell over 75% to $15,500.
Lesson: The greatest Bull Traps occur at major psychological round numbers after extended rallies. The euphoric sentiment at $69K was the perfect setup for institutional distribution.
SPY Bull Trap at 2022 Summer High
successSPY rallied sharply from the June 2022 low and broke above the 200-day moving average. The breakout lasted only a few sessions before price crashed back below the 200 MA, falling 17% over the next two months.
Lesson: The 200-day moving average is one of the most common Bull Trap levels because so many traders use it as a buy signal.
Variations
Intraday Bull Trap
A false breakout that occurs and reverses within a single trading session, often around the open.
Bull Trap with Gap
Price gaps above resistance at the open, then reverses to close back below within the same session.
Slow Bull Trap
Price breaks above resistance and stays above for 3-7 bars before slowly reversing back below.
Confusion Matrix
Patterns commonly confused with Bearish Bull Trap and how to distinguish them.
Bearish Double Top
6000% similarThe Bull Trap is about a false breakout — price must break above a level and then fall back. A Double Top can form without any level being broken.
Key Differences
- Double Top has two peaks at similar levels; Bull Trap has one false breakout above a level
- Double Top takes longer to develop
- Bull Trap specifically requires a level to be broken and then recaptured
Bearish Key Reversal
5500% similarA Key Reversal making a new high then closing below the prior low is often the mechanism that creates a Bull Trap. The Bull Trap is the broader context.
Key Differences
- Key Reversal is a single candle pattern
- Bull Trap focuses on the relationship to a resistance level
- A Key Reversal can occur anywhere; a Bull Trap occurs at a specific level
The Distribution phase is a Wyckoff concept where institutional investors systematically sell (distribute) their holdings to the public within a trading range at a market top, before the subsequent markdown (decline) begins.
The Double Top Breakdown is the confirmed version of the Double Top — the precise moment when price breaks below the neckline, triggering the measured move decline. This is the actionable event that converts the pattern from potential to confirmed.
The Double Top is an M-shaped reversal pattern where price tests a resistance level twice and fails, creating two peaks at similar levels. The breakdown below the neckline (trough between peaks) confirms the reversal with a measured move target equal to the pattern height.
The Bearish Engulfing is one of the most powerful and commonly traded two-candle reversal patterns. A large bearish candle completely engulfs the prior bullish candle, demonstrating a decisive shift from buying to selling dominance.
The head and shoulders is the most well-known reversal pattern in technical analysis. It consists of three peaks — a higher middle peak (head) flanked by two lower peaks (shoulders) — and signals a major bearish reversal when the neckline breaks.
The bearish key reversal is a powerful single-bar reversal pattern where price makes a new high then reverses to close below the prior bar's low on high volume, signaling a decisive shift from buying to selling control.
Pro Tips & Common Mistakes
Pro Tips
- Never chase breakouts. Instead, wait 1-2 candles for confirmation. If the breakout is real, you will miss a small part of the move. If it is a trap, you will save yourself a significant loss.
- Low volume breakouts are the biggest warning sign. Genuine breakouts are supported by institutional buying, which shows as above-average volume.
- The Bull Trap becomes your trade setup — fade the failed breakout with a tight stop above the trap high for excellent risk-reward.
- Watch for the 'breakout and retest' versus the 'breakout and reversal.' In the former, price breaks out, pulls back to the level, and bounces. In the latter (Bull Trap), price breaks out and falls through the level entirely.
- The most dangerous Bull Traps occur above major round numbers ($100, $1,000, $10,000) where maximum retail buying is clustered.
Common Mistakes
- Buying every breakout above resistance without waiting for confirmation.
- Not using a stop loss above resistance after entering a short on the Bull Trap.
- Averaging down on a long position after the trap — the correct action is to exit or reverse.
- Ignoring volume. A low-volume breakout is a trap until proven otherwise.
- Assuming every pullback after a breakout is a Bull Trap. True breakouts do pull back to test the breakout level.
Advanced Techniques
- Use the order flow footprint chart to see if the breakout was driven by stop hunting (buy stops triggered) rather than genuine institutional buying (aggressive market buys).
- Place limit sell orders slightly above well-known resistance levels where Bull Traps are likely to form.
- In options, sell call spreads with the short strike just above resistance to profit from Bull Traps while defining risk.
- Monitor the time and sales tape for large prints being sold into the breakout — this is the institutional footprint of the trap.
Institutional Perspective
Institutional traders frequently engineer Bull Traps as part of their distribution strategy. By pushing price above resistance with limited capital, they trigger retail buy stops and attract breakout traders. This provides the liquidity institutions need to sell large positions. The subsequent reversal is driven by their accumulated selling and the cascade of retail stop losses.
Fun Facts
- Studies suggest that over 60% of breakouts above resistance in range-bound markets fail within the first few bars, making Bull Traps the norm rather than the exception.
- Richard Wyckoff called the Bull Trap an 'Upthrust' nearly 100 years ago, and the mechanism is unchanged — smart money still uses it to trap retail buyers.
- The most famous Bull Trap in modern history may be Bitcoin's brief breakout above $69,000 in November 2021, which preceded a 77% decline.
Frequently Asked Questions
Key differences: (1) Volume — real breakouts have above-average volume; traps often have low volume on the breakout. (2) Follow-through — real breakouts hold above the level for multiple bars; traps reverse within 1-3 bars. (3) RSI — divergence at the breakout level suggests a trap. Wait 1-2 bars for confirmation before entering.
Short when price closes back below the resistance level after the false breakout. Place your stop above the trap high. Target the support level below (previous swing low). This gives excellent risk-reward because the stop is tight and the target is generous.
Bull Traps occur because institutional traders need liquidity to sell large positions. By pushing price above resistance, they trigger retail buy stops and attract breakout buyers, providing the sell-side liquidity they need. Once these orders are absorbed, the buying dries up and the price reverses.
Bull Traps are common in all markets but are especially frequent in range-bound markets, near round-number psychological levels, around major moving averages (200 MA), and during high-impact news events that create volatile but unsustainable moves.