Overview
Bearish Double Top Breakdown
Also known as: Double Top Neckline Break, Confirmed Double Top, M Pattern Breakdown
The Double Top Breakdown is the confirmed version of the Double Top — the precise moment when price breaks below the neckline, triggering the measured move decline. This is the actionable event that converts the pattern from potential to confirmed.
The Double Top Breakdown focuses on the most critical event in the Double Top pattern: the neckline break. While the Double Top pattern itself is a formation that takes time to develop, the Breakdown is the specific event that confirms the reversal. When price closes below the neckline on elevated volume, it signals that the support represented by the neckline has been overwhelmed, and the measured move decline is underway. The Breakdown is important to isolate as a separate pattern because many Double Tops never complete — the neckline holds and price resumes its uptrend. The Breakdown confirms that this particular Double Top is valid and actionable. Approximately 60% of Breakdowns are followed by a retest of the neckline from below, providing a second entry opportunity for traders who missed the initial break.
History & Etymology
The concept of the neckline break as the confirmation event for Double Tops was formalized by Edwards and Magee. Prior to their work, many traders would attempt to trade the pattern before confirmation, leading to lower success rates. The discipline of waiting for the Breakdown was a key contribution to pattern-based trading.
The 'breakdown' refers to the specific event of price breaking below (down through) the neckline. It is the moment when support 'breaks' and the pattern transitions from formation to execution.
How It Forms
Formation Steps
- 1A completed Double Top pattern (two peaks at similar levels)
- 2Price breaks below the neckline (trough between the peaks) on increased volume
- 3The breakdown candle closes decisively below the neckline
- 4Follow-through selling occurs on subsequent bars
- 5Optional: price retests the neckline from below before continuing lower
Prerequisites
- Valid Double Top with two peaks at approximately the same level
- Clear neckline (trough between peaks)
- The breakdown must occur on above-average volume
- The breakdown candle should close below the neckline — not just a wick
Confirmation Signals
- Close below the neckline on above-average volume
- Follow-through selling the next bar
- Neckline retest that holds (price rejected at the neckline from below)
- Volume increases on the decline from the neckline
Invalidation Signals
- Price recovers above the neckline within 1-2 bars
- Volume is low on the breakdown
- Price quickly recaptures the neckline and the Double Top peaks
Candle Breakdown
Breakdown Candle
A decisive bearish candle that closes below the neckline on above-average volume.
The dam breaks. All the buying pressure that defended the neckline is overwhelmed. Stop losses below the neckline are triggered, adding momentum. This is the confirmation event.
Follow-Through Candle
Continuation selling after the breakdown, confirming the pattern is valid.
No bounce. Sellers maintain pressure. Buyers who were hoping for a false breakdown capitulate.
Retest (Optional)
Price rallies back to the neckline from below, testing it as resistance. This occurs in about 60% of cases.
One last hope for bulls. The rally to the neckline attracts some buying, but sellers defend the neckline from above. The rejection confirms the reversal.
Psychology
The Breakdown is the moment of truth for the Double Top. All the building pressure — two failed peaks, declining volume, bearish divergences — resolves in a single decisive event. The psychology shifts from 'maybe' to 'definitely bearish.'
Buyer Perspective
Buyers who defended the neckline finally give up. Their stop losses are triggered in a cascade. Those who bought at the peaks are now deeply underwater and face the difficult decision to cut losses or hold.
Seller Perspective
Sellers have been building positions and waiting for this moment. The confirmed breakdown gives them confidence to add aggressively. The measured move target provides a clear profit objective.
Smart Money Action
Institutions may trigger the breakdown with large sell orders placed just below the neckline. They know that retail stop losses are clustered there, and the cascade provides additional momentum.
Retail Trader Trap
Retail traders who bought the neckline support on previous tests have their stops triggered. Those without stops face rapidly growing losses as the measured move unfolds.
Emotional Cycle
Trading Strategy
Aggressive Entry
Short on the close of the breakdown candle.
Conservative Entry
Short on the retest of the neckline from below (occurs 60% of the time).
The measured move target (pattern height projected below the neckline).
1.5x the measured move.
Major support level below.
Best Conditions
- Timeframe: daily
- Timeframe: weekly
- Timeframe: 4h
- bear market developing
- after failed double rally
- sector weakness
- Asset: stocks
- Asset: indices
- Asset: forex
- Asset: crypto
Avoid When
- Timeframe: 1m
- Timeframe: 5m
- strong bull trend with brief correction
Confluence Factors
- Volume spike on the breakdown
- RSI below 50 at the time of breakdown
- MACD below zero and declining
- Moving averages have turned bearish
- Market breadth confirms the breakdown
Scale In Strategy
Enter 50% on the breakdown, add 50% on the neckline retest.
Scale Out Strategy
Take 50% at the measured move target, trail 50%.
Risk Management
Volume Analysis
Volume Confirmation
The breakdown must have above-average volume. Low-volume breakdowns frequently fail.
Volume Profile
Volume spike on the breakdown followed by declining volume on the retest (if it occurs) followed by increasing volume on the continuation.
Volume Divergence
Not applicable at this stage — the volume confirmation is straightforward.
Technical Confluence
Support Resistance
The neckline converts from support to resistance after the breakdown. This polarity change is the foundation of the retest trade.
Fibonacci Levels
The measured move often coincides with a Fibonacci retracement level of the prior uptrend.
Moving Averages
A breakdown below both the neckline and the 50 MA simultaneously is very powerful.
Rsi Confirmation
RSI below 50 and declining at the breakdown confirms bearish momentum.
Macd Confirmation
MACD below zero with bearish momentum at the breakdown is standard.
Bollinger Bands
A breakdown below the lower Bollinger Band can indicate overextension — watch for a brief bounce before continuation.
Vwap
Closing below VWAP on the breakdown day confirms the session was seller-dominated.
Ichimoku Cloud
A breakdown through both the neckline and the Kumo cloud is a very strong bearish signal.
Elliott Wave
The breakdown often initiates Wave C of a correction or Wave 3 of a new bearish impulse.
Wyckoff Phase
The breakdown represents the Sign of Weakness (SOW) in Wyckoff distribution.
Market Profile
The breakdown pushes value below the prior value area, confirming the structural change.
Order Flow
Aggressive selling (market sell orders) on the breakdown with thin bid depth below the neckline.
Open Interest
Rising OI on the breakdown in futures confirms new short positions.
Multi-Timeframe Analysis
Higher Timeframe Alignment
A daily Double Top Breakdown with a weekly bearish setup is high conviction.
Lower Timeframe Entry
After the daily breakdown, use the 4H chart for retest entries.
Timeframe Confluence
A weekly Double Top Breakdown signals a major trend reversal.
Top-Down Approach
Weekly: bearish structure. Daily: Double Top Breakdown. 4H: retest entry.
Statistics
Historical Examples
SPY Double Top Breakdown March 2022
successSPY formed a Double Top with peaks near $470 in January and March 2022. The neckline at $429 broke with heavy volume on April 11. SPY declined to $362 by October, exceeding the measured move target.
Lesson: The neckline breakdown on volume was the clear sell signal. The 60% retest (SPY bounced to $430 before continuing lower) provided a textbook second entry.
Variations
Gap Breakdown
The neckline is broken with a gap down, providing extra confirmation.
False Breakdown Recovery
The neckline breaks but price quickly recovers above it.
Confusion Matrix
Patterns commonly confused with Bearish Double Top Breakdown and how to distinguish them.
Bearish Double Top
9000% similarThe Double Top is the overall pattern. The Breakdown is the specific moment the neckline breaks. The Breakdown is the Double Top + confirmation.
Key Differences
- Double Top is the formation; Breakdown is the confirmation event
- Double Top can fail (neckline holds); Breakdown is the confirmed version
- Breakdown focuses on the neckline event specifically
A Bull Trap is a false breakout above resistance that lures buyers in before immediately reversing, trapping them at elevated prices and triggering a sharp sell-off as trapped longs are forced to exit.
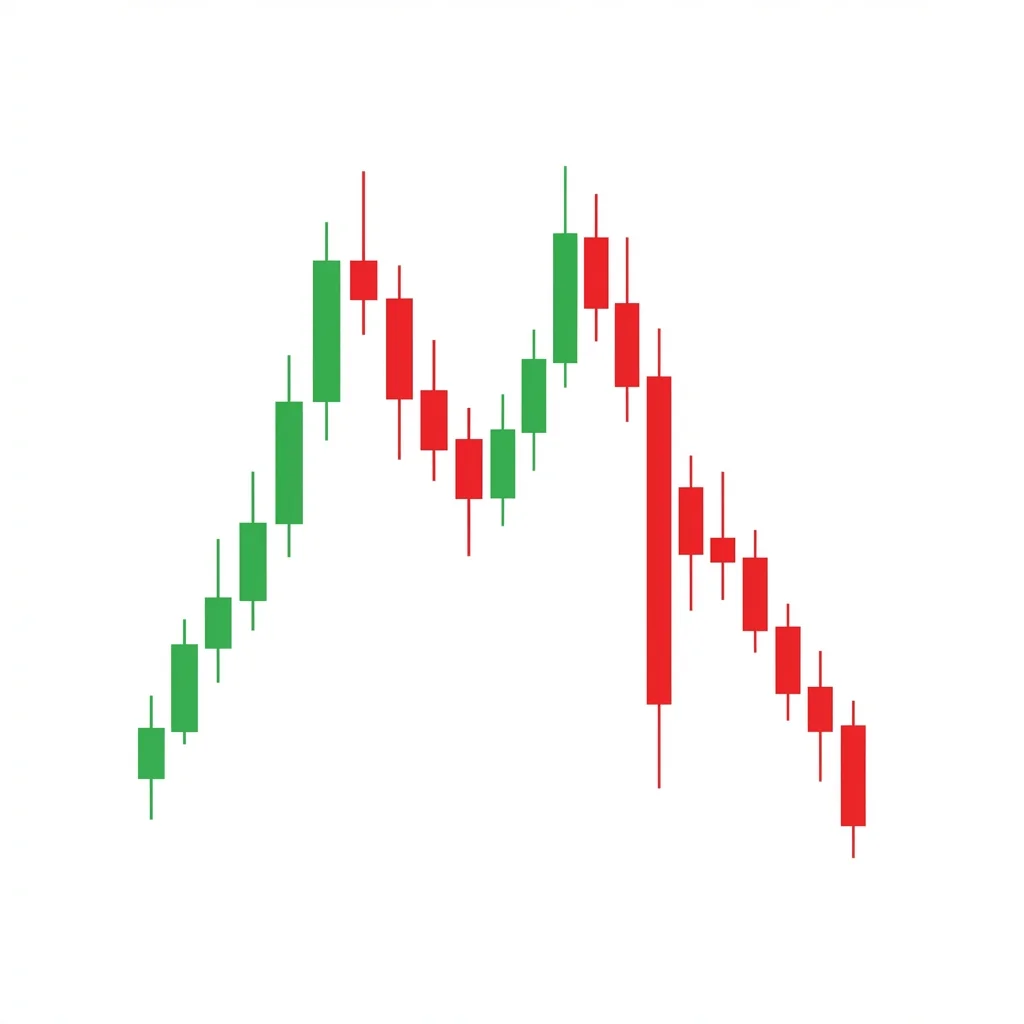
The Double Top is an M-shaped reversal pattern where price tests a resistance level twice and fails, creating two peaks at similar levels. The breakdown below the neckline (trough between peaks) confirms the reversal with a measured move target equal to the pattern height.
The head and shoulders is the most well-known reversal pattern in technical analysis. It consists of three peaks — a higher middle peak (head) flanked by two lower peaks (shoulders) — and signals a major bearish reversal when the neckline breaks.
Three black crows is a powerful bearish reversal pattern consisting of three consecutive long bearish candles, each opening within the prior candle's body and closing near its low. It signals strong, persistent selling pressure and a likely trend reversal.
The Double Bottom Breakout focuses specifically on the confirmed neckline break of a double bottom pattern, which is the highest-conviction entry point with a clear measured move target and defined risk.
The Broadening Top (Megaphone) is a chart formation characterized by expanding price swings that create higher highs and lower lows, reflecting increasing volatility and instability at market tops before a bearish breakdown.
Pro Tips & Common Mistakes
Pro Tips
- The retest of the neckline provides the best risk-reward entry. Wait for it patiently — it occurs 60% of the time.
- Volume on the breakdown is non-negotiable. If volume is below average, the breakdown is likely to fail.
- The measured move target is achieved approximately 70% of the time. Use it as your primary target.
- A gap down through the neckline is an even stronger confirmation than a simple close below it.
Common Mistakes
- Entering the trade during the Double Top formation before the neckline breaks.
- Accepting low-volume breakdowns as confirmed. Volume is essential for confirmation.
- Setting the stop too close to the neckline on the breakdown entry. Use the peaks as the invalidation level.
- Not waiting for the retest opportunity, which provides a better risk-reward entry.
Advanced Techniques
- Combine the breakdown with options: buy puts at the neckline strike or slightly in-the-money puts for the measured move.
- Use the breakdown as a portfolio signal: if major index ETFs show Double Top Breakdowns, reduce overall long exposure.
- Monitor sector rotation: if previously leading sectors show Double Top Breakdowns, money is leaving those sectors.
Institutional Perspective
Institutional traders view the Double Top Breakdown as one of the highest-conviction short setups. The pattern has clear risk parameters (peaks) and reward targets (measured move). Many quantitative funds include the Double Top Breakdown in their systematic trading models.
Fun Facts
- The neckline retest is sometimes called 'the kiss of death' — price kisses the neckline goodbye before plunging lower.
- Automated trading systems are programmed to detect Double Top Breakdowns, and their systematic selling adds to the pattern's reliability.
- The Double Top Breakdown has been a profitable pattern across all major asset classes for over 100 years of recorded market history.
Frequently Asked Questions
Both are valid. The breakdown entry is more aggressive with a wider stop (above peaks). The retest entry has better risk-reward (tight stop above the neckline) but only occurs 60% of the time. A scaled approach — enter partially on breakdown, add on retest — balances both.
Low-volume breakdowns have a high failure rate. If volume is below average, consider waiting for a retest and volume confirmation before entering. Many low-volume breaks are quickly recovered.