Overview
Bearish Double Top
Also known as: Double Top, M Pattern, Twin Peaks, Double Ceiling
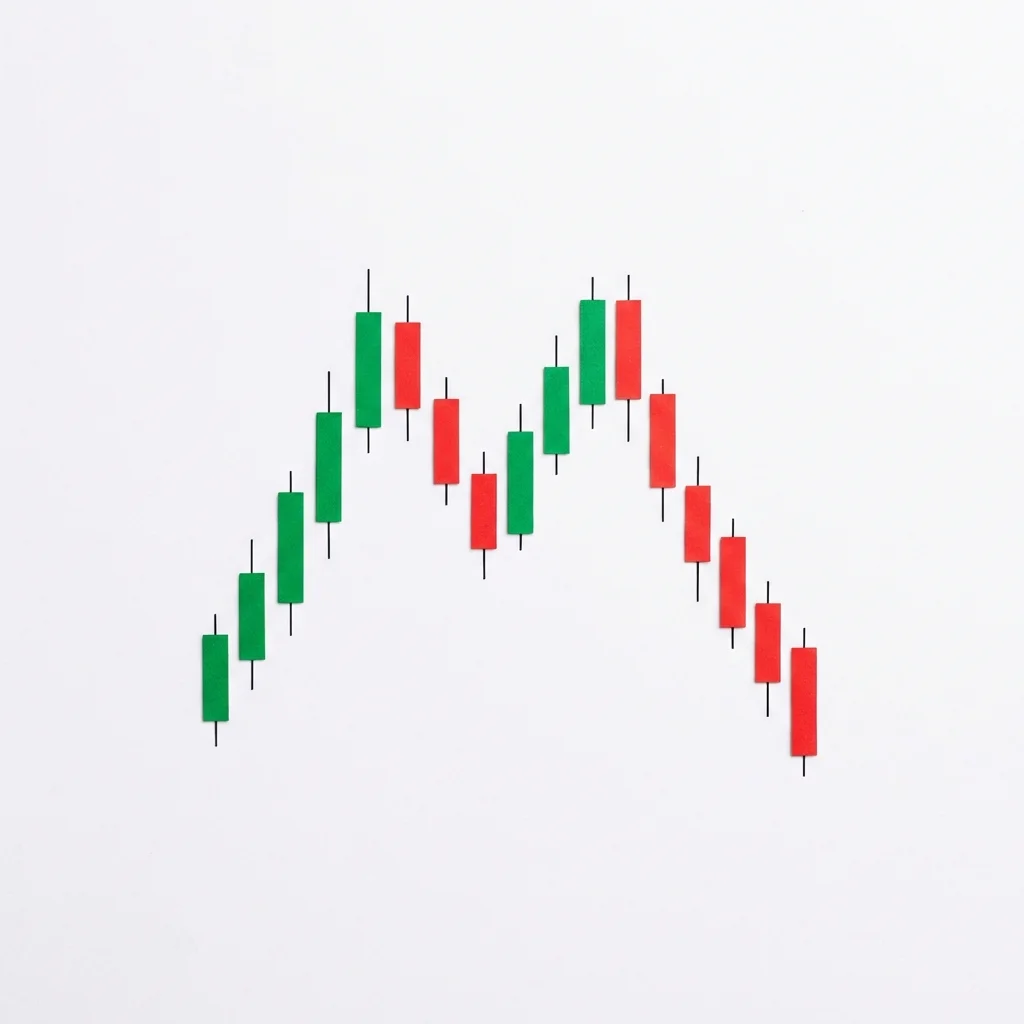
The Double Top is an M-shaped reversal pattern where price tests a resistance level twice and fails, creating two peaks at similar levels. The breakdown below the neckline (trough between peaks) confirms the reversal with a measured move target equal to the pattern height.
The Double Top is one of the most recognized and reliable reversal patterns in all of technical analysis. It forms when price reaches a high, pulls back, then rallies again to approximately the same level before failing and declining below the trough (neckline) between the two peaks. The pattern looks like the letter 'M' on a chart. The key insight is that the market tested a resistance level twice and was rejected both times — if buyers could not push through on two attempts, the resistance is too strong and a reversal is likely. The measured move target is the height of the pattern (from peak to neckline) projected downward from the neckline break. According to Thomas Bulkowski's research, the Double Top has an average decline of 20% after neckline breakdowns in stocks, making it one of the most profitable chart patterns.
History & Etymology
The Double Top has been recognized since the earliest days of technical analysis. Charles Dow discussed the concept of 'double peaks' in the early 1900s. Edwards and Magee formalized the pattern in 1948, providing specific formation rules and measurement techniques. It remains the most commonly identified reversal pattern by both manual and algorithmic traders.
The name is straightforward: two peaks (tops) at similar price levels create a 'double top.' The alternative name 'M Pattern' refers to the letter M shape that the two peaks and the intervening trough create on a price chart.
How It Forms
Formation Steps
- 1First peak: price rallies to a high then pulls back
- 2Trough: a decline between the two peaks forming the neckline
- 3Second peak: price rallies again to approximately the same level as the first peak
- 4The second peak fails to surpass the first, and price declines
- 5Neckline break: price breaks below the trough between the two peaks
Prerequisites
- Prior uptrend leading to the first peak
- Two peaks at approximately the same price level (within 3%)
- A clear trough between the peaks forming the neckline
- The second peak should show signs of weakness (lower volume, bearish patterns)
Confirmation Signals
- Price breaks below the neckline (the trough between the two peaks)
- Volume increases on the neckline breakdown
- Lower volume on the second peak compared to the first
- RSI divergence — lower RSI on the second peak despite similar price
Invalidation Signals
- Price breaks above the first peak's high on the second attempt
- Volume increases on the second peak
- Price holds above the neckline and forms higher lows
Candle Breakdown
First Peak
Price rallies to a new high, establishing the resistance level. A pullback follows.
Strong bullish momentum creates the first peak. Profit-taking triggers the pullback, but the uptrend is not yet in question.
Trough (Neckline)
The decline between the two peaks. This level becomes the neckline — the critical confirmation level.
Buyers view the pullback as a dip-buying opportunity. The trough represents the level where buying re-emerged.
Second Peak
Price rallies again to approximately the first peak's level but fails to break through. Often on lower volume.
The second attempt to break resistance fails. Lower volume shows less conviction. Bearish traders note the double rejection and prepare to sell.
Neckline Breakdown
Price declines from the second peak and breaks below the neckline (trough level), confirming the Double Top.
Confirmation. Trapped buyers from both peaks capitulate. Stop losses below the neckline are triggered. The measured move decline begins.
Psychology
The Double Top represents the market's inability to sustain higher prices. The first rejection establishes resistance; the second rejection confirms it. The neckline break triggers capitulation among those who bought at or near the peaks.
Buyer Perspective
Buyers are confident at the first peak. They buy the dip to the neckline. When the second peak fails, doubt creeps in. The neckline break forces them to accept losses.
Seller Perspective
Sellers note the first rejection and wait. When the second peak stalls at the same level, they know the resistance is strong. They sell aggressively, knowing that buyers at both peaks will eventually capitulate.
Smart Money Action
Institutions sell at both peaks and may add to shorts on the second peak's failure. They also place sell orders below the neckline to profit from the cascade of retail stop losses.
Retail Trader Trap
Retail traders buy both the first and second peaks, believing the resistance will break. They buy the neckline pullback as a 'dip.' When the neckline breaks, they are maximally exposed and face significant losses.
Emotional Cycle
Trading Strategy
Aggressive Entry
Short when the second peak forms and shows weakness (bearish reversal candle at resistance).
Conservative Entry
Short on a confirmed close below the neckline with above-average volume.
The pattern height (peak to neckline) projected below the neckline.
1.5x the pattern height.
Major support level below.
Best Conditions
- Timeframe: daily
- Timeframe: weekly
- Timeframe: 4h
- at major resistance
- after extended uptrend
- overbought conditions
- Asset: stocks
- Asset: indices
- Asset: forex
- Asset: crypto
Avoid When
- Timeframe: 1m
- Timeframe: 5m
- strong bull momentum with breakout potential
Confluence Factors
- Lower volume on the second peak
- RSI divergence at the second peak
- The peaks align with a major resistance level
- MACD bearish divergence
- Market breadth declining at the second peak
Scale In Strategy
Short 33% at the second peak, add 33% on the neckline break, add 34% on the neckline retest.
Scale Out Strategy
Take 33% at 1x pattern height, 33% at 1.5x, trail 34%.
Risk Management
Volume Analysis
Volume Confirmation
Lower volume on the second peak than the first is the classic confirmation. Volume should spike on the neckline breakdown.
Volume Profile
High volume first peak, lower volume second peak, spike on breakdown. This is the textbook Double Top volume signature.
Volume Divergence
Declining volume at the second peak while price reaches the same level is the most important volume signal.
Technical Confluence
Support Resistance
The peak level IS resistance (tested and rejected twice). The neckline IS support until broken.
Fibonacci Levels
The neckline often aligns with a Fibonacci retracement level. The breakdown target often coincides with a deeper Fibonacci level.
Moving Averages
The 50 or 200 MA often runs near the neckline, adding significance to the breakdown.
Rsi Confirmation
RSI divergence (lower RSI at the second peak despite similar price) is the most important technical confirmation for a Double Top.
Macd Confirmation
MACD making a lower high at the second peak confirms diminishing momentum.
Bollinger Bands
The second peak often touches but does not exceed the upper Bollinger Band, unlike the first peak.
Vwap
The second peak failing to sustain above VWAP confirms weaker buying.
Ichimoku Cloud
A Double Top with both peaks above the cloud, then a breakdown through the cloud, is very bearish.
Elliott Wave
The Double Top often marks the end of a B wave or the end of a five-wave impulse.
Wyckoff Phase
The Double Top is a simplified version of Wyckoff distribution. The first peak is the BC, the trough is the AR, and the second peak is the ST.
Market Profile
Both peaks create rejection tails at the same level, confirming the Point of Control is below.
Order Flow
Lower aggressive buying at the second peak versus the first confirms diminishing demand.
Open Interest
Declining OI at the second peak in futures confirms that the rally is driven by short covering rather than new buying.
Multi-Timeframe Analysis
Higher Timeframe Alignment
A daily Double Top at weekly resistance is high conviction.
Lower Timeframe Entry
After the daily pattern forms, use the 4H chart for precise neckline breakdown entry.
Timeframe Confluence
A weekly Double Top signals a major trend reversal lasting months.
Top-Down Approach
Weekly: resistance zone. Daily: Double Top forms. 4H: trade the neckline break.
Statistics
Historical Examples
Amazon (AMZN) Double Top at $188
successAMZN formed a textbook Double Top with peaks at $143 and $145. The neckline at $119 broke with a volume spike. The stock declined to $85 — exceeding the measured move target.
Lesson: The 3% tolerance between peak heights is important. RSI divergence at the second peak provided early warning.
Variations
Adam and Eve Double Top
The first peak is sharp and narrow (Adam) while the second is rounded and wider (Eve).
Triple Top
Three peaks at similar levels instead of two.
Confusion Matrix
Patterns commonly confused with Bearish Double Top and how to distinguish them.
Bearish Head Shoulders
6000% similarCount the peaks and compare their heights. If there are three peaks with the middle being the highest, it is an H&S. If there are two peaks at similar levels, it is a Double Top.
Key Differences
- H&S has three peaks (left shoulder, head, right shoulder) with a higher middle peak
- Double Top has two peaks at similar levels
- H&S has a more defined neckline structure
A Bull Trap is a false breakout above resistance that lures buyers in before immediately reversing, trapping them at elevated prices and triggering a sharp sell-off as trapped longs are forced to exit.
The Double Top Breakdown is the confirmed version of the Double Top — the precise moment when price breaks below the neckline, triggering the measured move decline. This is the actionable event that converts the pattern from potential to confirmed.
The Bearish Engulfing is one of the most powerful and commonly traded two-candle reversal patterns. A large bearish candle completely engulfs the prior bullish candle, demonstrating a decisive shift from buying to selling dominance.
The head and shoulders is the most well-known reversal pattern in technical analysis. It consists of three peaks — a higher middle peak (head) flanked by two lower peaks (shoulders) — and signals a major bearish reversal when the neckline breaks.
The shooting star is a single-candle bearish reversal pattern with a small body near the low and a long upper shadow. It shows that buyers pushed price significantly higher during the session but sellers drove it back down, signaling a potential top.
The triple top is a powerful bearish reversal pattern formed by three peaks at approximately the same price level, separated by two pullbacks. The pattern confirms when price breaks below the neckline, with a measured target equal to the pattern's height projected downward.
Pro Tips & Common Mistakes
Pro Tips
- The two peaks do not need to be at exactly the same price. A tolerance of 1-3% is standard.
- The time between the peaks matters. Very short Double Tops (a few days) are less reliable than those with weeks between peaks.
- Volume divergence (lower volume on the second peak) is the single most important confirmation factor.
- The neckline retest occurs about 60% of the time — this provides a lower-risk entry opportunity.
- Do not anticipate the Double Top before the neckline breaks. Many potential Double Tops never complete.
Common Mistakes
- Calling a Double Top before the neckline breaks. The pattern is not confirmed until the neckline gives way.
- Requiring the peaks to be at exactly the same level. A 1-3% tolerance is normal.
- Ignoring volume. A Double Top where both peaks have high volume is less reliable than one where the second peak has notably lower volume.
- Setting the stop above only the second peak. Use the higher of the two peaks for the stop.
Advanced Techniques
- Use the Adam and Eve concept: an 'Adam' peak (sharp, narrow) followed by an 'Eve' peak (rounded, wider) is statistically more reliable.
- Calculate the time between peaks. Peaks 15-30 trading days apart tend to produce the most reliable patterns.
- Use options to trade the Double Top: buy puts when the second peak fails, using the peak level as the risk definition.
Institutional Perspective
Institutional traders view the Double Top as a distribution pattern where the two peaks represent two rounds of selling into demand. The neckline break is where institutional selling overwhelms the remaining support buyers.
Fun Facts
- Thomas Bulkowski's analysis of thousands of Double Tops found an average decline of 20% after neckline breakdowns, making it one of the most profitable chart patterns.
- The Double Top is probably the single most commonly identified chart pattern by retail traders, yet it is still effective because of the underlying supply/demand dynamics.
- In professional trading, the 'Adam and Eve' variant (sharp first peak, rounded second peak) has the highest statistical reliability.
Frequently Asked Questions
No. A tolerance of 1-3% between the two peak levels is standard. The key is that both peaks are rejected at approximately the same zone of resistance.
Measure the vertical distance from the peak level to the neckline (trough between the peaks). Project this same distance downward from the neckline break. This is the measured move target.
A Double Top has two peaks at similar levels. A Head and Shoulders has three peaks where the middle peak (head) is higher than the two side peaks (shoulders). Both are reversal patterns but the H&S is generally considered more reliable.