Overview
Bearish Broadening Top
Also known as: Megaphone Top, Broadening Formation, Expanding Triangle Top
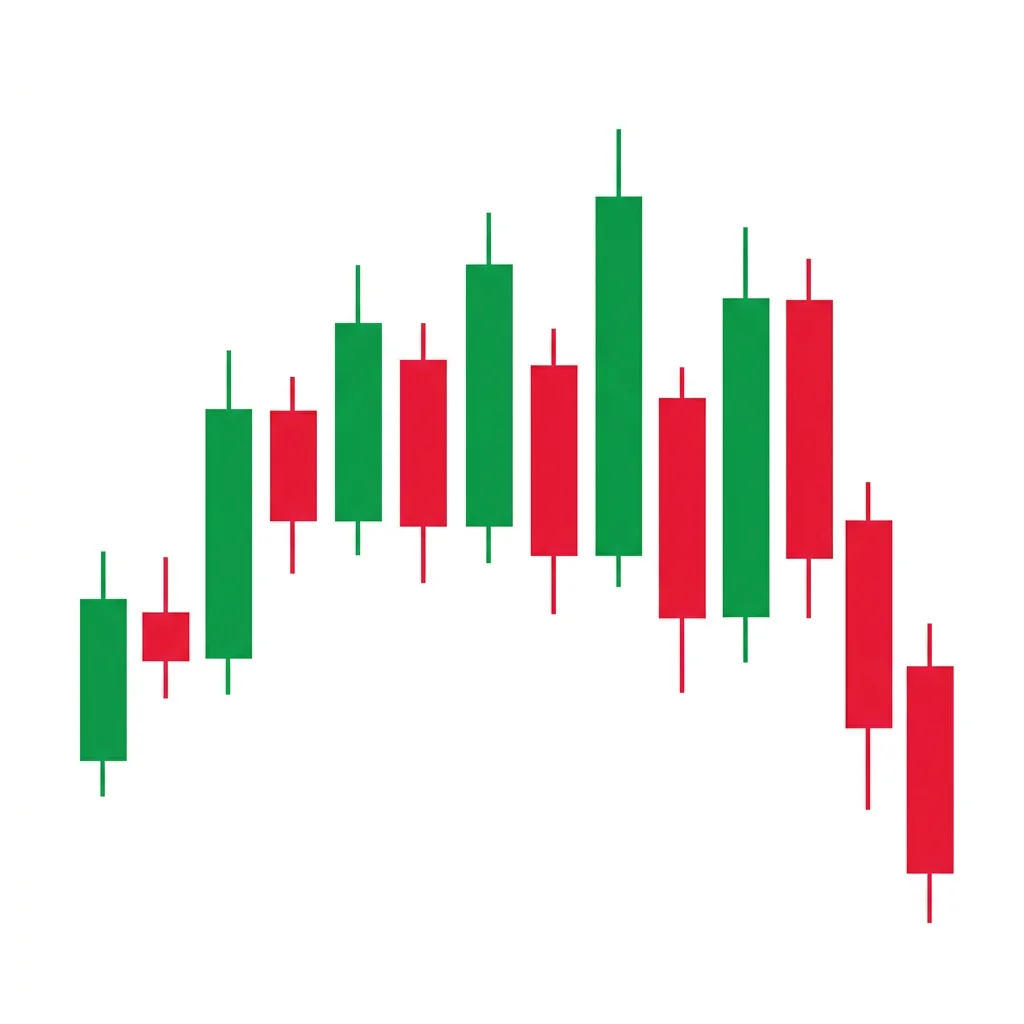
The Broadening Top (Megaphone) is a chart formation characterized by expanding price swings that create higher highs and lower lows, reflecting increasing volatility and instability at market tops before a bearish breakdown.
The Broadening Top, also known as the Megaphone pattern, is a chart formation that develops at market tops. Unlike most chart patterns where price contracts (like triangles), the Broadening Top expands — each swing makes a wider move than the last, with higher highs and lower lows. This creates two diverging trendlines that look like a megaphone or the bell of a trumpet. The pattern reflects growing disagreement between buyers and sellers, with emotional extremes on both sides. It typically occurs during periods of high speculation, news-driven volatility, or uncertain market conditions. The bearish resolution comes when price breaks below the lower trendline, often leading to a significant decline. The pattern is notoriously difficult to trade within due to the wide, unpredictable swings, but the breakdown itself can be highly profitable.
History & Etymology
The Broadening Top was first described by Richard Schabacker in the 1930s and later detailed by Robert Edwards and John Magee in their landmark book 'Technical Analysis of Stock Trends' (1948). They noted the pattern frequently appeared at major market tops, including before the 1929 crash. The pattern has since been associated with periods of increasing market instability.
The name 'Broadening Top' describes the pattern's appearance — the price range broadens (widens) over time at the top of a market. 'Megaphone' is a more visual name, as the diverging trendlines resemble a megaphone when viewed from left to right.
How It Forms
Formation Steps
- 1Price makes at least two higher highs and two lower lows
- 2Trendlines connecting highs and lows diverge, creating a megaphone shape
- 3The upper trendline slopes up while the lower trendline slopes down
- 4Volatility increases progressively as the pattern develops
- 5Breakdown occurs when price breaks below the lower trendline
Prerequisites
- Prior uptrend leading into the formation
- At least two swing highs and two swing lows to define the diverging trendlines
- Each successive swing should extend beyond the previous (wider swings)
Confirmation Signals
- Decisive close below the lower trendline
- Volume expansion on the breakdown
- Retest of the lower trendline as resistance
- Follow-through selling after the breakdown
Invalidation Signals
- Strong breakout above the upper trendline on high volume
- Price consolidates narrowly within the pattern instead of expanding
- Volume increases on upswings rather than downswings
Candle Breakdown
First Swing High
The initial swing high establishes the first point of the upper trendline.
Bulls push price to a new high, establishing the initial boundary of the pattern.
First Swing Low
Price pulls back below the prior swing low, establishing the first point of the lower trendline.
The deeper-than-expected pullback creates unease. Volatility is starting to expand.
Higher Swing High
Price rallies above the first swing high, creating the second point for the upper trendline.
Bulls see the new high as confirmation. But the wider swing suggests emotional, not rational, buying.
Lower Swing Low / Breakdown
Price falls below the previous swing low, completing the pattern and potentially triggering the breakdown.
Panic sets in as the wider swing low breaks the pattern. Sellers dominate as the instability resolves bearishly.
Psychology
The Broadening Top reflects a market in turmoil. Rather than converging toward consensus, opinions are diverging — creating wider and wider swings. This is typically a sign of speculative excess and institutional distribution disguised by volatile price action.
Buyer Perspective
Buyers see each new high as bullish confirmation and buy aggressively. They are encouraged by the higher highs but become increasingly confused by the deeper pullbacks. Their conviction is tested with each wider swing.
Seller Perspective
Sellers gain confidence with each deeper pullback. They recognize the increasing instability as a sign of distribution. Smart sellers use the higher highs as opportunities to establish short positions at better prices.
Smart Money Action
Institutions use the volatile swings to distribute large positions. They sell into strength at each higher high and may even accumulate shorts. The wide swings provide the liquidity they need to move large positions without significantly impacting price.
Retail Trader Trap
Retail traders get whipsawed by the expanding swings. They buy at highs and sell at lows, consistently arriving late to each swing. The increasing volatility also triggers stops on both sides, benefiting market makers.
Emotional Cycle
Trading Strategy
Aggressive Entry
Short on the third or fourth touch of the upper trendline within the pattern.
Conservative Entry
Wait for a confirmed close below the lower trendline with above-average volume.
The height of the pattern measured from the breakdown point.
Previous major support level below the pattern.
1.618x the pattern height, projected downward from the breakdown.
Best Conditions
- Timeframe: daily
- Timeframe: weekly
- Timeframe: 4h
- speculative market tops
- news-driven uncertainty
- pre-crash environments
- Asset: stocks
- Asset: indices
- Asset: crypto
Avoid When
- Timeframe: 1m
- Timeframe: 5m
- low-volatility trending market
- post-crash recovery
Confluence Factors
- Volume divergence (increasing on downswings)
- RSI divergence at each successively higher high
- Pattern forms near all-time highs or major resistance
- Market breadth narrowing while indices make new highs
- VIX rising while indices are in the Broadening Top
Scale In Strategy
Short 33% at the upper trendline, add 33% on a break of the midpoint, add 34% on the breakdown.
Scale Out Strategy
Take 33% at the pattern height target, 33% at the next support, trail the rest.
Risk Management
Volume Analysis
Volume Confirmation
Volume should increase on downswings and decrease on upswings as the pattern matures. A volume spike on the breakdown is the strongest confirmation.
Volume Profile
Erratic volume within the pattern is normal. The key is that the breakdown candle has significantly higher volume than recent averages.
Volume Divergence
If upswings have declining volume while downswings have increasing volume, the pattern is more likely to resolve bearishly.
Technical Confluence
Support Resistance
The diverging trendlines act as dynamic support and resistance. The breakdown below the lower trendline is the critical level.
Fibonacci Levels
After the breakdown, target the 38.2%, 50%, and 61.8% retracement levels of the entire uptrend that preceded the pattern.
Moving Averages
The 50-day moving average often gets whipsawed during the Broadening Top. A break below the 200-day MA after the pattern breakdown is very bearish.
Rsi Confirmation
Classic bearish divergence — each higher high in price paired with a lower high in RSI — strongly confirms the Broadening Top's bearish bias.
Macd Confirmation
MACD making lower highs while price makes higher highs within the pattern is textbook confirmation.
Bollinger Bands
Bollinger Bands typically widen significantly during the Broadening Top, reflecting the expanding volatility.
Vwap
Price oscillating above and below VWAP within the pattern shows the tug-of-war between buyers and sellers.
Ichimoku Cloud
The Broadening Top often sees price piercing the cloud in both directions. A decisive break below the cloud after the pattern breakdown confirms the trend change.
Elliott Wave
The Broadening Top often forms as an Expanding Flat (3-3-5) or a diagonal pattern at the end of Wave 5.
Wyckoff Phase
The pattern aligns with a complex distribution phase where multiple Upthrusts and Signs of Weakness create the expanding swings.
Market Profile
The pattern creates an elongating value area with poor extremes (thin volume at highs and lows), indicating unstable structure.
Order Flow
Watch for aggressive selling at each higher high and aggressive buying at each lower low. The side that eventually gives up triggers the breakdown or breakout.
Open Interest
Rising open interest during the pattern indicates new positions on both sides. A sharp rise on the breakdown suggests new shorts are entering.
Multi-Timeframe Analysis
Higher Timeframe Alignment
A daily Broadening Top with a weekly RSI divergence is a powerful combination for a major top call.
Lower Timeframe Entry
After the daily pattern breaks down, use the 1-hour chart to find re-entry points on pullbacks to the broken trendline.
Timeframe Confluence
A Broadening Top on the weekly chart is a major structural warning signal that can impact months of price action.
Top-Down Approach
Monthly: check for overextension. Weekly: identify the Broadening Top. Daily: trade the breakdown. 4H: manage the position.
Statistics
Historical Examples
S&P 500 Broadening Top Before 2020 Crash
successThe S&P 500 formed a Broadening Top pattern in early 2020 with expanding swings between 3,200 and 3,400. The breakdown in late February led to the COVID crash, with the index falling over 35% in a month.
Lesson: Broadening Tops at all-time highs can precede major market crashes. The expanding volatility reflected growing uncertainty about COVID's impact.
Dow Jones Broadening Top 2018
successThe Dow formed a multi-month Broadening Top throughout 2018 with multiple whipsaws. The eventual breakdown in Q4 2018 led to a 19% decline from peak to trough.
Lesson: Broadening Tops on weekly charts can take months to develop. Patience is required, and trading within the pattern is treacherous due to the wide swings.
Variations
Right-Angled Broadening Top
The upper trendline is roughly horizontal while the lower trendline slopes downward.
Broadening Wedge Top
Both trendlines slope upward but diverge, with the upper line having a steeper slope.
Confusion Matrix
Patterns commonly confused with Bearish Broadening Top and how to distinguish them.
Bearish Diamond Top
6500% similarIf the swings begin contracting after the widest point, it is a Diamond. If swings keep expanding or the pattern breaks down from the wide end, it is a Broadening Top.
Key Differences
- Diamond Top has a contracting second half; Broadening Top only expands
- Diamond Top is essentially a Broadening formation followed by a Symmetric Triangle
- Broadening Top has wider final swings; Diamond Top narrows
Bearish Head Shoulders
4000% similarThe Broadening Top creates progressively wider swings with higher highs AND lower lows. The Head and Shoulders has a specific three-peak structure with a roughly horizontal neckline.
Key Differences
- Head and Shoulders has a defined neckline and three peaks
- Broadening Top has diverging trendlines and multiple expanding swings
- H&S is more symmetrical; Broadening Top is chaotic
The Diamond Top is a rare reversal pattern that forms at market peaks, consisting of a broadening formation followed by a contracting formation, creating a diamond shape that signals a shift from expansion to contraction and ultimately a bearish breakdown.
The Double Top is an M-shaped reversal pattern where price tests a resistance level twice and fails, creating two peaks at similar levels. The breakdown below the neckline (trough between peaks) confirms the reversal with a measured move target equal to the pattern height.
The head and shoulders is the most well-known reversal pattern in technical analysis. It consists of three peaks — a higher middle peak (head) flanked by two lower peaks (shoulders) — and signals a major bearish reversal when the neckline breaks.
The Bullish Broadening Bottom is an expanding volatility pattern where price makes successively wider swings. When it resolves with an upside breakout above the upper trendline, it signals a powerful reversal higher.
The Descending Channel is a chart formation where price trends lower within two parallel downward-sloping trendlines, making consistent lower highs and lower lows in an orderly bearish progression.
The Descending Triangle is a bearish continuation pattern featuring a flat support level with lower highs converging into an apex, typically resolving with a breakdown below the horizontal support as sellers gradually overwhelm buyers.
Pro Tips & Common Mistakes
Pro Tips
- The Broadening Top is one of the most difficult patterns to trade in real-time because the expanding swings trigger stops on both sides. The safest approach is to wait for the confirmed breakdown.
- Count the touches on each trendline. At least 2 touches on each side are needed to establish the pattern, and 3 touches add more reliability.
- The pattern is frequently associated with major market tops. If you see a Broadening Top on a major index, take it very seriously.
- Volatility-based indicators (VIX, ATR, Bollinger Band width) rising during the pattern formation provide excellent confirmation.
- Do not try to pick tops within the pattern by shorting at the upper trendline early. Wait until the pattern is well-established with at least 3-4 swings.
Common Mistakes
- Trading within the pattern without recognizing it — the wide swings cause frequent stop-outs on both long and short positions.
- Misidentifying a normal wide trading range as a Broadening Top — the key distinction is that each swing must exceed the previous one.
- Placing stops too tight when trading the breakdown — the pattern is inherently volatile and retests are common.
- Shorting at the upper trendline on the first or second touch before the pattern is confirmed.
- Ignoring that 40-45% of Broadening Tops break out to the upside instead of breaking down.
Advanced Techniques
- Trade the Broadening Top with options straddles or strangles to profit from the expanding volatility, then convert to directional on the breakdown.
- Use the CBOE VIX or implied volatility to confirm the expanding uncertainty that drives the Broadening Top.
- Apply Wyckoff analysis to the internal structure — identify Upthrusts (false breakouts above the upper line) as distribution signals.
Institutional Perspective
Institutions recognize the Broadening Top as a sign of market structure deterioration. The expanding swings indicate that consensus is breaking down. Large funds use the volatile swings to execute distribution programs, selling into each rally and creating the pattern's characteristic wider swings.
Fun Facts
- The Broadening Top is sometimes called the 'megaphone of doom' because of its association with major market crashes, including the 1929 and 2020 tops.
- Edwards and Magee, who popularized the pattern, noted it was particularly common in 'emotionally charged' markets — relevant to today's social media-driven trading.
- The pattern is one of the few chart formations that actually increases in volatility over time rather than decreasing, making it unique in technical analysis.
Frequently Asked Questions
Broadening Tops are caused by increasing disagreement between buyers and sellers. Each group pushes price further in their direction, creating wider swings. This typically occurs during periods of uncertainty, speculative excess, or conflicting news and economic signals.
Yes. Approximately 40-45% of Broadening Tops resolve with an upside breakout. This is why it is important to wait for directional confirmation rather than assuming a bearish outcome.
Trading inside the pattern is high-risk due to the wide, unpredictable swings. If you must, use the trendlines as guides — short at the upper line, cover at the lower. But the safest approach is to wait for the confirmed breakdown or breakout.
The classic measured move target is the height of the pattern (from the upper trendline to the lower trendline at the widest point) subtracted from the breakdown point.