Overview
Bearish Head and Shoulders
Also known as: Head and Shoulders Top, H&S Top, Triple Peak Reversal
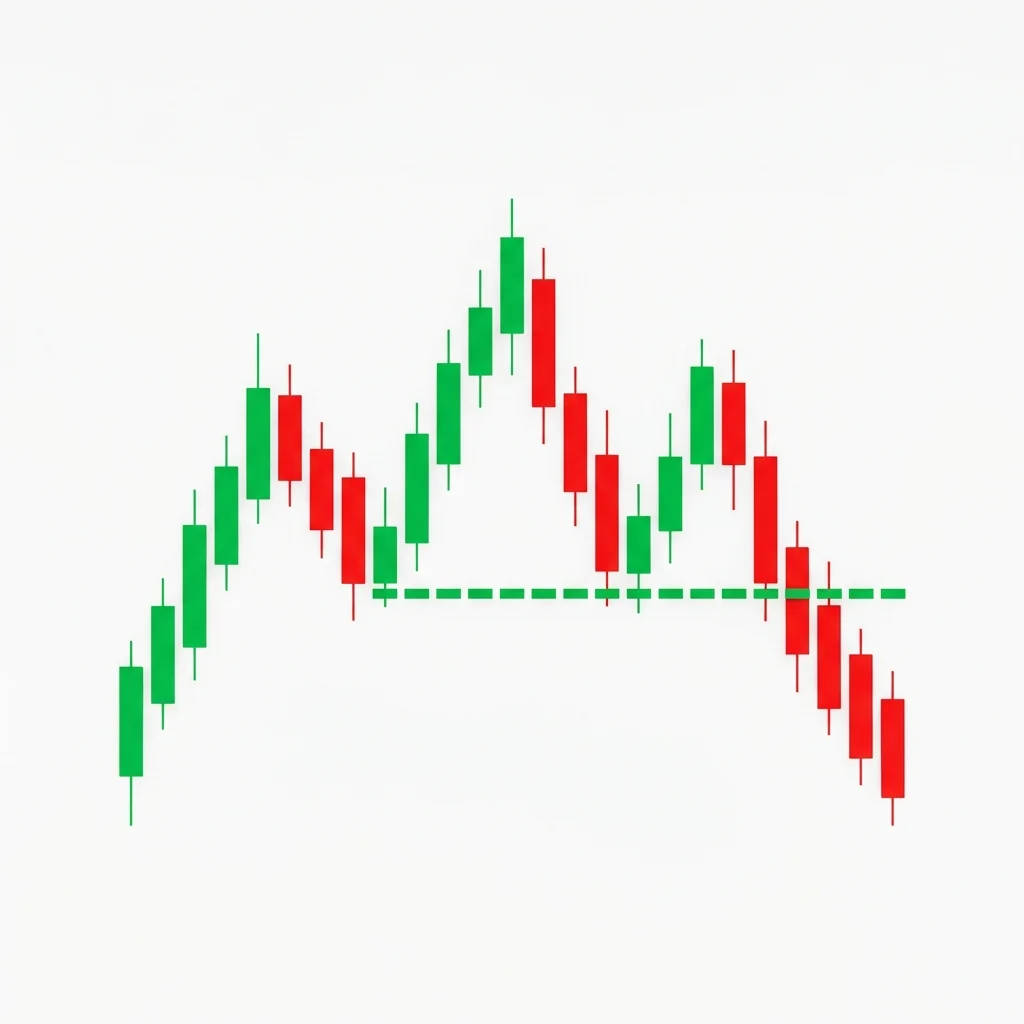
The head and shoulders is the most well-known reversal pattern in technical analysis. It consists of three peaks — a higher middle peak (head) flanked by two lower peaks (shoulders) — and signals a major bearish reversal when the neckline breaks.
The head and shoulders top is considered the 'gold standard' of reversal patterns. It forms over weeks to months as an uptrend progressively loses momentum. The left shoulder marks the first failed attempt to continue higher, the head makes a new high but with less conviction, and the right shoulder fails to reach the head's height — confirming the trend's exhaustion. The neckline connects the two reaction lows between the peaks. A decisive break below the neckline completes the pattern and targets a measured move equal to the distance from the head to the neckline. The pattern's reliability stems from its clear representation of the psychological transition from bullish to bearish sentiment.
History & Etymology
The head and shoulders pattern was first formally described by Richard W. Schabacker in his 1930 book 'Stock Market Theory and Practice.' It was later popularized by Robert D. Edwards and John Magee in 'Technical Analysis of Stock Trends' (1948). It has been one of the most studied and validated patterns in technical analysis for nearly a century.
Named for its visual resemblance to a human head and shoulders profile. The three peaks look like a person's left shoulder, head, and right shoulder when viewed from the front.
How It Forms
Formation Steps
- 1Left shoulder: rally to a peak, followed by a decline to a trough
- 2Head: rally to a higher peak than the left shoulder, decline to a trough near the first trough level
- 3Right shoulder: rally to a peak lower than the head (approximately level with the left shoulder)
- 4Neckline: a line connecting the two troughs between the three peaks
- 5Breakdown: price breaks below the neckline with volume
Prerequisites
- Significant prior uptrend
- At least 2-3 months of uptrend before formation begins
Confirmation Signals
- Price closes below the neckline on above-average volume
- Right shoulder volume is lower than head volume
- RSI shows bearish divergence across the three peaks
Invalidation Signals
- Price breaks above the head (highest peak)
- Right shoulder exceeds the height of the head
- Volume increases dramatically on the right shoulder rally
Candle Breakdown
Left Shoulder Rally
A rally that forms the first peak with strong volume, followed by a pullback.
Bulls are still in control. This rally looks like normal trend continuation.
Head Rally
A rally to a new high above the left shoulder, but often on declining volume relative to the left shoulder.
Price makes a new high but participation is waning. This is the first divergence signal.
Right Shoulder Rally
A rally that fails to reach the head's height, often on noticeably lower volume.
Buyers cannot push to new highs. The lower peak confirms weakening demand and the transition to bearish control.
Neckline Breakdown
Price breaks below the neckline with increased volume, completing the pattern.
Remaining bulls capitulate as the last support fails. Shorts pile in aggressively.
Psychology
The head and shoulders pattern maps the complete transition from bullish to bearish sentiment. The left shoulder shows peak buying, the head shows the last gasp of bulls, and the right shoulder shows failed buying attempts as sellers take control.
Buyer Perspective
Buyers grow increasingly frustrated. After making a new high (head), they cannot sustain momentum. The failure to reach a new high on the right shoulder triggers profit-taking and capitulation.
Seller Perspective
Sellers progressively gain confidence through the formation. The declining volume on each rally tells them that buying pressure is fading. The neckline break is their signal to press aggressively.
Smart Money Action
Institutions distribute (sell) their positions during the head and right shoulder formation. Each rally is used as an exit opportunity. The neckline break is when the last institutional longs exit and shorts are fully deployed.
Retail Trader Trap
Retail traders buy each dip during the formation, viewing pullbacks as buying opportunities. They buy the left shoulder dip, the head dip, and the right shoulder dip — getting trapped each time as the pattern eventually breaks down.
Emotional Cycle
Trading Strategy
Aggressive Entry
Short when the right shoulder begins to roll over, before the neckline breaks. This provides the best risk-reward but has higher failure risk.
Conservative Entry
Short on a confirmed close below the neckline with above-average volume. Alternatively, wait for a retest of the neckline from below (throwback) and enter on the rejection.
Measured move: distance from the head to the neckline, projected downward from the neckline break.
1.5x the measured move for extended targets.
Start of the prior uptrend (the major support that preceded the rally).
Best Conditions
- Timeframe: daily
- Timeframe: weekly
- Timeframe: 4h
- end of bull market
- sector rotation
- tightening monetary policy
- Asset: stocks
- Asset: indices
- Asset: forex
- Asset: commodities
Avoid When
- Timeframe: 1m
- Timeframe: 5m
- Timeframe: 15m
- strong bull trend
- QE environment
- early-stage rally
Confluence Factors
- Volume declining across peaks
- RSI bearish divergence across the three peaks
- Right shoulder aligns with a moving average (50 or 200 SMA)
- Neckline at a psychologically significant price level
- Broader market showing signs of weakness
Scale In Strategy
Enter 33% at right shoulder rollover, 33% at neckline break, 33% on neckline retest rejection.
Scale Out Strategy
Take 33% at 50% of measured move, 33% at full measured move, trail remaining.
Risk Management
Volume Analysis
Volume Confirmation
Volume should decrease across the three peaks (left shoulder > head > right shoulder). Volume should expand on the neckline breakdown. This volume pattern is critical.
Volume Profile
The neckline area should show a high-volume node — this represents the battle zone. Breaking through this high-volume area signals a decisive shift.
Volume Divergence
Declining volume across peaks is the hallmark volume pattern. If volume increases on the right shoulder, the pattern may fail.
Technical Confluence
Support Resistance
The neckline is the critical support level. Once broken, it becomes resistance on any retest (throwback).
Fibonacci Levels
The measured move target often aligns with the 61.8% or 100% Fibonacci retracement of the prior uptrend.
Moving Averages
The right shoulder often fails at the 50 SMA. A neckline break below the 200 SMA is especially significant as it triggers long-term trend change signals.
Rsi Confirmation
Bearish RSI divergence (lower RSI highs with higher price highs from left shoulder to head to right shoulder) is a classic confirmation.
Macd Confirmation
MACD making lower highs across the three peaks and crossing bearish during the right shoulder confirms momentum loss.
Bollinger Bands
The right shoulder failing within the Bollinger Bands while the head pierced the upper band shows contracting momentum.
Vwap
Anchored VWAP from the left shoulder often provides resistance during the right shoulder formation.
Ichimoku Cloud
The neckline break below the Kumo cloud is extremely bearish on higher timeframes.
Elliott Wave
The head and shoulders pattern often forms as the combination of Wave 3 (left shoulder), Wave 5 (head), and a failed Wave 1 of a new upward sequence (right shoulder) before the correction.
Wyckoff Phase
The head and shoulders is the classic distribution schematic. Left shoulder = preliminary supply, head = buying climax, right shoulder = last point of supply, neckline break = sign of weakness.
Market Profile
The neckline area forms a significant high-volume node. The breakdown from this node signals a shift in value area.
Order Flow
Passive selling increases at each peak (left shoulder → head → right shoulder). The neckline break shows aggressive selling domination.
Open Interest
Put-call ratio increasing during the right shoulder formation confirms institutional hedging and bearish positioning.
Multi-Timeframe Analysis
Higher Timeframe Alignment
H&S on the weekly chart is a major event — it can signal a months-long trend change. Monthly H&S patterns are among the most powerful signals in all of technical analysis.
Lower Timeframe Entry
Use the 4H chart to fine-tune the neckline break entry and identify the throwback rejection.
Timeframe Confluence
If you see H&S developing on both the daily and weekly charts, the reversal is significantly more likely to succeed.
Top-Down Approach
Monthly trend exhaustion → Weekly H&S forming → Daily neckline break → 4H throwback entry.
Statistics
Historical Examples
S&P 500 Head and Shoulders 2007
successThe S&P 500 formed a massive head and shoulders top over several months in 2007. The neckline break in late 2007 preceded the 2008 financial crisis, with the index declining over 50% from the head.
Lesson: Major H&S patterns on weekly/monthly charts at market cycle peaks can signal devastating declines.
Bitcoin H&S 2021
successBitcoin formed a head and shoulders pattern between February and May 2021 with the head near $65K. The neckline break around $43K led to a decline to $29K — nearly achieving the full measured move.
Lesson: H&S patterns in crypto tend to achieve their measured moves quickly due to the market's higher volatility.
Variations
Complex Head and Shoulders
Multiple left or right shoulders create a broader, more complex formation.
Head and Shoulders with Sloping Neckline
The neckline slopes upward or downward rather than being horizontal.
Failed Head and Shoulders
The pattern forms but price breaks above the neckline in the other direction, invalidating the pattern.
Confusion Matrix
Patterns commonly confused with Bearish Head and Shoulders and how to distinguish them.
Bearish Triple Top
70% similarIf the middle peak is clearly higher than the other two, it is a head and shoulders. If all three peaks are at approximately the same level, it is a triple top.
Key Differences
- Triple top has three peaks at roughly the same level
- Head and shoulders has a higher middle peak
- H&S has a clearer measured move calculation
Bearish Double Top
50% similarCount the peaks. Two peaks = double top. Three peaks with a higher middle = head and shoulders.
Key Differences
- Double top has two peaks; H&S has three
- H&S has declining momentum across three peaks
- H&S typically takes longer to form
The Double Top is an M-shaped reversal pattern where price tests a resistance level twice and fails, creating two peaks at similar levels. The breakdown below the neckline (trough between peaks) confirms the reversal with a measured move target equal to the pattern height.
The H&S neckline retest occurs when price pulls back to retest the broken neckline from below (throwback), gets rejected, and continues the measured move decline. It provides a second entry opportunity for traders who missed the original breakdown.
The rounding top is a gradual reversal pattern shaped like an inverted saucer. Price slowly transitions from an uptrend to a downtrend in a smooth arc, with volume declining at the peak and expanding on the neckline breakdown.
The triple top is a powerful bearish reversal pattern formed by three peaks at approximately the same price level, separated by two pullbacks. The pattern confirms when price breaks below the neckline, with a measured target equal to the pattern's height projected downward.
The Inverse Head and Shoulders is one of the most reliable bullish reversal patterns, featuring three troughs with the middle one (head) being the deepest, signaling a major transition from a downtrend to an uptrend.
The Broadening Top (Megaphone) is a chart formation characterized by expanding price swings that create higher highs and lower lows, reflecting increasing volatility and instability at market tops before a bearish breakdown.
Pro Tips & Common Mistakes
Pro Tips
- Volume declining across the three peaks is the most important confirmation — do not trade H&S without this volume pattern.
- The neckline does not have to be perfectly horizontal — sloping necklines are common and valid.
- A 65% chance of a throwback (retest of the neckline from below) means you often get a second entry opportunity.
- The measured move target is achieved approximately 60-70% of the time. Use it as a guide, not a guarantee.
- Right shoulder that is significantly lower than the left shoulder suggests very weak buying — the breakdown will be more forceful.
Common Mistakes
- Seeing head and shoulders patterns everywhere — not every three-peak formation is a valid H&S.
- Entering before the neckline breaks — many right shoulders lead to continued rallies.
- Ignoring the volume pattern — without declining volume across peaks, the pattern is unreliable.
- Not accounting for the neckline slope in measured move calculations.
- Trading H&S on very short timeframes where it is less reliable.
Advanced Techniques
- Use the volume-weighted approach: weight the measured move target by the volume pattern's quality.
- Monitor options skew during formation — increasing put skew during the right shoulder confirms institutional hedging.
- Combine with Wyckoff phase analysis: the H&S maps perfectly to the distribution schematic.
- Use market breadth divergence: if the index makes a new high at the head but advance-decline line doesn't, the H&S is more likely to complete.
- Measure the time symmetry: right shoulders that form in approximately the same time as left shoulders are more reliable.
Institutional Perspective
The head and shoulders is the institutional distribution pattern by excellence. The three peaks represent progressive distribution: initial selling (left shoulder), selling into the final push (head), and final distribution (right shoulder). The neckline break is when institutional selling is complete and the public is left holding.
Fun Facts
- The head and shoulders pattern has been studied in academic finance for over 80 years and remains one of the few chart patterns with robust statistical backing.
- Thomas Bulkowski's comprehensive research found that the H&S pattern achieves its measured move target about 55-60% of the time — making it one of the most reliable chart formations.
- The largest head and shoulders pattern ever identified on the S&P 500 spanned from 2000-2007 on the monthly chart, preceding the Great Financial Crisis.
Frequently Asked Questions
A head and shoulders is a bearish reversal pattern consisting of three peaks — a higher middle peak (head) flanked by two lower peaks (shoulders). When price breaks below the neckline connecting the two troughs, it signals a major trend reversal.
Measure the vertical distance from the head to the neckline. Project that distance downward from the neckline break point. This is the measured move target, achieved approximately 60-70% of the time.
The head and shoulders is one of the most reliable reversal patterns, with a success rate of approximately 75% when properly identified with volume confirmation. It has been validated by decades of academic and practical research.
Yes, approximately 25% of H&S patterns fail. A failed H&S (where price breaks above the right shoulder instead of below the neckline) can actually produce a strong bullish continuation signal.