Overview
Bearish Rising Channel Break
Also known as: Ascending Channel Breakdown, Rising Channel Failure, Channel Break Down
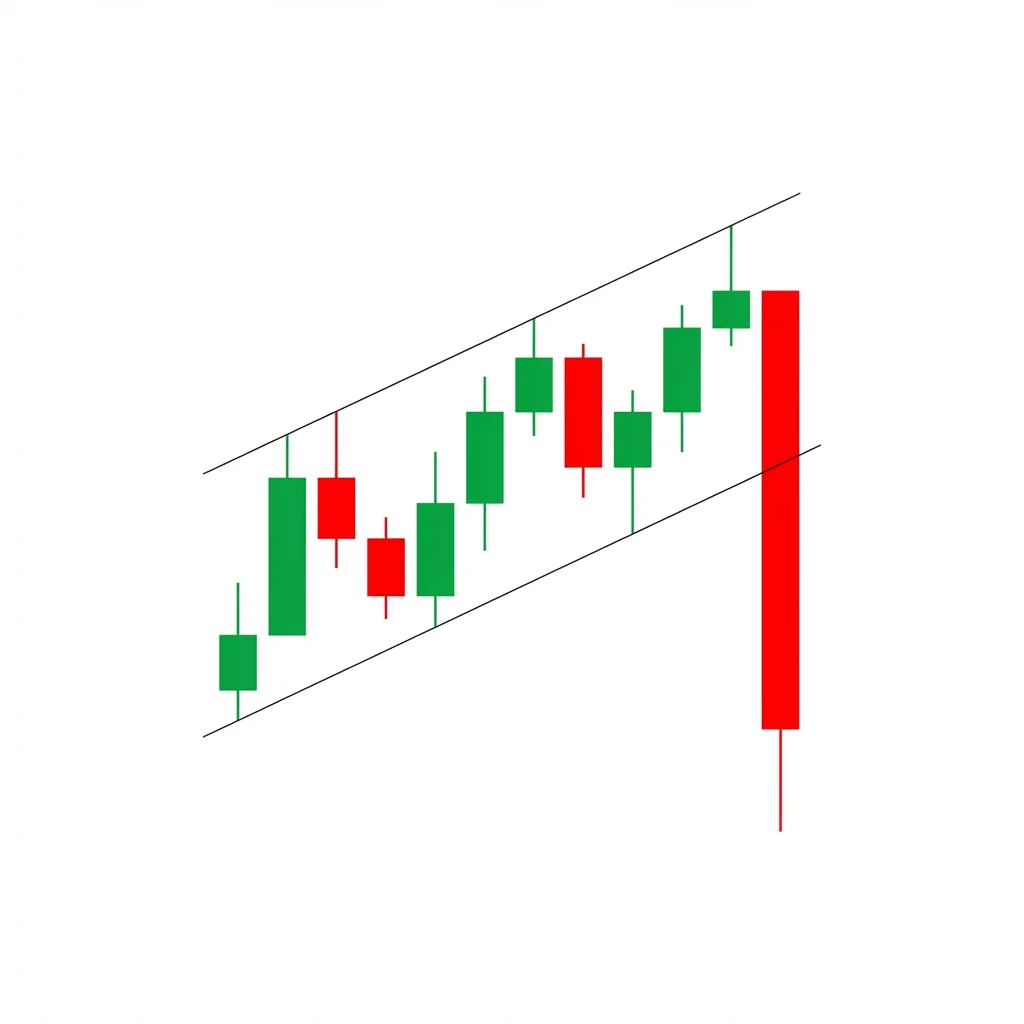
A bearish rising channel break occurs when price has been trading within an ascending channel and breaks below the lower trendline, signaling the end of the uptrend. The measured target equals the channel's width projected downward from the breakout point.
A rising channel (or ascending channel) consists of two parallel upward-sloping trendlines that contain price action. While the channel is intact, it represents a healthy uptrend. However, when price breaks below the lower trendline, it signals that buyers can no longer maintain the pace of the uptrend. This breakdown is significant because it ends the pattern of higher lows that defined the channel. The measured move target is the width of the channel projected downward from the breakdown point. Rising channel breaks are particularly powerful when they occur after extended channels, when volume expands on the breakdown, and when the broken lower trendline is retested and holds as resistance.
History & Etymology
Channel analysis has been a core technique in technical analysis since the early 20th century. The concept of drawing parallel trendlines to contain price was popularized by Richard Schabacker and later refined by Edwards and Magee. Channel breaks remain one of the most widely traded patterns.
'Rising' describes the upward slope of the channel. 'Channel' refers to the parallel trendlines containing the price action. 'Break' indicates the failure of the lower boundary, signaling a reversal.
How It Forms
Formation Steps
- 1Price moves in a well-defined ascending channel with parallel trendlines
- 2At least two touches on both the upper and lower channel boundaries
- 3Price breaks below the lower trendline of the rising channel
- 4Volume increases on the breakdown
Prerequisites
- Well-established rising channel with at least two touches on each boundary
- Price has respected the channel for multiple oscillations
Confirmation Signals
- Close below the lower channel trendline
- Volume expansion on the breakdown
- Failed retest of the broken trendline from below
- Moving averages turning down
Invalidation Signals
- Price quickly reclaims the channel
- Strong bounce off the lower trendline
- Volume supporting a recovery back into the channel
Candle Breakdown
Channel Candles
Candles oscillating between the upper and lower channel boundaries in an orderly uptrend.
Buyers and sellers maintain equilibrium within the channel. Each test of the lower trendline brings buyers, and each test of the upper trendline brings sellers.
Warning Candle
A candle that fails to reach the upper channel boundary, creating a lower high within the channel.
Buyers are losing momentum. The inability to reach the upper boundary is the first sign that the channel may fail.
Breakdown Candle
A strong bearish candle that closes below the lower trendline of the rising channel.
The lower trendline that previously attracted buyers fails. Stop losses below the trendline trigger, accelerating the decline.
Psychology
The rising channel represents a controlled uptrend. The break below the lower boundary signals that the orderly advance has ended and sellers have gained the upper hand.
Buyer Perspective
Buyers have been buying at the lower trendline throughout the channel. The break below this level shakes their confidence and triggers stop losses.
Seller Perspective
Sellers recognize that each rally within the channel is getting weaker. The channel break gives them conviction to enter aggressive short positions.
Smart Money Action
Institutional traders begin selling into the rallies within the channel, gradually reducing exposure. The channel break confirms their thesis, and they add to short positions.
Retail Trader Trap
Retail traders continue buying at the lower trendline, expecting the pattern to repeat. The breakdown catches them off guard.
Emotional Cycle
Trading Strategy
Aggressive Entry
Enter short when price closes below the lower channel trendline.
Conservative Entry
Wait for a pullback that retests the broken trendline from below, then enter short when it holds as resistance.
Channel width projected downward from the breakdown point
Next major support level below
150% of the channel width for extended moves
Best Conditions
- Timeframe: 1D
- Timeframe: 4h
- Timeframe: 1W
- Maturing uptrends
- Rising interest rate environments
- Sector rotation periods
- Asset: Stocks
- Asset: Indices
- Asset: Forex
- Asset: Crypto
Avoid When
- Timeframe: 1m
- Timeframe: 5m
- Strong momentum-driven rallies
- Early-stage uptrends
Confluence Factors
- RSI bearish divergence during the channel
- MACD histogram declining within the channel
- Volume declining on successive rallies
- Channel break coincides with a death cross
- Fundamental catalyst (earnings miss, rate hike)
Scale In Strategy
Enter initial position on the breakdown, add on the pullback retest of the broken trendline.
Scale Out Strategy
Take 50% at the measured move target, trail the rest with the 20 EMA.
Risk Management
Volume Analysis
Volume Confirmation
Volume should decrease during the final oscillation within the channel and spike on the breakdown.
Volume Profile
Declining volume on rallies within the channel is a leading indicator of the breakdown.
Volume Divergence
If volume increases on a rally to the upper boundary, the channel may continue rather than break down.
Technical Confluence
Support Resistance
The broken lower trendline becomes a key resistance level. Previous horizontal supports within the channel become targets.
Fibonacci Levels
The channel width often corresponds to Fibonacci-related proportions of the prior trend.
Moving Averages
The breakdown often coincides with price crossing below the 50 SMA, adding confirmation.
Rsi Confirmation
RSI divergence (making lower highs while price makes higher highs within the channel) is a classic warning sign.
Macd Confirmation
MACD crossing below zero after a bearish crossover during the channel confirms the momentum shift.
Bollinger Bands
Bollinger Band squeeze at the lower trendline followed by expansion on the breakdown signals a volatility event.
Vwap
Price crossing below VWAP on the breakdown confirms the intraday trend change.
Ichimoku Cloud
Breaking below the Kumo cloud as the channel breaks down provides strong bearish confirmation.
Elliott Wave
Rising channels often contain Wave 3 or Wave 5 of an Elliott impulse. The channel break signals the impulse completion.
Wyckoff Phase
A rising channel that breaks down may signal the transition from the uptrend to a distribution phase.
Market Profile
The breakdown below the channel moves price out of the developing value area, signaling a new lower auction.
Order Flow
Cumulative delta turning negative during the channel and accelerating on the breakdown confirms seller dominance.
Open Interest
Monitor open interest changes for additional confirmation of institutional participation in the move.
Multi-Timeframe Analysis
Higher Timeframe Alignment
A daily channel break is strongest when the weekly chart shows overbought conditions or bearish divergence.
Lower Timeframe Entry
Use the 1H chart to identify the exact break of the daily channel's lower trendline for a precise entry.
Timeframe Confluence
A 4H channel break within a daily reversal setup provides the best combination of timing and direction.
Top-Down Approach
Weekly overbought conditions > Daily channel approaching lower boundary > 4H breakdown signal > 1H entry.
Statistics
Historical Examples
S&P 500 Rising Channel Break 2022
successThe S&P 500 traded in a rising channel from March 2020 to January 2022. The break below the lower trendline coincided with the beginning of the 2022 bear market, leading to a 25% decline.
Lesson: Multi-year rising channel breaks on weekly charts signal major trend reversals that can last months.
EUR/USD Rising Channel Break
successEUR/USD traded in a 4H rising channel for three weeks before breaking the lower trendline. The breakdown led to a 250-pip decline to the measured move target.
Lesson: 4H channel breaks in forex produce reliable measured moves, making them excellent for target-based trading.
Variations
Steep Channel Break
A rising channel with a steep angle (>45 degrees) that breaks down suddenly.
Widening Channel Break
A channel where the width gradually increases (expanding channel) before breaking down.
Confusion Matrix
Patterns commonly confused with Bearish Rising Channel Break and how to distinguish them.
Bearish Rising Wedge
7500% similarCheck if the trendlines converge (wedge) or remain parallel (channel). A wedge narrows toward an apex; a channel maintains consistent width.
Key Differences
- Rising wedge has converging trendlines; rising channel has parallel trendlines
- Rising wedge has a built-in bearish bias; rising channel is neutral until it breaks
- Rising wedge typically resolves to the downside; channels can break either way
The Bearish Engulfing is one of the most powerful and commonly traded two-candle reversal patterns. A large bearish candle completely engulfs the prior bullish candle, demonstrating a decisive shift from buying to selling dominance.
A bearish reversal is the comprehensive transition from an uptrend to a downtrend, marked by a failure to make a new higher high, the formation of a lower high, and a break below the last higher low. It represents a fundamental shift in market sentiment from bullish to bearish.
A rising wedge is a bearish pattern formed by two converging upward-sloping trendlines. As price makes higher highs and higher lows within the narrowing range, momentum diminishes. The breakdown below the lower trendline typically leads to a sharp decline targeting the base of the wedge.
Three black crows is a powerful bearish reversal pattern consisting of three consecutive long bearish candles, each opening within the prior candle's body and closing near its low. It signals strong, persistent selling pressure and a likely trend reversal.
The Falling Channel Break occurs when price breaks above the upper boundary of a descending parallel channel, signaling the end of the downtrend and the beginning of a new bullish phase.
The Broadening Top (Megaphone) is a chart formation characterized by expanding price swings that create higher highs and lower lows, reflecting increasing volatility and instability at market tops before a bearish breakdown.
Pro Tips & Common Mistakes
Pro Tips
- The wider and longer the channel, the more significant the breakdown signal.
- A failure to reach the upper boundary before the breakdown is a leading indicator—look for lower highs within the channel.
- The retest of the broken trendline occurs about 55% of the time—be patient for this entry opportunity.
- Draw the channel using the most recent and clearest touches for the most accurate trendlines.
- Combine channel analysis with volume: declining volume on rallies to the upper boundary is a warning sign.
Common Mistakes
- Drawing channels with only one touch on each boundary—you need at least two touches per line
- Not waiting for a close below the trendline—intraday breaks often reverse
- Setting the measured move target from the wrong point—use the breakdown point, not the channel top
- Forcing a channel onto price action that does not fit—the channel must be obvious
- Ignoring the possibility of a false break, especially in volatile markets
Advanced Techniques
- Use a parallel channel tool to draw the channel, then project a second channel of equal width below the lower trendline as the target zone.
- Combine the channel break with Fibonacci retracement of the entire channel move for confluence targets.
- Monitor the angle of the channel—steep channels are more likely to break down than gentle ones.
- Use internal channel lines (parallel lines within the channel) to identify early warnings of the breakdown.
Institutional Perspective
Institutional traders often sell into the upper channel boundary during the final oscillations. The channel break triggers algorithmic selling programs that target the measured move, creating a self-fulfilling prophecy.
Fun Facts
- Rising channels are sometimes called 'bull channels' because they represent controlled uptrends—until they break.
- Some of the longest rising channels in history have lasted years on weekly charts, making their eventual breakdowns major market events.
- Algorithmic trading systems commonly use channel detection and breakout algorithms, making channel breaks somewhat self-reinforcing.
Frequently Asked Questions
A rising channel break occurs when price, which has been trading within two parallel upward-sloping trendlines, closes below the lower trendline. This signals the end of the uptrend and often leads to a measured move decline equal to the channel's width.
Measure the width of the channel (distance between the upper and lower trendlines) and project that distance downward from the point where price breaks below the lower trendline.