Overview
Bearish Reversal
Also known as: Trend Reversal Down, Bearish Trend Change, Top Reversal
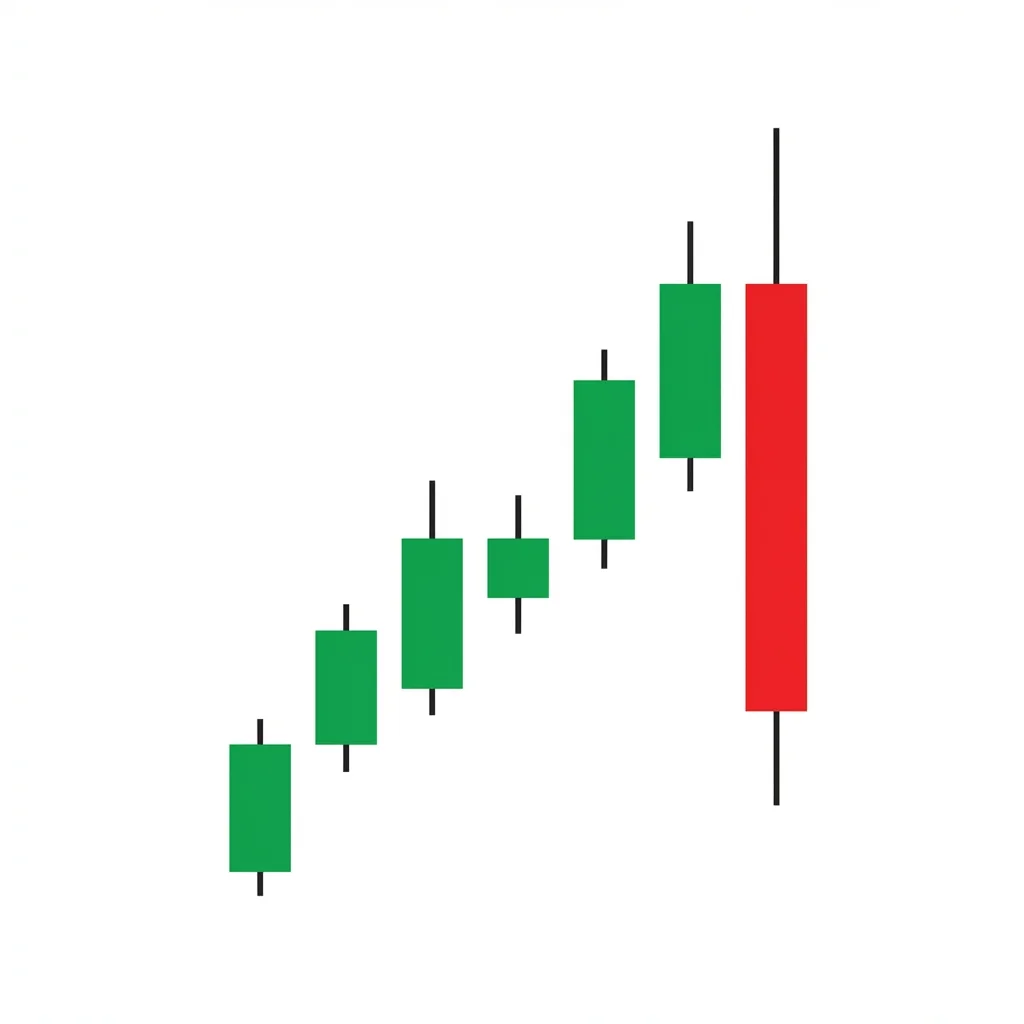
A bearish reversal is the comprehensive transition from an uptrend to a downtrend, marked by a failure to make a new higher high, the formation of a lower high, and a break below the last higher low. It represents a fundamental shift in market sentiment from bullish to bearish.
The bearish reversal is not a single candlestick pattern but rather a market structure concept that encompasses the entire process of transitioning from a bullish to a bearish trend. It begins with an established uptrend showing higher highs and higher lows. As the trend matures, momentum begins to wane—candle bodies shrink, volume declines, and indicators show divergence. The first concrete signal is a failure to make a new higher high. This is followed by the formation of a lower high, and ultimately a break below the most recent higher low, which is the definitive market structure break (BOS) that confirms the reversal. Understanding this process helps traders avoid being caught in trend tops and positions them for the new downtrend. The bearish reversal encompasses many specific patterns (head and shoulders, double tops, etc.) as variations of the same structural concept.
History & Etymology
The concept of trend reversal is as old as technical analysis itself. Charles Dow described trend structure (higher highs/lows for uptrends, lower highs/lows for downtrends) in the late 1800s. The formal identification of the transition between these structures became a foundational principle of Dow Theory and all subsequent technical analysis.
'Bearish' refers to the new downward direction. 'Reversal' means a change in the prevailing trend direction. Together they describe the process of an uptrend ending and a downtrend beginning.
How It Forms
Formation Steps
- 1Established uptrend with higher highs and higher lows
- 2Price makes a new high but with diminishing momentum
- 3A lower high forms, breaking the sequence of higher highs
- 4Price breaks below the most recent higher low, confirming the reversal
- 5A new downtrend of lower highs and lower lows begins
Prerequisites
- Clear uptrend with at least three higher highs and higher lows
- Signs of weakening momentum (shorter candles, declining volume)
Confirmation Signals
- Break below the last higher low (market structure break)
- Lower high forms after the initial break
- Volume increases on the breakdown
- Moving averages begin to turn down
Invalidation Signals
- Price makes a new higher high above the suspected top
- The breakdown below the higher low is quickly reversed
- Volume surges to the upside
Candle Breakdown
Climax Candle
The final push higher that often marks the absolute top. May show a long upper wick or exhaustion characteristics.
The last surge of buying, often driven by euphoria or fear of missing out. This is frequently the emotional peak.
Lower High Candle
A rally attempt that fails to reach the prior high, creating the first lower high in the sequence.
Buying interest is clearly waning. The failure to make a new high is the first warning that the trend may be changing.
Structure Break Candle
The candle that closes below the most recent higher low, confirming the bearish market structure break.
This is the moment of confirmation. Bulls who defended the higher low capitulate, and the transition to a downtrend is validated.
Psychology
The bearish reversal represents a gradual shift in market sentiment from bullish euphoria to bearish fear. It is a process, not an event, and understanding the psychology at each stage helps traders time their entries.
Buyer Perspective
Buyers gradually lose conviction as the uptrend matures. The failure to make a new high triggers doubt, and the break below the higher low triggers panic selling.
Seller Perspective
Sellers initially take small positions against the uptrend, gaining confidence as the trend shows weakness. The confirmed market structure break gives them conviction to add aggressively.
Smart Money Action
Smart money begins distributing well before the reversal is obvious, selling into the rallies of the maturing uptrend. They complete their distribution during the topping process and begin building short positions.
Retail Trader Trap
Retail traders buy the dip at the 'support' of the higher low, expecting the uptrend to continue. The market structure break traps them in losing positions.
Emotional Cycle
Trading Strategy
Aggressive Entry
Enter short when the lower high forms, before the market structure break is confirmed.
Conservative Entry
Wait for the market structure break (close below the last higher low), then enter short on the pullback to the broken level.
Equal to the distance from the top to the broken higher low, projected downward
Next major support level from the prior uptrend
Full measured move based on the height of the uptrend
Best Conditions
- Timeframe: 1D
- Timeframe: 4h
- Timeframe: 1W
- After extended uptrends
- Overbought markets
- Rising interest rate environments
- Asset: Stocks
- Asset: Indices
- Asset: Crypto
- Asset: Forex
Avoid When
- Timeframe: 1m
- Timeframe: 5m
- Strong bullish momentum
- Early-stage uptrends
Confluence Factors
- RSI or MACD bearish divergence at the top
- Volume declining during the uptrend's final stages
- Moving average crossover (death cross)
- Fibonacci extension levels at the top
- Fundamental deterioration accompanying the technical signals
Scale In Strategy
Enter initial position at the lower high, add on the market structure break, and add a final tranche on the pullback retest.
Scale Out Strategy
Take profits at each new support level as the downtrend develops.
Risk Management
Volume Analysis
Volume Confirmation
Volume should decline during the rallies (lower highs) and increase during the declines, confirming the bearish shift.
Volume Profile
Heavy volume on the breakdown below the higher low and lighter volume on subsequent bounces confirms the reversal.
Volume Divergence
Declining volume during the final higher high attempt is one of the earliest warning signs of a pending reversal.
Technical Confluence
Support Resistance
The broken higher low becomes resistance on retests. The top of the uptrend becomes the long-term resistance.
Fibonacci Levels
Retrace levels of the uptrend become initial downside targets: 38.2%, 50%, 61.8% are common reversal targets.
Moving Averages
The death cross (50 SMA crossing below 200 SMA) often occurs during or shortly after the reversal, confirming the trend change.
Rsi Confirmation
RSI dropping below 50 after showing bearish divergence at the top confirms the momentum shift.
Macd Confirmation
MACD crossing below the signal line and the zero line confirms the reversal's momentum.
Bollinger Bands
Price transitioning from the upper band to below the middle band and toward the lower band confirms the reversal.
Vwap
Price closing below VWAP consistently after previously staying above it confirms the sentiment shift.
Ichimoku Cloud
Price falling below the Kumo cloud after being above it is a powerful Ichimoku reversal signal.
Elliott Wave
The bearish reversal typically marks the transition from a completed 5-wave impulse to a corrective ABC pattern.
Wyckoff Phase
The reversal process corresponds to the transition from Wyckoff distribution to markdown.
Market Profile
The market transitioning from a buying auction (higher value areas) to a selling auction (lower value areas) confirms the reversal.
Order Flow
Cumulative delta turning negative after being positive for the entire uptrend is the definitive order flow reversal signal.
Open Interest
Monitor open interest changes for additional confirmation of institutional participation in the move.
Multi-Timeframe Analysis
Higher Timeframe Alignment
A daily reversal is strongest when the weekly chart also shows divergence and weakening momentum.
Lower Timeframe Entry
Use the 4H or 1H chart to identify the market structure break within the daily reversal for a more precise entry.
Timeframe Confluence
When the 4H, daily, and weekly charts all show reversal characteristics, the probability of a sustained downtrend is very high.
Top-Down Approach
Weekly divergence > Daily lower high > 4H market structure break > 1H entry signal.
Statistics
Historical Examples
Bitcoin 2021 Top Reversal
successBitcoin formed a classic bearish reversal from its $69,000 all-time high. The lower high at $52,000 and the break below $40,000 confirmed the reversal, leading to a decline to $15,500.
Lesson: Major trend reversals in crypto can lead to 70%+ declines. The reversal process took weeks to confirm but the payoff was enormous.
S&P 500 2022 Reversal
successThe S&P 500 made its all-time high at 4,818 and then formed a lower high. The break below the January swing low confirmed the reversal, leading to a 25% decline into October 2022.
Lesson: Even the most powerful bull markets eventually reverse. Respecting the market structure break, even when fundamentals seem fine, is critical.
Variations
V-Top Reversal
A sharp, sudden reversal with no consolidation at the top—price spikes and immediately reverses.
Rolling Top Reversal
A gradual, rounded reversal that takes many weeks or months to complete.
Confusion Matrix
Patterns commonly confused with Bearish Reversal and how to distinguish them.
Bearish Head Shoulders
8000% similarIf there are three distinct peaks with the middle one higher (head) and two lower ones (shoulders) with a neckline, it is an H&S. A generic reversal simply requires the market structure to change.
Key Differences
- H&S is a specific three-peak formation; a reversal is the broader concept
- H&S has defined neckline; the reversal uses higher lows
- All H&S are reversals, but not all reversals are H&S
Bearish Double Top
7500% similarIf two peaks form at approximately the same price level with a trough between them, it is a double top. A reversal can take any form as long as the market structure shifts.
Key Differences
- Double top has two peaks at similar levels; a reversal may have one peak
- Double top has a specific measured move; a reversal target varies
- Double top is a subset of the broader reversal concept
The Distribution phase is a Wyckoff concept where institutional investors systematically sell (distribute) their holdings to the public within a trading range at a market top, before the subsequent markdown (decline) begins.
The Double Top is an M-shaped reversal pattern where price tests a resistance level twice and fails, creating two peaks at similar levels. The breakdown below the neckline (trough between peaks) confirms the reversal with a measured move target equal to the pattern height.
The Bearish Engulfing is one of the most powerful and commonly traded two-candle reversal patterns. A large bearish candle completely engulfs the prior bullish candle, demonstrating a decisive shift from buying to selling dominance.
The head and shoulders is the most well-known reversal pattern in technical analysis. It consists of three peaks — a higher middle peak (head) flanked by two lower peaks (shoulders) — and signals a major bearish reversal when the neckline breaks.
The triple top is a powerful bearish reversal pattern formed by three peaks at approximately the same price level, separated by two pullbacks. The pattern confirms when price breaks below the neckline, with a measured target equal to the pattern's height projected downward.
The Broadening Top (Megaphone) is a chart formation characterized by expanding price swings that create higher highs and lower lows, reflecting increasing volatility and instability at market tops before a bearish breakdown.
Pro Tips & Common Mistakes
Pro Tips
- The reversal is a process, not a single event. Be patient and wait for the full confirmation before committing capital.
- Bearish divergence on RSI or MACD is often the earliest warning sign, appearing well before the market structure breaks.
- The strength of the market structure break matters—a strong bearish candle with volume is more convincing than a gradual drift.
- False reversals (bear traps) are common. Always use a stop loss and be willing to re-enter if the reversal fails.
- The first pullback after the market structure break is typically the best entry opportunity with the clearest risk/reward.
Common Mistakes
- Calling a reversal too early—before the market structure actually breaks
- Ignoring the possibility of a false breakdown (bear trap)
- Fighting a strong uptrend based on a single bearish candle
- Not using a stop loss because of conviction in the reversal thesis
- Over-sizing the position because 'the top is in'
Advanced Techniques
- Use Dow Theory to confirm the reversal: the major trend changes only when both the industrials and transports (or equivalent) confirm.
- Apply Elliott Wave analysis to identify when a 5-wave impulse has completed, signaling that a reversal is structurally due.
- Use breadth indicators (advance/decline line, new highs/lows) to confirm that the reversal has broad market support.
- Combine technical reversal signals with fundamental deterioration (declining earnings, rising rates) for the highest conviction setups.
Institutional Perspective
Institutional portfolio managers begin reducing equity exposure when they identify trend reversal signals. The reversal process is gradual because large positions take time to unwind without moving the market. This institutional selling creates the lower highs and eventual breakdown.
Fun Facts
- The average bull market lasts about 5.5 years, meaning bearish reversals at the macro level occur roughly once every half-decade in equities.
- Dow Theory, formulated over 100 years ago, still provides one of the most reliable frameworks for identifying trend reversals.
- Some of the most profitable trades in history were short positions initiated at confirmed bearish reversals—Jesse Livermore made millions shorting the 1929 crash.
Frequently Asked Questions
A bearish reversal is confirmed when price breaks below the last higher low in an uptrend, establishing a new market structure of lower highs and lower lows. Volume should increase on the breakdown for additional confirmation.
A pullback maintains the uptrend structure (higher highs and higher lows). A reversal breaks this structure by forming a lower high and then breaking below the last higher low. The key difference is whether the market structure changes.
Early warnings include: declining volume on rallies, RSI/MACD bearish divergence, smaller candle bodies near the top, increasing volatility, and sentiment extremes (excessive bullishness).