Overview
Bullish Falling Channel Break
Also known as: Descending Channel Breakout, Channel Break Up, Falling Channel Reversal
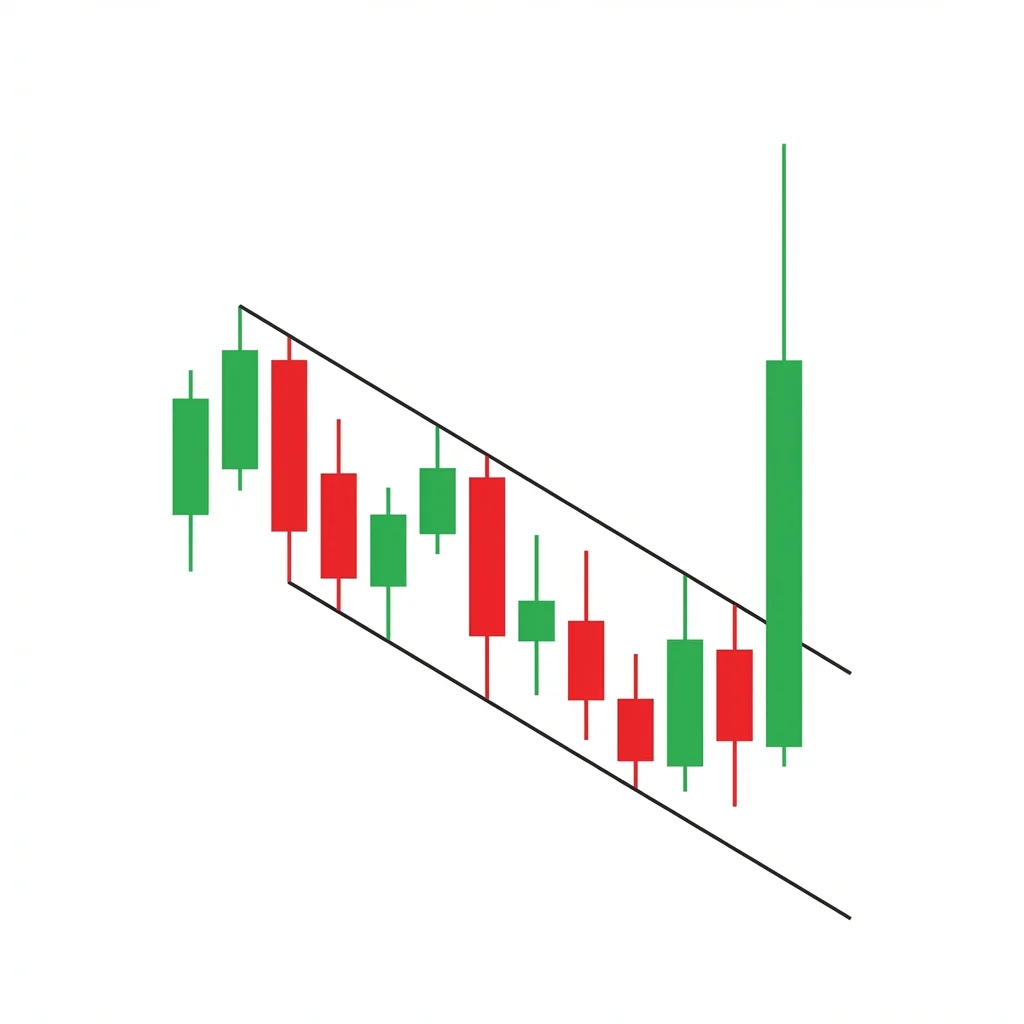
The Falling Channel Break occurs when price breaks above the upper boundary of a descending parallel channel, signaling the end of the downtrend and the beginning of a new bullish phase.
A falling (descending) channel confines price within two downward-sloping parallel trendlines. While price remains within the channel, the downtrend is intact. The bullish signal occurs when price breaks above the upper trendline, which previously acted as resistance. This breakout signals that buyers have overwhelmed the orderly selling pattern and the downtrend is over. The breakout is most significant when accompanied by increased volume, and the prior channel resistance often becomes support. The measured move target is typically the channel width projected above the breakout point.
History & Etymology
Channel break analysis is a core component of classical technical analysis, documented by Edwards and Magee. The concept of a downtrend ending when price escapes the confines of a falling channel is one of the most intuitive trend change signals.
Falling refers to the downward slope of the channel. Channel break indicates price breaking out of the channel boundaries. The pattern is bullish because the break is to the upside, ending the decline.
How It Forms
Formation Steps
- 1Falling channel: two downward-sloping parallel trendlines containing price action
- 2At least two touches on each trendline defining the channel
- 3Breakout: price breaks above the upper trendline of the falling channel on volume
Prerequisites
- Well-defined falling channel with at least 2 touches on each boundary
- Price has been trending lower within the channel for multiple swings
- Momentum starting to shift (higher lows within the channel or volume patterns changing)
Confirmation Signals
- Close above the upper trendline on above-average volume
- Successful retest of the upper trendline as support
- Follow-through buying after the breakout
Invalidation Signals
- Price falls back inside the channel after breaking above
- Low volume on the breakout
- Channel continues with new lower lows and lower highs
Candle Breakdown
Channel Resistance Test
Price approaches the upper trendline of the falling channel.
Buyers are pressing harder against the upper boundary. Each test weakens the sellers defending this line.
Breakout Candle
A strong bullish candle that closes above the upper channel trendline.
The breakout signals that the downtrend pattern is broken. Sellers who were comfortable within the channel now face a changed environment.
Psychology
The falling channel break represents the transition from an orderly downtrend to a new bullish phase. The breakout is the market declaring that the decline is over.
Buyer Perspective
Buyers who have been buying at the lower channel boundary now see their thesis validated as price breaks above the upper boundary. New buyers enter on the breakout signal.
Seller Perspective
Sellers who relied on the channel structure to maintain the downtrend lose their framework. The break above the upper boundary forces them to reconsider their positions.
Smart Money Action
Institutions accumulate within the falling channel (buying at the lower boundary) and then add aggressively on the breakout, which they may have been engineering by slowly absorbing supply.
Retail Trader Trap
Retail traders who have been shorting at the upper boundary are caught when the breakout occurs. Their covering adds fuel to the rally.
Emotional Cycle
Trading Strategy
Aggressive Entry
Enter long when price breaks above the upper trendline with a bullish candle.
Conservative Entry
Wait for a retest of the upper trendline (now support) and enter on the bounce.
Channel width projected above the breakout point.
Prior swing high from before the channel began.
1.618x the channel width above the breakout.
Best Conditions
- Timeframe: 4h
- Timeframe: daily
- Timeframe: weekly
- After extended downtrends showing exhaustion
- When broader market is stabilizing or turning up
- During sector rotation into previously weak groups
- Asset: stocks
- Asset: ETFs
- Asset: forex
- Asset: crypto
- Asset: futures
Avoid When
- Timeframe: 1m
- Timeframe: 5m
- In accelerating bear markets
- When the channel is steep and momentum is strong
Confluence Factors
- Breakout at a horizontal support level
- RSI divergence during the channel
- Volume declining on channel declines
- Moving average reclaiming on breakout
- MACD bullish crossover near the breakout
Scale In Strategy
Enter 50% on the breakout, 50% on the trendline retest.
Scale Out Strategy
Take 50% at the channel width target, trail the rest.
Risk Management
Volume Analysis
Volume Confirmation
Volume should increase on the breakout candle. Volume within the channel should be declining on down-swings.
Volume Profile
Decreasing volume on selloffs within the channel confirms waning selling pressure.
Volume Divergence
If volume does not increase on the breakout, it may be a false breakout back into the channel.
Technical Confluence
Support Resistance
The upper trendline transitions from resistance to support after the breakout. This role reversal is the key technical event.
Fibonacci Levels
The channel often represents a Fibonacci-proportion correction of the prior uptrend.
Moving Averages
Reclaiming the 50 SMA during or after the breakout adds strong confirmation.
Rsi Confirmation
RSI making higher lows while price makes lower lows within the channel is classic bullish divergence.
Macd Confirmation
MACD crossing above the signal line and histogram turning positive confirms the momentum shift.
Bollinger Bands
The breakout above the upper band after compression within the channel signals expanding bullish momentum.
Vwap
Breaking above the VWAP on the breakout day confirms institutional buying.
Ichimoku Cloud
Breaking above the Kumo cloud simultaneously with the channel break is a powerful double confirmation.
Elliott Wave
Falling channels often contain corrective waves (ABC). The breakout initiates the next impulse wave.
Wyckoff Phase
The falling channel can represent the last down phase before the markup begins.
Market Profile
The breakout creates a range extension above the channel, establishing new value higher.
Order Flow
Aggressive buying (initiative activity) above the upper trendline confirms the breakout.
Open Interest
Rising open interest on the breakout confirms new positions being established.
Multi-Timeframe Analysis
Higher Timeframe Alignment
A daily falling channel break within a weekly uptrend signals the end of the correction.
Lower Timeframe Entry
Use the 1-hour chart to time the breakout entry precisely.
Timeframe Confluence
A weekly falling channel break is a major trend change signal.
Top-Down Approach
Weekly uptrend, daily falling channel, 4-hour breakout entry.
Statistics
Historical Examples
Nvidia Falling Channel Break 2022-2023
successNvidia traded within a falling channel throughout late 2022. The breakout above the upper trendline in January 2023, coinciding with AI enthusiasm, launched one of the most dramatic rallies in recent market history.
Lesson: Falling channel breaks in high-quality companies, especially when accompanied by fundamental catalysts, can produce moves far exceeding the measured move target.
Variations
Steep Channel Break
A channel with a steep downward angle that breaks out.
Confusion Matrix
Patterns commonly confused with Bullish Falling Channel Break and how to distinguish them.
Bullish Falling Wedge
7000% similarMeasure the width at the start and end of the pattern. If the width stays constant (parallel lines), it is a channel. If the width narrows (converging lines), it is a wedge.
Key Differences
- Falling wedges have converging trendlines
- Falling channels have parallel trendlines
A bearish rising channel break occurs when price has been trading within an ascending channel and breaks below the lower trendline, signaling the end of the uptrend. The measured target equals the channel's width projected downward from the breakout point.
The Bullish ABC Bounce is a simple but powerful continuation pattern where price makes a three-wave corrective pullback within an uptrend before resuming higher. It is one of the most fundamental and frequently occurring patterns in all of technical analysis.
The Bullish Engulfing is one of the most popular and reliable two-candle reversal patterns. A large bullish candle completely engulfs the prior bearish candle body, signaling a decisive shift from selling to buying control.
The Falling Wedge is a bullish pattern with two converging downward-sloping trendlines. The narrowing range compresses energy that is released on an upside breakout, making it both a reversal pattern (after downtrends) and a continuation pattern (during uptrend corrections).
The Bullish Flag is the quintessential continuation pattern: a sharp rally (pole) followed by a brief, tight consolidation (flag) before the next leg up. It represents a healthy pause in a strong uptrend.
Three White Soldiers is one of the strongest bullish reversal patterns: three consecutive long bullish candles with progressively higher closes, each opening within the prior candle's body, signaling a powerful shift from bearish to bullish sentiment.
Pro Tips & Common Mistakes
Pro Tips
- The longer and more well-defined the channel, the more significant the breakout
- Look for RSI divergence within the channel as an early clue of the coming breakout
- The retest of the upper trendline as support (occurs 55% of the time) provides the best risk-reward entry
- Volume declining on the down-swings within the channel is a leading indicator of the breakout
Common Mistakes
- Anticipating the breakout before it occurs and buying at the upper trendline within the channel (getting rejected)
- Not confirming the breakout with a close above the trendline (intraday spikes often reverse)
- Ignoring volume on the breakout day
- Drawing the channel incorrectly with only one touch point per line
Advanced Techniques
- Use Linear Regression to statistically validate the channel boundaries
- Monitor the channel angle and compare it to the prior uptrend angle to estimate the breakout target
- Combine with Fibonacci time zones to estimate when the breakout is likely to occur
Institutional Perspective
Institutional traders view falling channels as controlled distribution or correction. The breakout signals a change in the supply-demand balance. Many algorithmic systems monitor channel boundaries for breakout signals.
Fun Facts
- Falling channel breaks are statistically one of the most reliable trendline breakout signals, particularly when confirmed by volume.
- Some of the biggest stock rallies in history began with a falling channel breakout, including many mega-cap tech stocks after the 2022 bear market.
Frequently Asked Questions
Three key factors confirm a real breakout: (1) the candle closes above the upper trendline, not just touches it; (2) volume is above average on the breakout day; (3) the upper trendline holds as support on a retest. False breakouts typically show low volume and quickly fall back inside the channel.