Overview
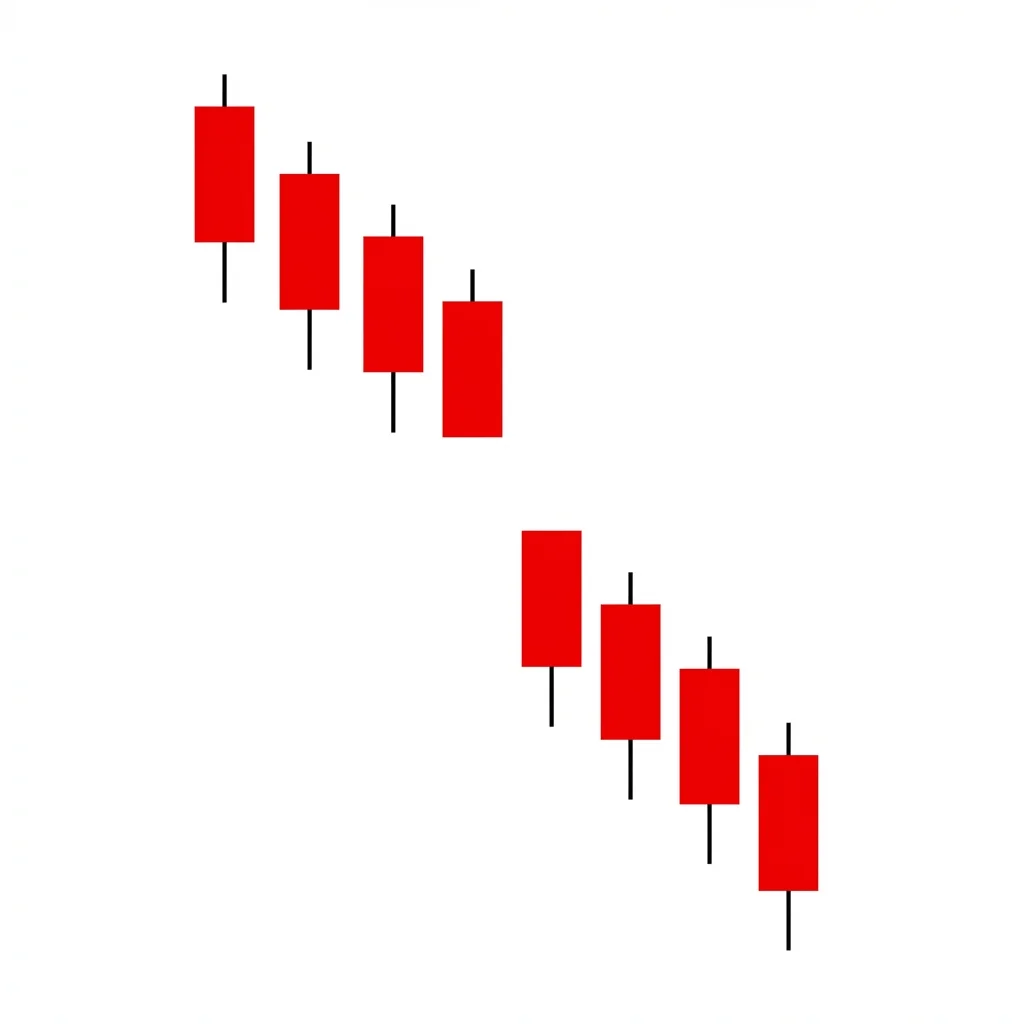
Bearish Runaway Gap
Also known as: Measuring Gap Down, Continuation Gap Down, Midway Gap
A bearish runaway gap (or measuring gap) is a gap down that occurs in the middle of a strong downtrend, signaling acceleration of selling pressure. It often marks the midpoint of the total move, making it useful for projecting the ultimate price target.
The bearish runaway gap is a continuation signal that occurs during an established downtrend. Unlike a breakaway gap (which starts a new trend) or an exhaustion gap (which ends one), the runaway gap occurs in the middle of the move, reflecting an acceleration of bearish sentiment. The gap forms because selling pressure is so strong that there are no buyers at prices between the prior close and the new open. The gap typically remains unfilled for an extended period, acting as resistance if price attempts to rally. One of the most useful characteristics of the runaway gap is its role as a measuring tool—since it often occurs near the midpoint of the total decline, traders can project the remaining downside by measuring the distance from the start of the move to the gap and projecting an equal distance below the gap.
History & Etymology
Gap analysis has been a core component of technical analysis since the early 20th century. The distinction between breakaway, runaway, and exhaustion gaps was popularized by Edwards and Magee and later refined by John Murphy and other technical analysts.
'Runaway' refers to the trend 'running away' from buying interest—the selling is so strong that price gaps away without any trading at intermediate levels. Also called a 'measuring gap' because of its usefulness in measuring the projected target.
How It Forms
Formation Steps
- 1Established downtrend already in progress
- 2A gap down occurs in the middle of the trend, accelerating the decline
- 3The gap remains unfilled as the downtrend continues
- 4The gap often occurs at the approximate midpoint of the total move
Prerequisites
- Active downtrend with momentum
- The gap should occur after the initial phase of the decline but before the final phase
Confirmation Signals
- The gap remains unfilled for at least 3-5 candles
- Continued bearish momentum after the gap
- Volume remains elevated after the gap
Invalidation Signals
- The gap is filled quickly (within 1-2 candles)
- Buying pressure reverses the trend after the gap
- Volume surges to the upside, filling the gap
Candle Breakdown
Pre-Gap Candle
A bearish candle within the existing downtrend. Its low marks the upper boundary of the gap.
The downtrend is established and sellers maintain control.
Gap Candle
A candle that opens below the prior candle's low, creating the gap. The gap area (between the prior low and this open) remains unfilled.
Selling pressure accelerates. No buyers exist at prices within the gap zone, reflecting extreme bearish sentiment.
Post-Gap Candle
A continuation candle confirming the gap will not be filled. It does not trade into the gap zone.
The market accepts the new lower price level. The gap acts as resistance overhead.
Psychology
The runaway gap represents an acceleration in bearish sentiment that creates a price vacuum. Sellers are so aggressive that no buyers exist at intermediate prices, forcing the market to gap lower.
Buyer Perspective
Buyers are overwhelmed and have retreated. The gap represents a price level where no one is willing to buy, reflecting complete bearish capitulation in the short term.
Seller Perspective
Sellers sense that the decline is accelerating and become more aggressive, creating the gap. The unfilled gap confirms their dominance.
Smart Money Action
Institutional sellers continue their selling campaign, and the gap represents a moment when their selling overwhelms all available buying interest.
Retail Trader Trap
Retail traders who buy the gap down expecting a bounce (gap fill) find themselves in an accelerating downtrend as the gap remains unfilled.
Emotional Cycle
Trading Strategy
Aggressive Entry
Enter short immediately on the gap open, expecting continuation.
Conservative Entry
Wait for the gap to hold for 1-2 candles (no fill), then enter short with a stop above the gap's upper boundary.
Measured move: distance from trend start to gap, projected below the gap
Next major support level below
150% of the measured move for extended declines
Best Conditions
- Timeframe: 1D
- Timeframe: 1W
- Strong downtrends
- Panic selling markets
- Bear markets
- Asset: Stocks
- Asset: Indices
- Asset: Crypto
Avoid When
- Timeframe: 1m
- Timeframe: 5m
- Timeframe: 15m
- Range-bound markets
- Low-volatility environments
Confluence Factors
- Gap occurs at the approximate midpoint of the decline
- Volume remains elevated after the gap
- No immediately visible support below the gap
- Bearish news or fundamental catalyst driving the gap
- Gap occurs on a wide-range bearish candle
Scale In Strategy
Enter on the gap and add if price continues to decline without filling the gap.
Scale Out Strategy
Take 50% at the measured move target, trail the rest.
Risk Management
Volume Analysis
Volume Confirmation
The gap candle should show elevated volume, confirming aggressive selling. Post-gap volume should remain above average.
Volume Profile
No volume within the gap zone (by definition). High volume on the gap candle and subsequent candles confirms continuation.
Volume Divergence
If volume declines sharply after the gap, it may be an exhaustion gap rather than a runaway gap.
Technical Confluence
Support Resistance
The gap zone acts as strong resistance on any rally attempt. The gap boundaries become key levels to watch.
Fibonacci Levels
The gap often occurs at the 50% point of the total decline, aligning with the measured move concept.
Moving Averages
The gap often creates separation between price and the 20 EMA, which may catch up to the gap zone and provide dynamic resistance.
Rsi Confirmation
RSI below 30 but not showing divergence suggests the runaway gap is genuine and the decline will continue.
Macd Confirmation
MACD histogram expanding negatively after the gap confirms accelerating bearish momentum.
Bollinger Bands
Price gapping below the lower Bollinger Band with the gap confirms extreme bearish conditions.
Vwap
Price below VWAP with a gap confirms institutional selling pressure.
Ichimoku Cloud
The gap through the Kumo cloud confirms a major bearish event.
Elliott Wave
Runaway gaps often occur in the middle of Wave 3, the most powerful Elliott Wave impulse.
Wyckoff Phase
Runaway gaps are common during the markdown phase of the Wyckoff cycle.
Market Profile
The gap creates a 'single print' area on the market profile—prices visited only once, indicating strong directional conviction.
Order Flow
The absence of buying at gap prices is visible as a void in the order book at those levels.
Open Interest
Monitor open interest changes for additional confirmation of institutional participation in the move.
Multi-Timeframe Analysis
Higher Timeframe Alignment
A daily runaway gap is strongest when the weekly chart confirms the downtrend.
Lower Timeframe Entry
On the day of the gap, use the 15M chart to identify whether the gap will hold or fill—a lower-timeframe downtrend after the gap confirms it.
Timeframe Confluence
A weekly gap down confirmed by daily continuation provides the highest conviction.
Top-Down Approach
Weekly downtrend > Daily runaway gap > 4H continuation confirmation.
Statistics
Historical Examples
Netflix Runaway Gap 2022
successNetflix gapped down 37% on earnings, creating a runaway gap within its ongoing downtrend. The gap remained unfilled for months, and the stock continued to decline.
Lesson: Earnings-driven runaway gaps in established downtrends are among the most powerful continuation signals.
S&P 500 Runaway Gap March 2020
successThe S&P 500 had multiple runaway gaps during the COVID crash, each one accelerating the decline. The measured move targets were hit within days.
Lesson: In crisis situations, multiple runaway gaps can occur in sequence, each one accelerating the decline further.
Variations
Multiple Runaway Gaps
Two or more runaway gaps occurring within the same trend, each one accelerating the move.
Weekend Runaway Gap
A runaway gap that occurs over a weekend due to negative news or events.
Confusion Matrix
Patterns commonly confused with Bearish Runaway Gap and how to distinguish them.
Bearish Exhaustion Gap
7000% similarIf the gap remains unfilled for several candles and the trend continues, it is a runaway gap. If the gap is filled within 1-3 candles and the trend reverses, it is an exhaustion gap.
Key Differences
- Runaway gaps occur in the middle of a trend; exhaustion gaps at the end
- Runaway gaps remain unfilled; exhaustion gaps are quickly filled
- Runaway gaps have continued momentum; exhaustion gaps show declining momentum
Bearish Breakaway Gap
6000% similarCheck the context: if the gap breaks out of a trading range or consolidation, it is a breakaway gap. If it occurs in the middle of an existing trend, it is a runaway gap.
Key Differences
- Breakaway gaps start a new trend; runaway gaps occur mid-trend
- Breakaway gaps break through a consolidation; runaway gaps occur in open trend
- Breakaway gaps are the first gap in a sequence; runaway gaps are the second
A falling window is a Japanese candlestick term for a gap down in price where the high of the current candle is below the low of the previous candle, signaling strong bearish continuation momentum.
The bearish gap momentum pattern occurs when price gaps down on high volume and continues selling throughout the session without filling the gap, indicating powerful one-directional selling pressure.
Three black crows is a powerful bearish reversal pattern consisting of three consecutive long bearish candles, each opening within the prior candle's body and closing near its low. It signals strong, persistent selling pressure and a likely trend reversal.
The Bullish Runaway Gap (Measuring Gap) occurs in the middle of a strong uptrend, signaling that the trend has strong momentum and is likely to continue. It can also be used to project the trend's target — the distance from the trend start to the gap is projected above the gap.
The bearish gap fill rejection occurs when price rallies to fill a prior gap down but is rejected at or within the gap zone, confirming the gap as resistance and signaling continuation of the downtrend.
The gap up fade occurs when price gaps higher at the open but fails to maintain the gains, reversing downward to fill the gap and often closing below the prior day's close. It signals that the gap lacked conviction.
Pro Tips & Common Mistakes
Pro Tips
- The measuring function is the most valuable aspect: the gap marks the approximate midpoint, so double the distance from the start of the trend to the gap for the target.
- If the gap is filled within 3 candles, reclassify it as a potential exhaustion gap and consider the opposite trade.
- In stocks, overnight gaps are more common and more reliable than in 24/7 markets like forex or crypto.
- Multiple runaway gaps in the same trend suggest extreme momentum—each one can be used as a measuring tool.
- The gap zone becomes a key resistance level for any future rally attempts.
Common Mistakes
- Buying the gap down expecting a fill—runaway gaps resist filling
- Confusing runaway gaps with exhaustion gaps—context within the trend is key
- Not using the measuring function to set proper targets
- Trading runaway gaps in instruments that trade 24/7 (where true gaps are rare)
- Ignoring volume—runaway gaps should have elevated, not declining, volume
Advanced Techniques
- Count the gaps in a trend: typically, the first gap is a breakaway, the second is a runaway, and the third is an exhaustion gap.
- Use gap analysis in conjunction with Elliott Wave: runaway gaps most commonly occur in the third wave, the strongest impulse.
- On daily charts, compare the gap size to the average true range (ATR): gaps larger than 2x ATR are more likely to be significant runaway gaps.
- Use the island reversal concept: if a runaway gap is followed by an exhaustion gap in the opposite direction, an island reversal forms.
Institutional Perspective
Institutional selling creates runaway gaps when sell orders overwhelm available bids at every price level. The gap represents a moment of extreme order imbalance that the market cannot absorb at current prices.
Fun Facts
- Runaway gaps are also called 'measuring gaps' because they statistically occur near the 50% point of the total move, making them valuable forecasting tools.
- During the 2008 financial crisis, the S&P 500 had over a dozen runaway gaps in just three months, each one accelerating the decline.
- In Japanese candlestick terminology, the equivalent concept is called a 'falling window.'
Frequently Asked Questions
A runaway gap is a gap down that occurs in the middle of an established downtrend, signaling an acceleration of selling pressure. It often marks the midpoint of the total decline and can be used as a measuring tool to project the final target.
A runaway gap occurs mid-trend and remains unfilled, with continued momentum after the gap. An exhaustion gap occurs near the end of a trend and is quickly filled, often leading to a reversal.
No. Unlike common gaps that tend to fill quickly, runaway gaps often remain unfilled for an extended period. Buying a runaway gap expecting a fill is a common and costly mistake.