Overview
Bearish Rounding Top
Also known as: Inverted Saucer, Dome Top, Arc Top, Rounded Top
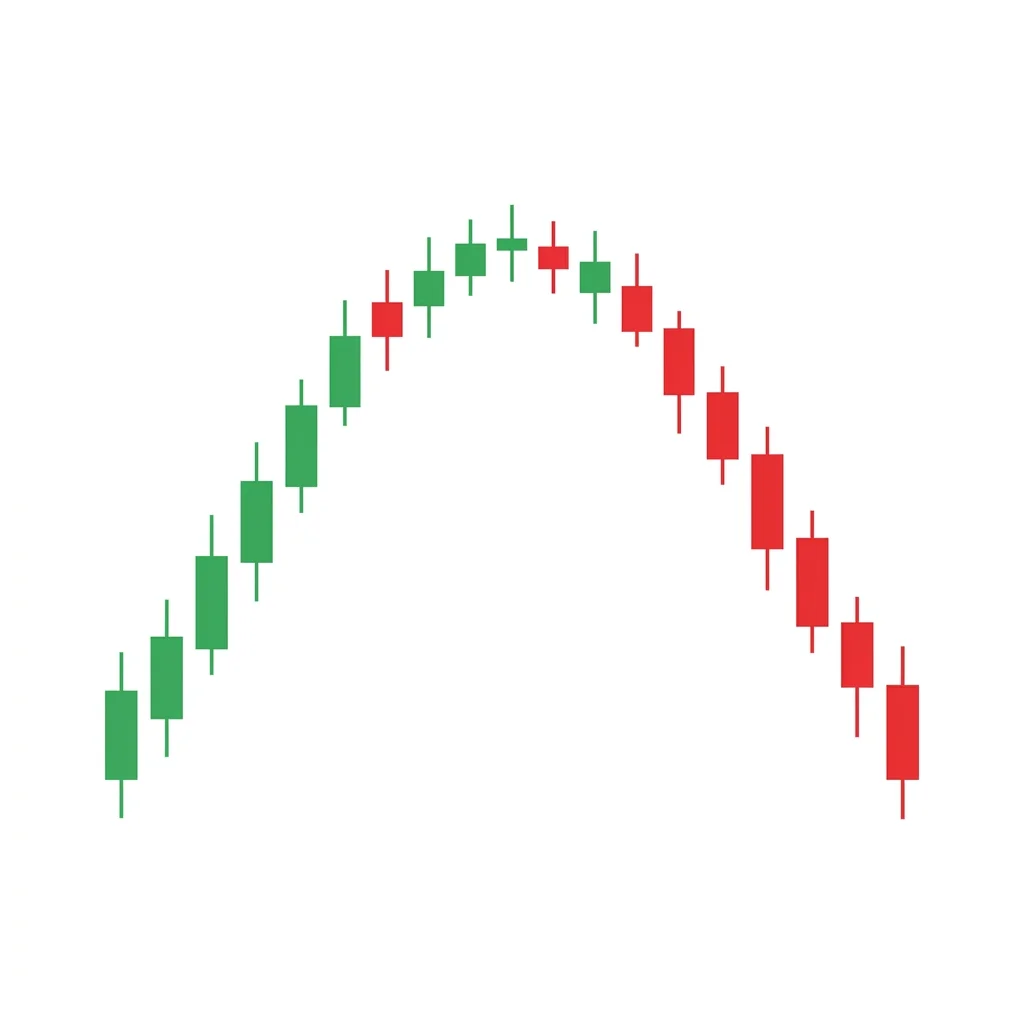
The rounding top is a gradual reversal pattern shaped like an inverted saucer. Price slowly transitions from an uptrend to a downtrend in a smooth arc, with volume declining at the peak and expanding on the neckline breakdown.
The rounding top (also called an inverted saucer or dome top) is a long-term reversal pattern that represents a gradual, natural shift in market sentiment from bullish to bearish. Unlike sharp reversal patterns like the head and shoulders, the rounding top evolves slowly over weeks or months. The left side of the arc shows decelerating buying pressure, the top shows equilibrium and indecision, and the right side shows gradually increasing selling pressure. Volume typically follows a U-shaped pattern—high during the initial rise, declining at the top, and increasing again during the descent. The pattern is confirmed when price breaks below the neckline (a horizontal line drawn at the lowest points of the arc). The measured move target is the height of the arc projected below the neckline.
History & Etymology
The rounding top has been recognized since the earliest days of chart analysis. It was described by Richard Schabacker in the 1930s and later by Edwards and Magee. The pattern is considered one of the most natural and organic reversal formations because it represents a smooth sentiment transition rather than a sudden shock.
'Rounding' refers to the smooth, curved shape of the price action. 'Top' indicates it forms at the peak of an uptrend. The alternative name 'inverted saucer' comes from its resemblance to an upside-down dish or saucer.
How It Forms
Formation Steps
- 1Price gradually rises, forming the left side of the arc
- 2The pace of advance slows, forming the rounded top
- 3Price begins to decline gradually, forming the right side of the arc
- 4The pattern creates a smooth dome or inverted saucer shape
- 5Price breaks below the neckline (support at the base of the arc)
Prerequisites
- Established uptrend leading into the pattern
- Gradual shift from bullish to bearish sentiment
- Volume typically mirrors the pattern—highest at the edges, lowest at the top
Confirmation Signals
- Price breaks below the neckline support with increased volume
- Failed retest of the neckline from below
- Moving averages rolling over and crossing bearish
Invalidation Signals
- Price breaks above the rounded top to new highs
- Strong bullish volume reversal during the right side of the arc
- Neckline holds as support on a retest
Candle Breakdown
Left Arc Candles
Bullish candles with decreasing momentum as the rate of advance slows, forming the left side of the dome.
Buyers are still present but losing enthusiasm. The pace of the advance slows as the market approaches its natural equilibrium.
Top Candles
Small-bodied candles with mixed colors, representing the flat apex of the dome where neither buyers nor sellers dominate.
Complete indecision. The market has lost its upward momentum but hasn't yet turned bearish. Volume is at its lowest.
Right Arc Candles
Increasingly bearish candles forming the right side of the dome as selling pressure builds gradually.
Sellers gradually take control. Volume increases as the decline accelerates, confirming the shift in sentiment.
Psychology
The rounding top represents the most organic form of trend reversal. It reflects a natural lifecycle of buying enthusiasm—rise, peak, and decline—without the dramatic catalysts that create sharper reversal patterns.
Buyer Perspective
Buyers gradually lose interest as the uptrend matures. There is no single moment of panic; instead, a slow erosion of confidence leads to gradually decreasing participation.
Seller Perspective
Sellers slowly emerge as the momentum fades. Their activity increases progressively, with the right side of the arc showing steadily increasing selling pressure.
Smart Money Action
Institutional investors gradually reduce positions over the entire arc, distributing shares without creating sudden price drops. The rounding shape is itself evidence of this controlled distribution.
Retail Trader Trap
Retail traders see the gradual decline as a buying opportunity, accumulating shares on the right side of the arc. The neckline break traps them.
Emotional Cycle
Trading Strategy
Aggressive Entry
Enter short when the right side of the arc breaks below the midpoint of the left arc, before the neckline breaks.
Conservative Entry
Wait for a close below the neckline with volume, then enter on a pullback to the broken neckline.
Height of the arc projected below the neckline
Next significant support level
150% of the arc height for extended moves
Best Conditions
- Timeframe: 1D
- Timeframe: 1W
- Post-bubble environments
- Sector rotation phases
- Rising interest rates
- Asset: Stocks
- Asset: Indices
- Asset: Commodities
Avoid When
- Timeframe: 1m
- Timeframe: 5m
- Timeframe: 15m
- Strong momentum markets
- Low-volatility environments
Confluence Factors
- Volume U-shape pattern confirms the rounding top
- Moving averages rolling over and crossing bearish
- RSI declining from overbought during the arc
- Fundamental deterioration accompanying the technical pattern
- Sector-wide weakness confirming the individual stock's rounding top
Scale In Strategy
Build the short position gradually over the right side of the arc, adding on each lower high.
Scale Out Strategy
Take partial profits at the measured move and trail the rest with the 50 SMA.
Risk Management
Volume Analysis
Volume Confirmation
Volume should form a U-shape: high on the left, low at the top, and increasing on the right. Spike on the neckline break.
Volume Profile
The lowest volume should occur near the top of the arc; the highest should occur on the neckline breakdown.
Volume Divergence
If volume increases on the right side without price declining, the pattern may fail.
Technical Confluence
Support Resistance
The neckline is the critical support level. Once broken, it becomes strong resistance on retests.
Fibonacci Levels
The arc's peak often aligns with Fibonacci extension levels of the prior trend. Retracement targets after breakdown follow standard Fibonacci levels.
Moving Averages
The 50 and 200 SMAs often cross bearish (death cross) during the right side of the arc or shortly after the neckline break.
Rsi Confirmation
RSI declining from overbought to below 50 during the arc confirms the momentum shift. RSI dropping below 30 after the breakdown confirms strong selling.
Macd Confirmation
MACD rolling over from a high level and crossing below the signal line during the arc is a classic confirming signal.
Bollinger Bands
Price transitioning from the upper band to below the middle band during the arc confirms the reversal.
Vwap
Multi-day VWAP analysis showing price crossing below VWAP during the right arc confirms distribution.
Ichimoku Cloud
Price falling through the Kumo cloud during or after the arc completion provides strong Ichimoku confirmation.
Elliott Wave
Rounding tops can mark the end of large degree Wave 3 or Wave 5 completions.
Wyckoff Phase
The rounding top is the gentlest form of Wyckoff distribution—a slow, controlled sell-off by smart money.
Market Profile
The developing value area gradually shifts lower throughout the rounding top, reflecting the sentiment change.
Order Flow
Cumulative delta slowly turns negative during the arc, accelerating on the neckline break.
Open Interest
Monitor open interest changes for additional confirmation of institutional participation in the move.
Multi-Timeframe Analysis
Higher Timeframe Alignment
A daily rounding top is strongest when the monthly chart shows overbought conditions or long-term resistance.
Lower Timeframe Entry
Use the 4H chart to identify the neckline break within the daily rounding top for a more precise entry.
Timeframe Confluence
A weekly rounding top with a daily neckline break provides the highest conviction for a major reversal.
Top-Down Approach
Monthly overbought > Weekly rounding top forming > Daily neckline break > 4H entry timing.
Statistics
Historical Examples
Cisco Rounding Top 2000
successCisco formed a textbook rounding top over several months in 2000 as the dot-com bubble peaked. The neckline break led to an 86% decline over the next two years.
Lesson: Rounding tops at the end of market bubbles can signal multi-year bear markets.
Gold Rounding Top 2012-2013
successGold formed a multi-month rounding top between $1,550 and $1,800 before breaking down. The metal fell to $1,050 over the next three years.
Lesson: Commodity rounding tops on weekly charts can signal the end of multi-year bull markets.
Variations
Saucer Top with Handle
A rounding top followed by a small downward-sloping consolidation (handle) before the neckline break.
Asymmetric Rounding Top
A rounding top where the right side descends faster than the left side rose.
Confusion Matrix
Patterns commonly confused with Bearish Rounding Top and how to distinguish them.
Bearish Head Shoulders
6000% similarIf there are three distinct peaks (left shoulder, head, right shoulder), it is an H&S. If the price action forms a smooth, continuous arc without distinct peaks, it is a rounding top.
Key Differences
- H&S has three distinct peaks; rounding top is a smooth arc
- H&S has a defined neckline connecting the troughs; rounding top has a broader support zone
- H&S forms more quickly than a rounding top
Bearish Inverted Cup Handle
8000% similarIf there is a small consolidation or pullback after the right side of the dome before the final breakdown, it is an inverted cup and handle. If the dome breaks down directly, it is a rounding top.
Key Differences
- The inverted cup and handle includes a small consolidation (handle) after the dome
- The rounding top breaks down directly from the arc
- The handle provides a more precise entry point
The Distribution phase is a Wyckoff concept where institutional investors systematically sell (distribute) their holdings to the public within a trading range at a market top, before the subsequent markdown (decline) begins.
The Double Top is an M-shaped reversal pattern where price tests a resistance level twice and fails, creating two peaks at similar levels. The breakdown below the neckline (trough between peaks) confirms the reversal with a measured move target equal to the pattern height.
The head and shoulders is the most well-known reversal pattern in technical analysis. It consists of three peaks — a higher middle peak (head) flanked by two lower peaks (shoulders) — and signals a major bearish reversal when the neckline breaks.
The inverted cup and handle is a bearish reversal pattern featuring a rounded top (inverted cup) followed by a brief upward consolidation (handle) before a breakdown, mirroring the bullish cup and handle pattern in reverse.
The Bullish Rounding Bottom (Saucer Bottom) is a long-term reversal pattern that forms a U-shaped curve as selling pressure gradually gives way to buying pressure, signaling a major trend change from bearish to bullish.
The Broadening Top (Megaphone) is a chart formation characterized by expanding price swings that create higher highs and lower lows, reflecting increasing volatility and instability at market tops before a bearish breakdown.
Pro Tips & Common Mistakes
Pro Tips
- Rounding tops are most reliable on daily and weekly charts—they take time to form and are meaningless on low timeframes.
- The U-shaped volume pattern is the most important confirmation—without it, the arc may just be noise.
- Look for the death cross (50 SMA crossing below 200 SMA) to occur during the right side of the arc for additional confirmation.
- The longer the rounding top takes to form, the larger the subsequent decline tends to be.
- Rounding tops are most common in stocks that are transitioning from growth to value as earnings growth decelerates.
Common Mistakes
- Trying to identify rounding tops on intraday charts—the pattern requires daily or weekly timeframes
- Not waiting for the neckline break—the arc shape alone is not enough to confirm the reversal
- Confusing a normal pullback with a rounding top—the arc must be smooth and gradual
- Ignoring the volume pattern—a rounding top without the characteristic volume decline at the peak is unreliable
- Being too early—rounding tops take months to complete
Advanced Techniques
- Use relative strength analysis: a stock forming a rounding top while its sector continues higher is a particularly bearish signal.
- Apply the time symmetry concept: the right side of the arc should take approximately as long as the left side.
- Use fundamental analysis as a filter: rounding tops that coincide with declining earnings or margin compression are most reliable.
- Monitor institutional ownership changes: decreasing institutional holdings during the arc confirm the distribution thesis.
Institutional Perspective
Rounding tops are the classic institutional distribution pattern. Large fund managers gradually reduce positions over months, creating the smooth arc. The gradual nature ensures they can sell without cratering the stock. Once distribution is complete, the neckline break occurs.
Fun Facts
- The rounding top is sometimes called the 'dome of doom' by traders who have witnessed its devastating effect on previously strong uptrends.
- Many of the largest stock market crashes in history were preceded by rounding tops on weekly or monthly charts.
- The rounding top is the mirror image of the rounding bottom (cup pattern), which is one of William O'Neil's favorite bullish patterns.
Frequently Asked Questions
A rounding top is a gradual reversal pattern that forms a dome or inverted saucer shape. Price slowly transitions from rising to flat to declining, creating a smooth arc. The pattern is confirmed when price breaks below the neckline.
Rounding tops typically take weeks to months to form on daily charts. On weekly charts, they can take several months to over a year. The longer the formation, the more significant the reversal.
Volume forms a U-shape: it is high during the left side of the arc (the uptrend), declines to its lowest at the peak, and increases again on the right side (the decline). Volume spikes on the neckline breakdown.