Overview
Bullish Runaway Gap
Also known as: Measuring Gap, Continuation Gap, Mid-Move Gap
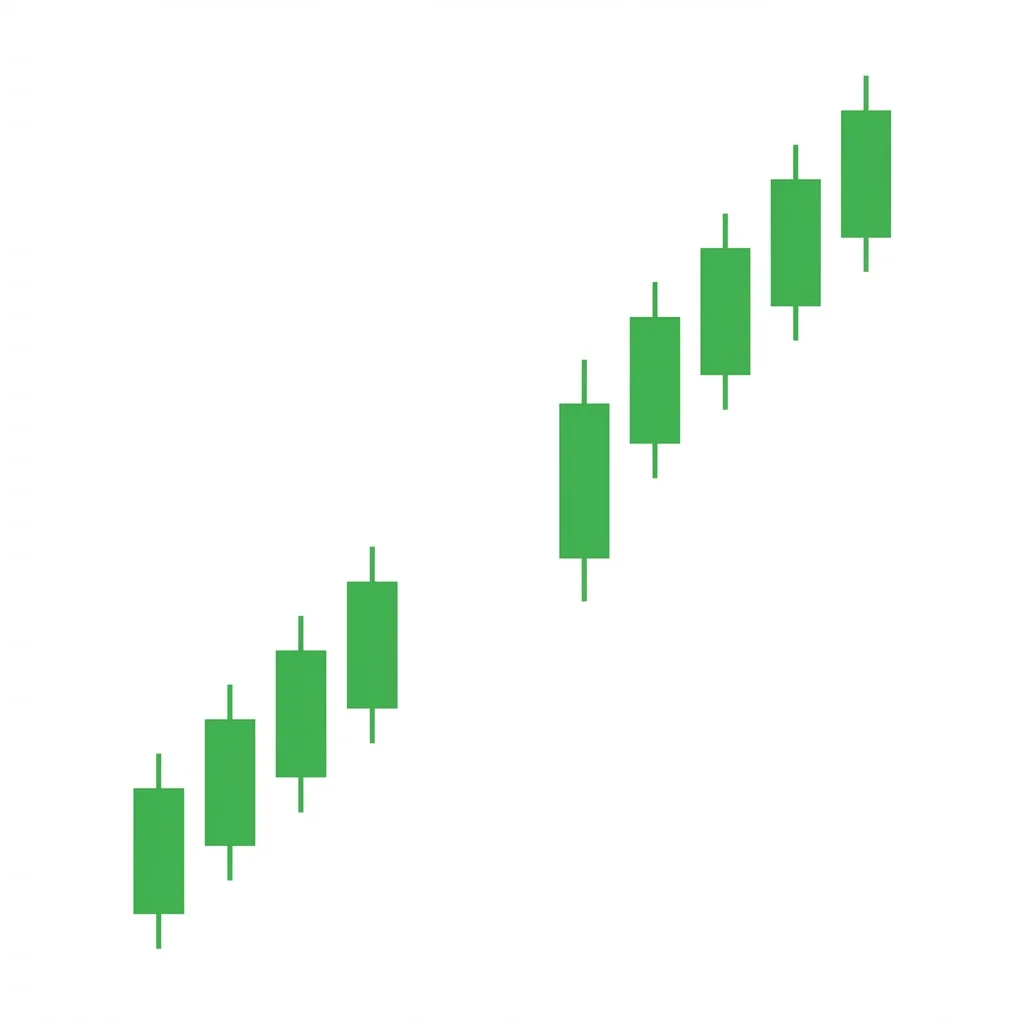
The Bullish Runaway Gap (Measuring Gap) occurs in the middle of a strong uptrend, signaling that the trend has strong momentum and is likely to continue. It can also be used to project the trend's target — the distance from the trend start to the gap is projected above the gap.
Runaway gaps form when trend momentum is accelerating and demand is overwhelming supply. Unlike breakaway gaps that start new trends or exhaustion gaps that end them, runaway gaps confirm that the trend is in full force. They typically occur without a specific news catalyst — they are the result of increasing confidence and FOMO buying. The pattern is also called a 'measuring gap' because it often marks the midpoint of the move, allowing traders to project the ultimate target by doubling the distance from the trend start to the gap.
History & Etymology
The classification of gaps into breakaway, runaway, and exhaustion types was formalized by technical analysts in the mid-20th century. Edwards and Magee described the measuring gap concept in their 1948 work, noting that these gaps frequently appeared near the midpoint of strong trending moves.
Called 'runaway' because the trend is running away from opposing forces. The alternate name 'measuring gap' comes from its use as a measuring tool to project the trend target, as it often marks the approximate halfway point of the move.
How It Forms
Formation Steps
- 1First candle: a bullish candle within an established strong uptrend
- 2Second candle: gaps up significantly, with the low above the first candle's high, and continues higher
Prerequisites
- Strong established uptrend with clear momentum
- Gap appears in the middle portion of the trend, not at the beginning or end
- No obvious news catalyst — the gap is driven by pure momentum
Confirmation Signals
- Gap remains unfilled for at least 3-5 bars
- Volume is elevated but not at extreme levels (not exhaustion)
- Price continues higher after the gap with sustained momentum
Invalidation Signals
- Gap is filled within 1-2 bars
- Volume is extremely high (may signal exhaustion)
- Momentum stalls immediately after the gap
Candle Breakdown
Pre-Gap Trend Candle
A bullish candle in the ongoing uptrend; its high forms the bottom boundary of the gap
The trend is well-established and participants are comfortable being long. Momentum is building as more traders join.
Runaway Gap Candle
Gaps up with the low above the prior candle's high, continuing the trend with enthusiasm
Buyers are so eager that they bid above the entire prior range. FOMO and short covering drive the gap. The market is running away from sellers.
Psychology
The Runaway Gap reflects accelerating trend momentum. Buyers are increasingly confident and willing to pay higher prices, while sellers have largely capitulated or are being squeezed out of positions.
Buyer Perspective
Buyers see the strong trend as confirmation of their thesis. Each new high increases their confidence, and the gap represents an escalation of their aggressiveness.
Seller Perspective
Short sellers are increasingly desperate, and the gap forces additional short covering. New short sellers are deterred by the relentless momentum.
Smart Money Action
Institutions that are positioned long allow the trend to run and use the runaway gap as a midpoint marker. Some may add to positions on the gap, while others begin planning exit strategies for the second half of the move.
Retail Trader Trap
Retail traders who missed the initial move often chase the runaway gap at its peak. Others attempt to short the 'overextended' trend and are squeezed by continued momentum.
Emotional Cycle
Trading Strategy
Aggressive Entry
Enter long at the gap-up open or the close of the gap day if price holds above the gap.
Conservative Entry
Wait for a brief consolidation after the gap and enter when price makes a new high above the gap day's high.
The measured move target: distance from trend start to gap, projected above the gap.
1.5x the measured move distance.
2x the measured move distance or until an exhaustion gap appears.
Best Conditions
- Timeframe: daily
- Timeframe: weekly
- Timeframe: 4h
- strong trending market
- momentum-driven rally
- bull market mid-move
- Asset: stocks
- Asset: crypto
- Asset: futures
Avoid When
- Timeframe: 1m
- Timeframe: 5m
- choppy market
- late-stage rally (exhaustion risk)
- overbought conditions
Confluence Factors
- Gap occurs roughly at the midpoint of a clean trending move
- Trend momentum indicators (ADX > 25) confirm strong trend
- No exhaustion signals (extremely high volume, parabolic curve)
- The trend has a clear starting point for measured move calculation
- Sector or market trend supports continued momentum
Scale In Strategy
Enter at the gap and add on the first pullback that holds above the gap zone.
Scale Out Strategy
Take half at the measured move target and trail the rest.
Risk Management
Volume Analysis
Volume Confirmation
Volume should be above average but not at extreme levels. Extreme volume may signal exhaustion rather than continuation.
Volume Profile
Moderate-high volume on the gap day, followed by stable or slightly declining volume as the trend continues.
Volume Divergence
If volume is declining into the gap, the momentum may be waning — proceed with caution.
Technical Confluence
Support Resistance
The runaway gap zone becomes a strong support level. If price returns to this level, it should bounce.
Fibonacci Levels
The gap often occurs near the 50% extension of the prior impulse wave, confirming its midpoint nature.
Moving Averages
The 10 and 20 EMAs should be rising and below the price, confirming strong trend momentum.
Rsi Confirmation
RSI above 60 but below 80 supports continuation. RSI above 80 may indicate the gap is an exhaustion signal.
Macd Confirmation
MACD histogram expanding and MACD above the signal line confirms strong momentum.
Bollinger Bands
Price running along the upper Bollinger Band after the gap confirms strong trend momentum.
Vwap
Price should remain above the developing VWAP and anchored VWAP from the gap day.
Ichimoku Cloud
Price well above the Kumo cloud with widening cloud confirms the trend's strength.
Elliott Wave
Runaway gaps typically occur in the middle of Wave 3, the strongest impulse wave.
Wyckoff Phase
The gap occurs during the markup phase, indicating strong institutional commitment to higher prices.
Market Profile
Single prints in the gap zone on the market profile confirm a genuine liquidity void.
Order Flow
Aggressive market buy orders dominating on the gap day confirm institutional urgency.
Open Interest
Rising open interest confirms new long positions, supporting trend continuation.
Multi-Timeframe Analysis
Higher Timeframe Alignment
A weekly runaway gap provides the strongest continuation signal; daily runaway gaps should align with the weekly trend.
Lower Timeframe Entry
Use the 1-hour chart to find an optimal entry within or just above the daily gap zone.
Timeframe Confluence
A weekly uptrend with a daily runaway gap and 4-hour bullish structure above the gap is ideal.
Top-Down Approach
Weekly trend confirms direction, daily identifies the runaway gap, and intraday optimizes entry within the gap zone.
Statistics
Historical Examples
TSLA Runaway Gap During 2020 Rally
successTSLA gapped up in the middle of its massive 2020 rally. The gap served as a measuring point, and the stock continued to rally roughly the same distance above the gap as it had traveled from the trend start to the gap.
Lesson: Runaway gaps in high-momentum stocks can accurately project targets using the measuring gap technique.
Gold Futures Mid-Move Gap
successGold gapped up during its rally from $1,700 to $2,070. The gap at approximately $1,870 served as the midpoint, and the gap acted as support on a later retest.
Lesson: Commodity runaway gaps work well in macro-driven trends where fundamental forces sustain momentum.
Mistaken Runaway (Actually Exhaustion)
failureAMC gapped up during a meme stock rally with extremely high volume. What appeared to be a runaway gap was actually an exhaustion gap, and the stock reversed sharply within days.
Lesson: Extremely high volume on the gap and a parabolic price structure are warning signs of an exhaustion gap, not a runaway gap.
Variations
Classic Measuring Gap
A single runaway gap that marks the exact midpoint of a trending move.
Multiple Runaway Gaps
Two or more runaway gaps in the same trend, each indicating continuing momentum.
Confusion Matrix
Patterns commonly confused with Bullish Runaway Gap and how to distinguish them.
Bullish Rising Window
8500% similarAll runaway gaps are rising windows, but not all rising windows are runaway gaps. The key is location: runaway gaps occur mid-trend.
Key Differences
- Rising Window is the general term for any bullish gap
- Runaway Gap specifically refers to a mid-trend gap with measuring properties
Exhaustion Gap
6000% similarCheck the gap's location in the trend and volume. Mid-trend with moderate volume = runaway. End of trend with extreme volume = exhaustion.
Key Differences
- Exhaustion gaps occur at the end of a trend and signal reversal
- Runaway gaps occur mid-trend and signal continuation
A bearish runaway gap (or measuring gap) is a gap down that occurs in the middle of a strong downtrend, signaling acceleration of selling pressure. It often marks the midpoint of the total move, making it useful for projecting the ultimate price target.
The Gap and Go occurs when price gaps up on a catalyst, and instead of filling the gap, continues higher as momentum buying drives the stock to new levels throughout the session.
The Bullish Rising Window is a gap-up pattern where the second candle's low is entirely above the first candle's high, creating a visible window (gap) that acts as future support and signals trend continuation.
A falling window is a Japanese candlestick term for a gap down in price where the high of the current candle is below the low of the previous candle, signaling strong bearish continuation momentum.
The bearish gap fill rejection occurs when price rallies to fill a prior gap down but is rejected at or within the gap zone, confirming the gap as resistance and signaling continuation of the downtrend.
The bearish gap momentum pattern occurs when price gaps down on high volume and continues selling throughout the session without filling the gap, indicating powerful one-directional selling pressure.
Pro Tips & Common Mistakes
Pro Tips
- Use the measuring gap technique: measure the distance from the trend's start to the gap, then project that distance above the gap for a target
- Runaway gaps occur on moderate-high volume; extremely high volume may signal exhaustion instead
- The gap zone should act as strong support — if price returns there and holds, it is a high-probability buy
- Multiple runaway gaps in sequence indicate accelerating momentum but also increasing exhaustion risk
- Distinguish from exhaustion gaps by checking RSI and the trend's age — mid-trend gaps with RSI 55-75 are most likely runaway
Common Mistakes
- Confusing a runaway gap with an exhaustion gap — always check the gap's position within the trend
- Shorting the gap expecting a fill — runaway gaps often remain unfilled for extended periods
- Chasing the gap at extreme prices without a defined entry plan
- Not using the measuring gap technique to set realistic targets
- Ignoring volume context — the gap should have moderate-high volume, not extreme volume
Advanced Techniques
- Count the number of gaps in a trending move: the first is typically breakaway, the second runaway, and the third exhaustion
- Use the gap as an anchor for VWAP calculations to track institutional cost basis
- Combine with Elliott Wave analysis — runaway gaps frequently occur in Wave 3
- In futures, use the gap zone as a reference for identifying single-print areas on the market profile
Institutional Perspective
Institutions view runaway gaps as confirmation that their trend position is correct. The gap represents accelerating momentum as more participants join the trend. However, experienced institutional traders also monitor gap frequency — multiple gaps in quick succession signal the trend may be approaching exhaustion.
Fun Facts
- The measuring gap technique is one of the few methods in technical analysis that allows traders to estimate the endpoint of a trending move with reasonable accuracy.
- In very strong trends, multiple runaway gaps can occur — Japanese traders call three consecutive gaps 'Sanku' and consider the third gap a warning sign of exhaustion.
- Runaway gaps are rare in forex due to near 24-hour trading, but they do occur on Monday opens and around major central bank decisions.
Frequently Asked Questions
A Bullish Runaway Gap is a gap that occurs in the middle of a strong uptrend, confirming that momentum is accelerating and the trend is likely to continue. It is also called a measuring gap because it can be used to project the trend's target.
Measure the distance from the trend's starting point to the runaway gap. Project that same distance above the gap to estimate the trend's ultimate target. The gap roughly marks the midpoint of the move.
Check the gap's position within the trend (midpoint vs end), volume levels (moderate-high vs extreme), and RSI (55-75 vs overbought above 80). Mid-trend gaps with moderate volume are typically runaway; end-of-trend gaps with extreme volume are exhaustion.