Overview
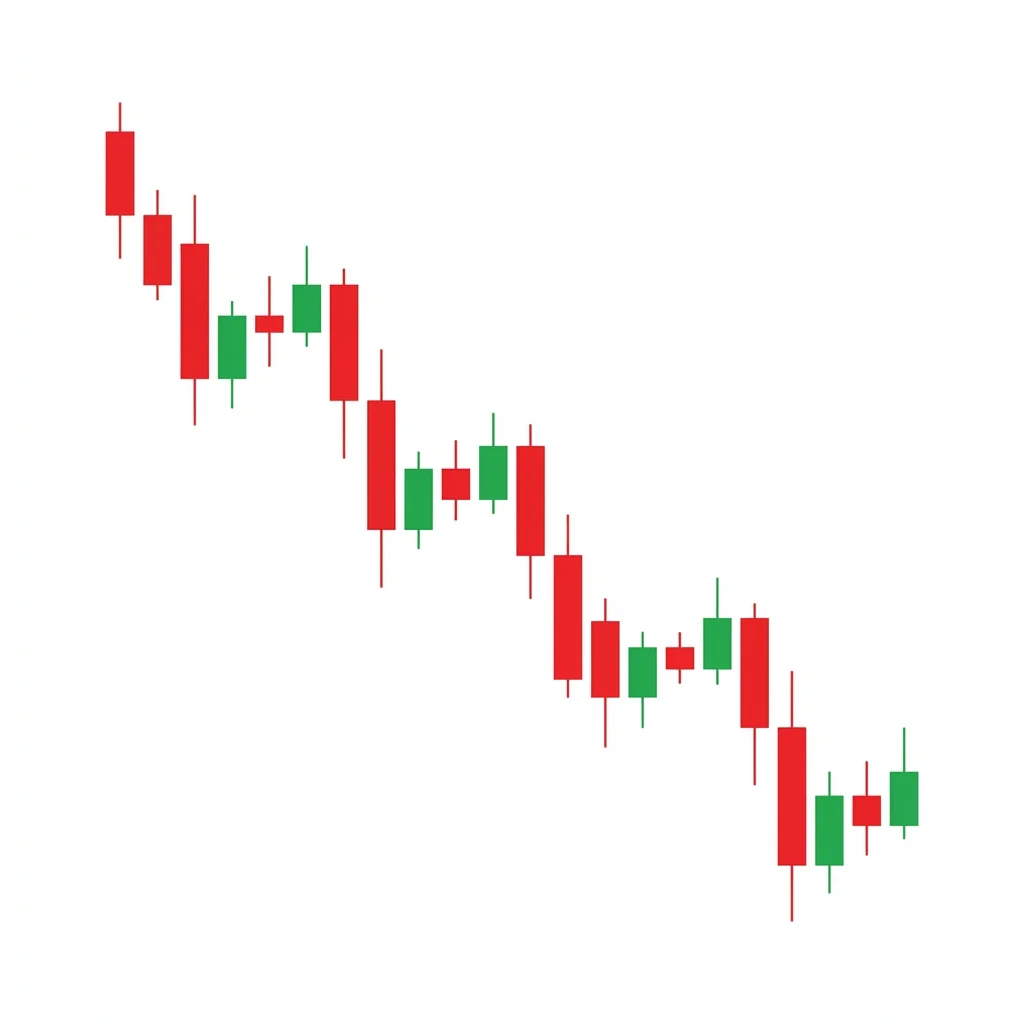
Bearish Staircase Down
Also known as: Descending Staircase, Step Pattern Down, Lower Highs Lower Lows
The bearish staircase down is a trend continuation pattern characterized by a rhythmic series of lower highs and lower lows, creating a step-like descending structure. Each step represents a decline followed by a partial recovery that fails to reclaim the prior high.
The bearish staircase down is a visual representation of an orderly, methodical downtrend. Unlike chaotic sell-offs, the staircase pattern shows price declining in controlled steps—each step consisting of a down move followed by a partial recovery (lower high) before the next leg down. This pattern is significant because it shows that selling pressure is persistent and organized. The partial recoveries attract buyers who believe the bottom is in, but each rally fails at a lower level, creating the characteristic staircase shape. The pattern continues until a catalyst disrupts the rhythm—either a climactic sell-off that ends the trend or a successful higher high that breaks the descending structure.
History & Etymology
The staircase pattern is a practical manifestation of Dow Theory's trend definition: an uptrend has higher highs and higher lows, while a downtrend has lower highs and lower lows. While not a formal named pattern in the classical literature, traders have used the staircase metaphor to describe orderly trends since the concept of trend structure was formalized.
'Staircase' describes the visual appearance of the pattern—price descends in steps like walking down a staircase. Each 'step' is a decline followed by a partial retracement.
How It Forms
Formation Steps
- 1Price makes a series of lower highs and lower lows
- 2Each decline is followed by a partial retracement that forms a lower high
- 3The structure creates a visible step-like or staircase descent
- 4Each step maintains a consistent rhythm of decline and partial recovery
Prerequisites
- Established downtrend
- Consistent selling pressure with periodic relief rallies
Confirmation Signals
- Each new high is lower than the previous high
- Each new low is lower than the previous low
- Volume expands on the down legs and contracts on the up legs
Invalidation Signals
- A higher high breaks the descending sequence
- A strong rally reverses the most recent decline entirely
- Volume pattern reverses (expanding on rallies)
Candle Breakdown
Down Leg
A series of bearish candles that push price to a new low, forming the vertical part of the step.
Sellers drive price lower with conviction. Volume expands during these moves, showing genuine selling pressure.
Recovery Leg (Lower High)
A partial rally that creates a lower high—the horizontal part of the step. This rally fails to reclaim the prior high.
Buyers attempt a recovery but lack conviction. The declining volume during rallies shows that demand is weak.
Psychology
The staircase pattern reveals a market under persistent, organized selling pressure. Sellers are patient and methodical, allowing minor recoveries before pushing price to new lows.
Buyer Perspective
Buyers try to catch the bottom at each step, but each recovery fails at a lower level, progressively demoralizing them.
Seller Perspective
Sellers use each rally as an opportunity to add to short positions at better prices. The consistent lower highs give them confidence that the trend is intact.
Smart Money Action
Institutional sellers create the staircase by selling into each recovery rally, maintaining steady selling pressure without causing panic that might attract bottom-fishers.
Retail Trader Trap
Retail traders buy each 'dip,' expecting a reversal, only to watch their position decline to new lows on the next step down.
Emotional Cycle
Trading Strategy
Aggressive Entry
Enter short at the lower high of each new step, when the recovery rally shows signs of stalling.
Conservative Entry
Wait for price to break below the previous step's low, confirming the new lower low, then enter on the next recovery.
The next step down (equal to the average step size)
Two steps down from the entry
Major support level below the staircase
Best Conditions
- Timeframe: 1D
- Timeframe: 4h
- Timeframe: 1h
- Orderly downtrends
- Bear markets
- Rate hiking cycles
- Asset: Stocks
- Asset: Indices
- Asset: Forex
- Asset: Crypto
Avoid When
- Timeframe: 1m
- High-volatility crash environments
- V-shaped reversal markets
Confluence Factors
- Each lower high aligns with a declining moving average
- RSI stays below 50 throughout the staircase
- Volume pattern consistently favors the sell side
- The staircase occurs within a larger bearish trend
- Fibonacci retracement levels align with each lower high
Scale In Strategy
Add to the position at each new lower high, building a larger position as the staircase continues.
Scale Out Strategy
Take partial profits at each new lower low.
Risk Management
Volume Analysis
Volume Confirmation
Volume should be higher on the down legs and lower on the recovery legs. This confirms seller dominance.
Volume Profile
Consistent volume pattern across steps: expanding on declines, contracting on rallies.
Volume Divergence
If recovery leg volume starts increasing, the staircase may be approaching its end.
Technical Confluence
Support Resistance
Each lower high becomes a new resistance level. Each lower low becomes a new support level to target.
Fibonacci Levels
Each recovery rally often retraces 38.2-50% of the prior down leg, forming the lower high at a Fibonacci level.
Moving Averages
The 20 EMA often acts as dynamic resistance, with each lower high kissing the EMA before declining.
Rsi Confirmation
RSI oscillating between 30-50 throughout the staircase, never reaching overbought, confirms bearish control.
Macd Confirmation
MACD below zero with lower histogram peaks on each rally confirms weakening bounce attempts.
Bollinger Bands
Price walking along the lower Bollinger Band with each rally reaching the middle band before reversing.
Vwap
Price consistently trading below VWAP, with each rally failing at VWAP, confirms institutional selling.
Ichimoku Cloud
Price below the Kumo cloud with Tenkan below Kijun confirms the staircase is within a bearish Ichimoku context.
Elliott Wave
The staircase often represents a series of smaller impulsive waves within a larger Wave 3 or Wave C decline.
Wyckoff Phase
The staircase is the visual representation of the markdown phase in the Wyckoff cycle.
Market Profile
Each step creates a new lower value area, with the market profile consistently rotating lower.
Order Flow
Cumulative delta trends negative with each step, confirming net selling.
Open Interest
Monitor open interest changes for additional confirmation of institutional participation in the move.
Multi-Timeframe Analysis
Higher Timeframe Alignment
A daily staircase within a weekly downtrend provides the best context for continuation trades.
Lower Timeframe Entry
Use the 1H chart to time entries at each lower high within the daily staircase.
Timeframe Confluence
Daily staircase with 4H entry timing and weekly bearish confirmation is ideal.
Top-Down Approach
Weekly downtrend > Daily staircase structure > 4H or 1H entry at lower highs.
Statistics
Historical Examples
S&P 500 2022 Staircase Decline
successThe S&P 500 formed a textbook staircase pattern throughout 2022, with each rally making a lower high before the next leg down. The pattern persisted for months, with each step clearly visible.
Lesson: In orderly bear markets, the staircase pattern can persist for months, providing multiple entry opportunities at each lower high.
Variations
Steep Staircase
A staircase with large steps (deep declines and shallow recoveries), indicating aggressive selling.
Shallow Staircase
A staircase with small steps and deep recoveries, indicating more contested selling.
Confusion Matrix
Patterns commonly confused with Bearish Staircase Down and how to distinguish them.
Bearish Descending Channel
7500% similarIf the highs and lows can be connected by smooth parallel lines, it is a descending channel. If the pattern shows distinct steps with horizontal consolidation areas, it is a staircase.
Key Differences
- A descending channel has parallel trendlines; a staircase has distinct steps
- The staircase shows clear horizontal consolidation at each step
- Channels are smooth; staircases have a step-like rhythm
The Descending Channel is a chart formation where price trends lower within two parallel downward-sloping trendlines, making consistent lower highs and lower lows in an orderly bearish progression.
The Downtrend is the most fundamental bearish pattern — a persistent series of lower highs and lower lows demonstrating that sellers consistently overwhelm buyers at progressively lower price levels.
The bearish flag is a continuation pattern consisting of a sharp decline (flagpole) followed by a gentle upward-sloping consolidation (flag) before price breaks down to continue the trend.
Bearish lower highs is a fundamental trend structure pattern where each successive swing high forms at a lower level, confirming bearish momentum and a downtrend. It is the most basic and important bearish market structure signal.
The Bullish Staircase Up is a trend continuation formation consisting of alternating impulse moves and consolidation periods, creating a step-like progression of higher highs and higher lows that confirms a healthy, sustainable uptrend.
The Bearish Breakaway is a five-candle reversal pattern where a gap-up rally stalls over three sessions before a powerful bearish candle breaks back down into the gap, signaling the uptrend is exhausted.
Pro Tips & Common Mistakes
Pro Tips
- The consistency of the step size is your edge—measure the average step to project the next target.
- Use the 20 EMA as a dynamic guide for lower highs—the staircase often respects this moving average.
- The staircase ends when either a higher high breaks the sequence or a climactic sell-off accelerates the decline.
- Be prepared for the staircase to end without warning—always use stop losses above the current lower high.
- Trading each step rather than trying to ride the entire staircase provides more manageable risk.
Common Mistakes
- Buying each dip expecting a reversal instead of recognizing the staircase continuation
- Not recognizing when the staircase rhythm changes (steps getting smaller or larger)
- Holding short positions through recovery rallies without stops
- Missing the end of the staircase when a higher high finally forms
- Over-complicating analysis—the pattern is simply lower highs and lower lows
Advanced Techniques
- Measure the average step size (both the decline and recovery) to project future steps with remarkable accuracy.
- Use the Fibonacci retracement of each down leg to predict where the lower high will form (typically 38.2-50%).
- Track the angle of descent—a steepening angle suggests the staircase may transition to a freefall.
- Use the end of a staircase (first higher high) as an early signal for a potential trend reversal.
Institutional Perspective
Institutional selling programs often create staircase patterns because algorithms are designed to sell in measured increments, allowing minor recoveries to provide fresh selling opportunities at better prices.
Fun Facts
- The S&P 500's 2022 bear market is often cited as a textbook staircase decline, with each step clearly visible on the daily chart.
- Algorithmic trading programs often create staircase patterns because they are designed to sell in measured increments.
- The staircase pattern is the visual embodiment of Dow Theory's trend definition.
Frequently Asked Questions
A bearish staircase is a visual trend pattern showing price declining in rhythmic steps—each step consists of a decline to a new low followed by a partial recovery that forms a lower high before the next leg down.
Enter short at each lower high (when the recovery rally stalls) with a stop above the lower high. Target the next step down, which you can estimate by measuring the average step size.