Overview
Bearish Ladder Top
Hashigo Gaeshi
Also known as: Ladder Top Reversal, Staircase Reversal
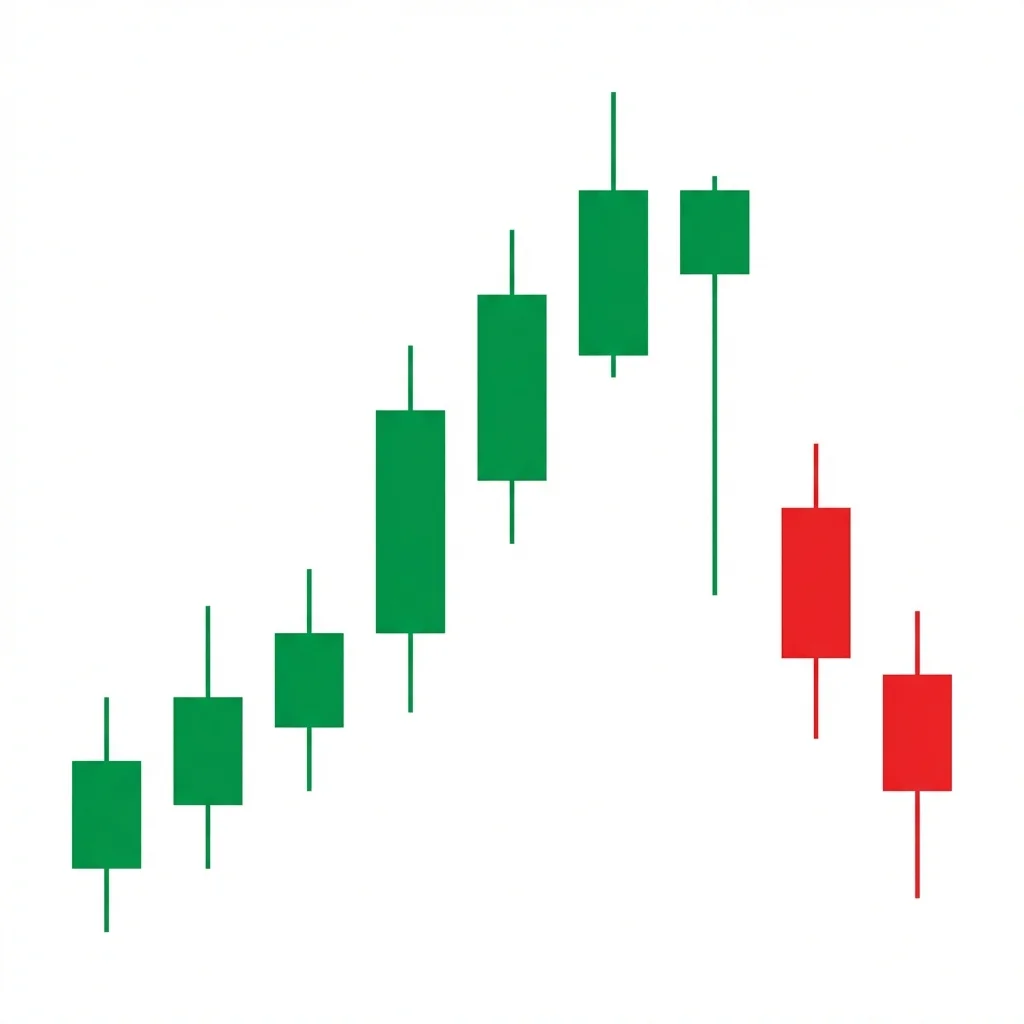
The ladder top is a five-candle bearish reversal pattern where three bullish candles climb like a ladder, a fourth candle shows hesitation, and a fifth bearish candle confirms the reversal by closing below the third candle's close.
The ladder top pattern captures the final stages of an uptrend in a visually intuitive way. Three consecutive bullish candles represent the steady climb upward (the ladder). The fourth candle shows the first sign of trouble — it may open higher but fails to make meaningful progress, often showing a long upper shadow. The fifth candle confirms the reversal with a strong bearish close that descends below the third candle's close, effectively 'breaking the ladder.' The pattern shows the transition from orderly buying to exhaustion to decisive selling.
History & Etymology
The ladder top is documented in Japanese candlestick literature as a pattern that captures the gradual exhaustion of buying momentum. The ladder metaphor resonated with Japanese rice traders who saw the steady climb followed by a fall as a common market dynamic.
Named 'hashigo gaeshi' (ladder reversal) because the three rising candles resemble steps on a ladder, and the reversal represents falling off the ladder.
How It Forms
Formation Steps
- 1Three consecutive bullish candles, each closing higher (like three white soldiers)
- 2Fourth candle opens higher but shows hesitation — small body with an upper shadow
- 3Fifth candle is bearish, opening below the fourth candle's body and closing below the third candle's close
Prerequisites
- Prior uptrend
- Three consecutive bullish candles 'climbing the ladder'
Confirmation Signals
- Fifth candle closes below the third candle's close
- Volume increases on the fifth candle
- Follow-through selling after the pattern
Invalidation Signals
- Fifth candle fails to close below the third candle's close
- Price continues higher after the fourth candle
- Volume remains low on the fifth candle
Candle Breakdown
First Step
Bullish candle opening and closing higher, the first rung of the ladder.
Confident buying. Bulls are in control.
Second Step
Another bullish candle closing higher, continuing the staircase climb.
Buying continues but may show slightly less enthusiasm.
Third Step
Third bullish candle, completing the three-step ladder.
Last strong buying session. The ladder is at its highest point.
Hesitation Candle
Opens higher but closes with a small body and long upper shadow, showing failed attempts at higher prices.
Buying momentum stalls. The long upper shadow shows rejection at higher prices.
Reversal Candle
Strong bearish candle that opens below the hesitation candle and closes below the third candle's close.
The ladder breaks. Sellers take control decisively, erasing the hesitation candle and part of the ladder.
Psychology
The ladder top captures the final ascent of a trend in a structured, visual way. The steady climb creates complacency, the hesitation creates doubt, and the reversal candle creates panic.
Buyer Perspective
Buyers feel confident during the three-step climb. The hesitation candle creates the first doubt, and the sharp fifth candle forces them to exit.
Seller Perspective
Sellers observe the hesitation after the climb and recognize exhaustion. The fifth candle is their entry signal.
Smart Money Action
Institutions sell during the hesitation candle (fourth), using the remaining buying as liquidity. The fifth candle is when their selling becomes visible.
Retail Trader Trap
Retail traders buy the steady climb and hold through the hesitation, expecting continuation. The reversal catches them off guard.
Emotional Cycle
Trading Strategy
Aggressive Entry
Short on the close of the hesitation candle if it shows a clear long upper shadow.
Conservative Entry
Wait for the fifth candle to close below the third candle's close, confirming the pattern.
Total height of the three-step ladder projected downward.
Start of the ladder (first candle's open).
Prior support level below the ladder.
Best Conditions
- Timeframe: daily
- Timeframe: 4h
- Timeframe: weekly
- end of uptrend
- overbought
- at resistance
- Asset: stocks
- Asset: forex
- Asset: indices
Avoid When
- Timeframe: 1m
- Timeframe: 5m
- strong bull market
- low volatility
Confluence Factors
- Pattern at resistance
- RSI overbought
- Declining volume on the ladder
- MACD divergence
- Fibonacci level alignment
Scale In Strategy
Enter 50% on the fifth candle, add 50% on break below the first candle's open.
Scale Out Strategy
Take 50% at TP1, trail remainder.
Risk Management
Volume Analysis
Volume Confirmation
Volume should decline on the hesitation candle and increase on the reversal candle.
Volume Profile
The hesitation candle area should show lower volume than the ladder candles.
Volume Divergence
Increasing volume on the hesitation candle suggests accumulation, not exhaustion.
Technical Confluence
Support Resistance
The hesitation candle's high becomes resistance. The pattern is strongest at pre-existing resistance.
Fibonacci Levels
Ladder top at a Fibonacci extension level adds conviction.
Moving Averages
Hesitation near a moving average (50 or 200 SMA) strengthens the signal.
Rsi Confirmation
RSI declining from overbought territory during the hesitation and reversal candles.
Macd Confirmation
MACD histogram declining during the last two candles confirms fading momentum.
Bollinger Bands
Ladder reaching the upper band with the hesitation candle rejecting at the band is bearish.
Vwap
Fifth candle closing below VWAP confirms institutional selling.
Ichimoku Cloud
Ladder top at the Senkou Span B or Kumo cloud edge is a reliable short setup.
Elliott Wave
Ladder tops often form at the end of Wave 5, with the hesitation being the termination signal.
Wyckoff Phase
The ladder top maps to the final upthrust in distribution.
Market Profile
The hesitation candle creates a buying tail excess that gets rejected.
Order Flow
Delta turning negative on the hesitation and reversal candles.
Open Interest
Put buying increasing during the hesitation phase.
Multi-Timeframe Analysis
Higher Timeframe Alignment
Ladder top on the weekly is a major reversal signal.
Lower Timeframe Entry
Use 4H to identify the hesitation and reversal for precise timing.
Timeframe Confluence
Pattern visible on both daily and 4H confirms the signal.
Top-Down Approach
Weekly resistance → Daily ladder top → 4H entry on reversal candle.
Statistics
Historical Examples
Apple Ladder Top 2021
successApple formed a ladder top near its all-time high with three consecutive bullish sessions, a hesitation with an upper shadow, and a reversal candle that started a 10% correction.
Lesson: Ladder tops in mega-cap stocks near all-time highs can signal meaningful corrections.
Variations
Perfect Ladder Top
Three equal-sized bullish candles, clear hesitation, and strong reversal.
Extended Ladder Top
Four or more bullish candles before the hesitation.
Confusion Matrix
Patterns commonly confused with Bearish Ladder Top and how to distinguish them.
Bearish Advance Block
70% similarIf the three bullish candles show progressively smaller bodies with longer upper shadows, it is an advance block. If the three bullish candles are similar-sized and the fourth candle is the first sign of weakness, it is a ladder top.
Key Differences
- Advance block has progressively smaller bullish bodies
- Ladder top has three similar-sized bullish candles then a distinct hesitation
- Advance block shows gradual weakening; ladder shows sudden stall
The Bearish Advance Block shows three consecutive bullish candles with progressively smaller bodies and longer upper shadows, signaling that buying momentum is weakening and a reversal or consolidation is likely.
The Dark Cloud Cover is a two-candle bearish reversal pattern where a bearish candle opens above the prior bullish candle's high and closes below its midpoint, signaling that the bullish 'sky' is being covered by a bearish 'dark cloud.'
The Deliberation pattern shows two strong bullish candles followed by a small-bodied third candle, indicating that the uptrend is 'deliberating' — the bulls have stalled and are uncertain about pushing higher.
The Bearish Engulfing is one of the most powerful and commonly traded two-candle reversal patterns. A large bearish candle completely engulfs the prior bullish candle, demonstrating a decisive shift from buying to selling dominance.
The Ladder Bottom is a five-candle bullish reversal pattern where three descending bearish candles are followed by an exhaustion signal and a confirming bullish candle, resembling climbing down and then back up a ladder.
The Bearish Breakaway is a five-candle reversal pattern where a gap-up rally stalls over three sessions before a powerful bearish candle breaks back down into the gap, signaling the uptrend is exhausted.
Pro Tips & Common Mistakes
Pro Tips
- The hesitation candle's upper shadow length is key — longer shadows indicate stronger rejection.
- Compare the three ladder candles — they should be similar in size. Progressively smaller candles suggest advance block instead.
- Volume declining across the three steps and spiking on the reversal is the ideal profile.
- The pattern requires all five candles to be valid — partial patterns should not be traded.
Common Mistakes
- Confusing the ladder top with an advance block — check the body sizes of the first three candles.
- Entering on the hesitation candle without waiting for the reversal confirmation.
- Trading the pattern in strong bull markets where the hesitation may just be a brief pause.
- Not verifying that the fifth candle closes below the third candle's close.
Advanced Techniques
- Use the hesitation candle's internal structure (lower timeframe) to identify the exact rejection point.
- Combine with breadth analysis: if the broader market is showing fewer new highs during the ladder formation, the reversal is more likely.
- Monitor institutional ownership changes during the ladder period for distribution signals.
- Use the three-step measurement as the projected decline distance.
Institutional Perspective
The ladder represents the final phase of institutional buying. The hesitation candle is where they begin to distribute, and the reversal candle confirms the transition to selling.
Fun Facts
- The ladder top is one of the few five-candle patterns that has a clear, intuitive visual metaphor — climbing a ladder and then falling off.
- The pattern is relatively rare in its perfect form, making it a 'collectors item' among candlestick enthusiasts.
Frequently Asked Questions
A ladder top is a five-candle bearish reversal pattern where three bullish candles climb steadily, a fourth candle shows hesitation, and a fifth bearish candle confirms the reversal.
In a ladder top, the three bullish candles are similar in size. In an advance block, each successive bullish candle has a smaller body, showing gradual weakening.