Overview
Bullish Breakaway
Also known as: Bullish Breakaway Five-Line, Five-Candle Breakaway
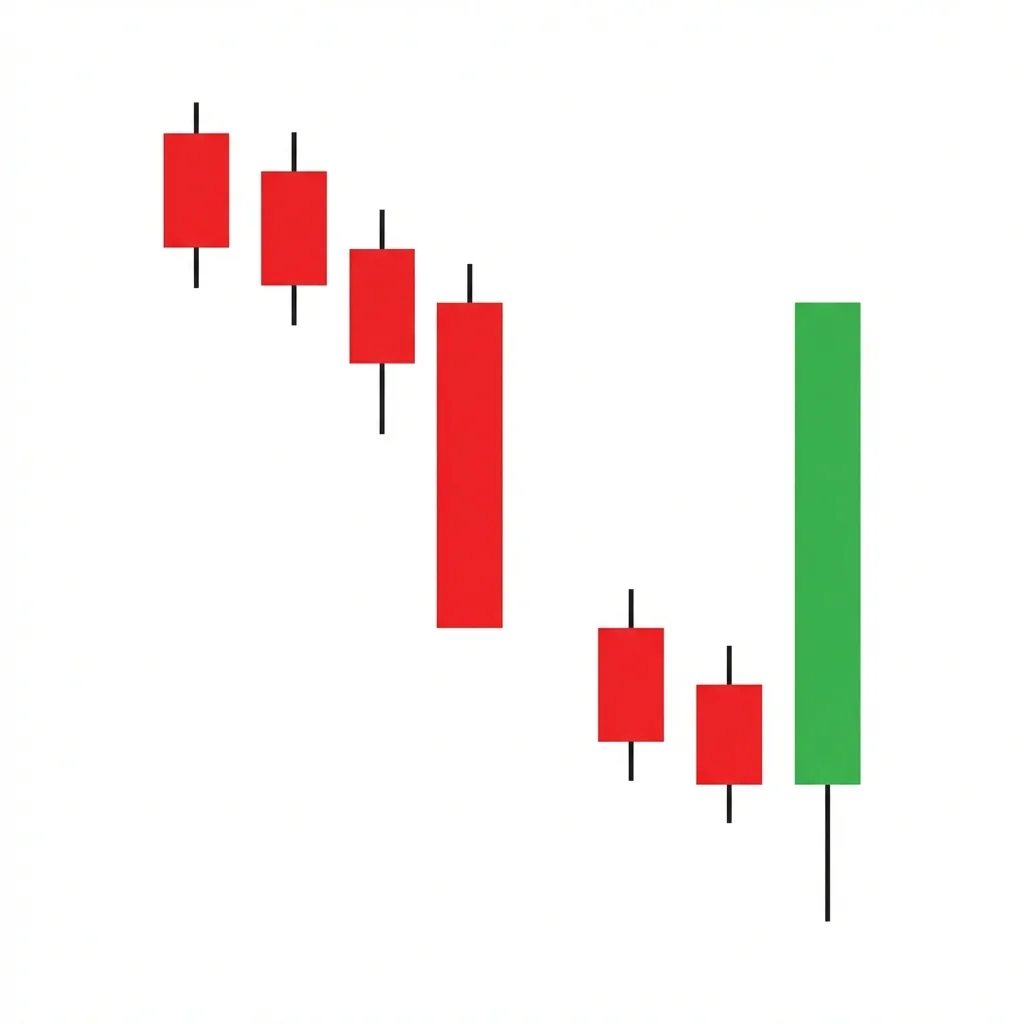
The Bullish Breakaway is a five-candle reversal pattern where a gap-down continuation is followed by progressively smaller candles and a strong bullish candle that reclaims the gap, signaling exhaustion of selling pressure.
The Bullish Breakaway begins with a long bearish candle followed by a gap down on the second candle, seeming to confirm the downtrend's continuation. However, the following candles (third and fourth) are notably smaller, showing that bearish momentum is fading rapidly. The fifth candle is a long bullish candle that rallies back into the gap zone between the first and second candles. This reclaiming of the gap signals that the selling exhaustion visible in candles 2-4 has culminated in a genuine reversal. The pattern is relatively rare because it requires a specific gap-and-fade structure, but when it appears, it provides a clear visual narrative of momentum shifting from sellers to buyers.
History & Etymology
The Breakaway pattern was cataloged in Japanese candlestick literature and brought to Western attention by Gregory Morris and Steve Nison. It is considered one of the more complex multi-candle patterns due to its five-candle requirement and specific gap structure.
The name 'breakaway' refers to the final candle breaking away from the recent bearish momentum and the small-candle congestion zone, reversing decisively back toward the gap area.
How It Forms
Formation Steps
- 1First candle: long bearish candle continuing the downtrend
- 2Second candle: bearish candle that gaps down from the first candle
- 3Third candle: small-bodied candle (can be bullish or bearish), staying within the range
- 4Fourth candle: small-bodied bearish candle that continues slightly lower
- 5Fifth candle: long bullish candle that closes within the gap between the first and second candle
Prerequisites
- Established downtrend
- A gap down between the first and second candles
- Progressively smaller candles in positions 2-4 showing momentum loss
Confirmation Signals
- Fifth candle closes within or above the gap between candles 1 and 2
- Volume increases on the fifth candle
- Follow-through buying after the pattern completes
Invalidation Signals
- Fifth candle fails to close within the gap
- Price continues lower after the fifth candle
- No volume expansion on the reversal candle
Candle Breakdown
Trend Continuation
Long bearish candle that confirms the existing downtrend.
Bears are in full control. Confidence in the downtrend is strong.
Gap Down
A bearish candle that gaps below the first candle, seemingly accelerating the decline.
The gap down creates panic. Sellers feel vindicated, but this is often the exhaustion point.
Stalling Candle
A small-bodied candle showing that the decline is losing momentum.
Momentum stalls. The small body shows indecision — sellers cannot push prices lower with the same force.
Further Stalling
Another small candle, potentially slightly lower, confirming momentum exhaustion.
Selling pressure has nearly dried up. The candle is small, showing that bears have run out of steam.
Breakaway Candle
A long bullish candle that closes within the gap between candles 1 and 2, signaling the reversal.
Buyers surge in with conviction. The reclaiming of the gap traps shorts and signals a decisive momentum shift.
Psychology
The Breakaway pattern tells the story of a sell-off that exhausts itself. The gap down looks like acceleration, but the progressively smaller candles reveal that selling is drying up. The final bullish candle confirms the power shift.
Buyer Perspective
Smart buyers notice the diminishing candle sizes (momentum loss) and prepare to enter. The fifth candle confirms their thesis that sellers are exhausted.
Seller Perspective
Sellers are initially confident after the gap down but become frustrated as price stops declining. The fifth candle forces them to cover.
Smart Money Action
Institutions begin accumulating during the small-candle zone (candles 3-4) when retail sellers have exhausted their supply. The fifth candle often shows institutional buy programs executing.
Retail Trader Trap
Retail traders who shorted on the gap down find their positions increasingly uncomfortable as the decline stalls, then are forced to cover on the bullish breakaway candle.
Emotional Cycle
Trading Strategy
Aggressive Entry
Enter long at the close of the fifth candle if it closes within the gap zone.
Conservative Entry
Wait for the sixth candle to close above the fifth candle's high for confirmation.
At the high of the first candle (fully closing the gap).
At the swing high that preceded the downtrend.
Measured move equal to the pattern's total range projected upward.
Best Conditions
- Timeframe: daily
- Timeframe: weekly
- After gap-down exhaustion moves
- Near major support levels
- In oversold markets
- Asset: stocks
- Asset: futures
Avoid When
- Timeframe: 1m
- Timeframe: 5m
- Timeframe: 15m
- In free-falling markets with systematic selling
- During fundamental deterioration
Confluence Factors
- Pattern forms at a major support level
- RSI is oversold (below 30) during candles 3-4
- Volume pattern confirms (high-low-low-low-high)
- The gap fills a prior exhaustion gap
Scale In Strategy
Enter 50% on the fifth candle's close, add 50% on confirmation above the gap zone.
Scale Out Strategy
Take 33% at the gap fill, 33% at the prior high, trail the remainder.
Risk Management
Volume Analysis
Volume Confirmation
Volume should be highest on candles 1-2, decline on candles 3-4, and spike on candle 5. This volume pattern confirms the exhaustion-reversal narrative.
Volume Profile
Declining volume during the stalling phase is critical — it shows sellers drying up.
Volume Divergence
If volume remains high during candles 3-4, the pattern is less reliable — sellers may not be exhausted.
Technical Confluence
Support Resistance
The low of the pattern (candles 2-4) becomes a significant support level if the reversal succeeds.
Fibonacci Levels
The pattern often forms near Fibonacci retracement levels of the prior uptrend.
Moving Averages
The stalling zone (candles 3-4) often coincides with a major moving average providing support.
Rsi Confirmation
RSI showing bullish divergence during the stalling phase strongly confirms the reversal.
Macd Confirmation
MACD histogram becoming less negative during candles 3-4 and crossing bullish on candle 5.
Bollinger Bands
The gap down often pushes price to or beyond the lower Bollinger Band. The fifth candle re-enters the bands.
Vwap
On intraday versions, reclaiming VWAP on the fifth candle confirms the reversal.
Ichimoku Cloud
The pattern often forms below the cloud, and the reversal may begin the process of re-entering the cloud.
Elliott Wave
May mark the end of an extended Wave 3 or Wave 5 down.
Wyckoff Phase
Can appear as part of the selling climax in a Wyckoff accumulation sequence.
Market Profile
The stalling candles often form at a high-volume node, indicating value acceptance at those prices.
Order Flow
Cumulative delta should start rising during candles 3-4 even as price is flat, showing buying absorption.
Open Interest
Declining open interest during the stalling phase suggests short covering is beginning.
Multi-Timeframe Analysis
Higher Timeframe Alignment
A daily breakaway at weekly support has the highest success rate.
Lower Timeframe Entry
Use the 4-hour chart to time entry during the fifth candle formation.
Timeframe Confluence
Best when the daily pattern aligns with weekly oversold conditions.
Top-Down Approach
Weekly identifies oversold support → Daily spots the breakaway → 4-hour times the entry.
Statistics
Historical Examples
Intel Breakaway Pattern After Guidance Cut
partialIntel gapped down sharply after disappointing guidance, then formed a five-candle breakaway pattern as selling exhausted. The reversal produced a 10% bounce before stalling at prior resistance.
Lesson: Breakaway patterns after fundamental shocks may produce strong bounces but can stall at prior resistance levels. Take partial profits early.
Variations
Extended Breakaway
Six or seven candles instead of five, with a longer stalling phase.
Confusion Matrix
Patterns commonly confused with Bullish Breakaway and how to distinguish them.
Bullish Morning Star
5000% similarCount the candles and look for the gap structure. Breakaway has a specific five-candle exhaustion sequence.
Key Differences
- Morning Star is three candles; Breakaway is five
- Breakaway requires a gap down and progressively smaller candles
The Bearish Breakaway is a five-candle reversal pattern where a gap-up rally stalls over three sessions before a powerful bearish candle breaks back down into the gap, signaling the uptrend is exhausted.
The Bullish Concealing Baby Swallow is an extremely rare four-candle reversal pattern consisting of bearish marubozus where the third candle's upper shadow (the baby) is concealed by the fourth candle, signaling exhaustion of the downtrend.
The Bullish Engulfing is one of the most popular and reliable two-candle reversal patterns. A large bullish candle completely engulfs the prior bearish candle body, signaling a decisive shift from selling to buying control.
The Morning Star is a three-candle bullish reversal pattern consisting of a large bearish candle, a small star candle showing indecision, and a large bullish candle confirming the reversal. It is one of the most widely recognized and reliable bottom reversal signals.
The Bullish Three Inside Up is a three-candle reversal pattern that combines a bullish harami with a confirming third candle that closes above the first candle's open, providing a more reliable reversal signal than the harami alone.
The ladder top is a five-candle bearish reversal pattern where three bullish candles climb like a ladder, a fourth candle shows hesitation, and a fifth bearish candle confirms the reversal by closing below the third candle's close.
Pro Tips & Common Mistakes
Pro Tips
- The smaller the candles in positions 3-4 relative to candles 1-2, the more convincing the exhaustion
- The fifth candle should close within the gap — if it only closes near its own open, the signal is weak
- Volume pattern is crucial: look for declining volume on candles 3-4 and a spike on candle 5
- This pattern is rare enough that you should not expect to see it frequently — do not force the identification
- Combine with RSI divergence for highest conviction setups
Common Mistakes
- Identifying any five-candle sequence as a breakaway — the specific gap and size requirements must be met
- Ignoring the volume pattern — the exhaustion narrative must be confirmed by volume
- Trading this pattern on intraday charts where gaps between candles are meaningless
- Not waiting for the fifth candle to complete before entering
- Setting unrealistic profit targets — this is a moderate-reliability pattern
Advanced Techniques
- Monitor the relative candle sizes to quantify the exhaustion rate (each candle should be smaller than the previous)
- Use OBV (On-Balance Volume) to confirm accumulation during the stalling phase
- Combine with Fibonacci analysis to see if the pattern terminates at a retracement level
- Use options to trade the pattern with defined risk — buy calls expiring 3-4 weeks out
Institutional Perspective
The breakaway pattern often reflects institutional buying during the 'quiet' stalling phase (candles 3-4). Large funds accumulate positions while retail attention moves elsewhere, then the fifth candle reveals the accumulated demand.
Fun Facts
- The Breakaway pattern is one of only a handful of five-candle patterns in traditional candlestick analysis, making it one of the most complex structures to identify.
- Gregory Morris found that the bullish breakaway had a slightly higher success rate than its bearish counterpart in his statistical analysis of candlestick patterns.
Frequently Asked Questions
The Breakaway is relatively rare because it requires a specific five-candle structure with a gap. On daily stock charts, you might see it a few times per year across a large universe of stocks. It is almost nonexistent on forex charts due to the lack of gaps.
No. The fifth candle needs to close within the gap zone (between the first and second candle), but it does not need to fully close the gap. Closing within the gap is sufficient to confirm the reversal.