Overview
Bearish Tweezer Top
Kenuki
Also known as: Tweezer Top, Matching Highs, Double Top Candle
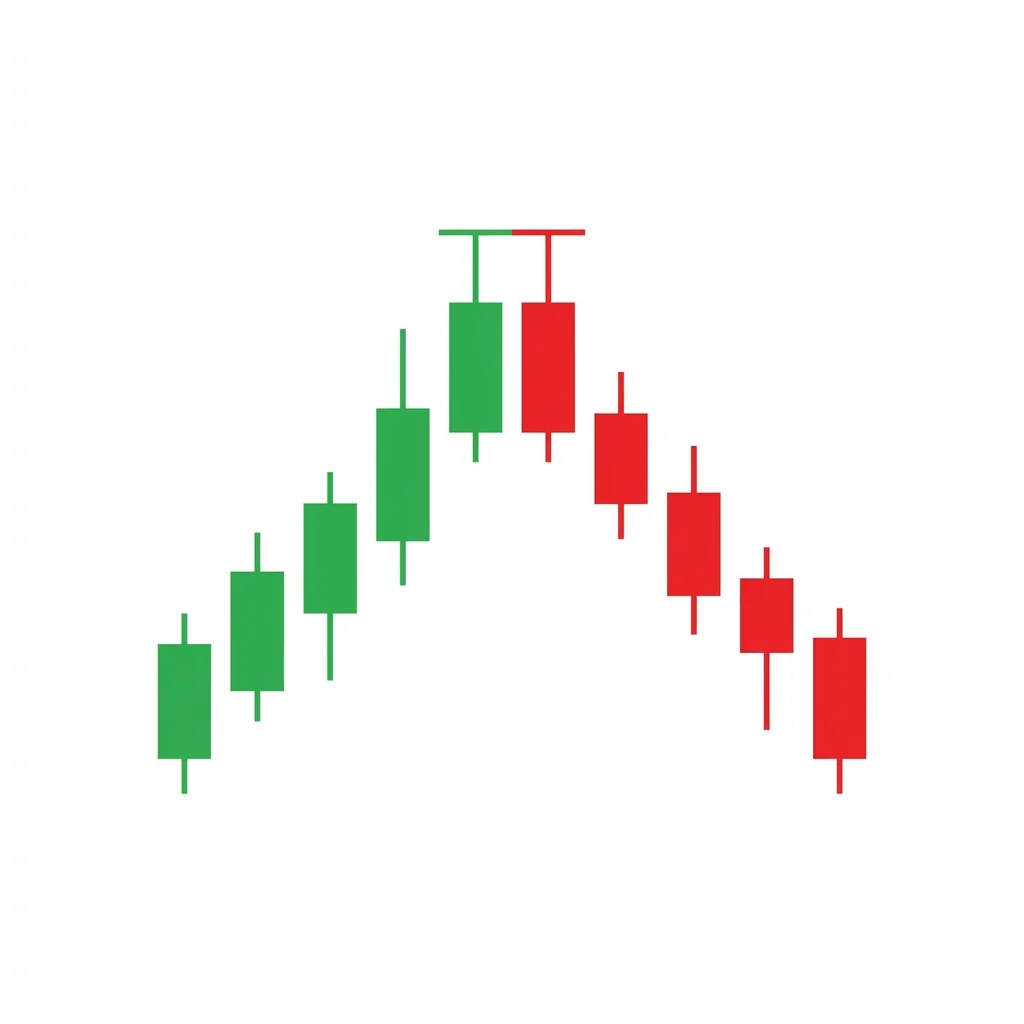
The tweezer top is a two-candle bearish reversal pattern where two consecutive candles reach the same high price and are rejected. The matching highs demonstrate a precise resistance level where sellers consistently overwhelm buyers.
The tweezer top is a simple but effective reversal pattern identified by two consecutive candles that share the same high (or very close to the same high). The first candle is typically bullish, pushing to a new high, and the second candle tests that exact level again but fails, often closing bearish. The matching highs create a precise pinch point (like the tips of tweezers) that defines a specific resistance level. The pattern works because the exact same price rejected buyers twice in immediate succession, demonstrating that sellers are firmly defending that level. While not as powerful as some other reversal patterns, the tweezer top gains significance when it appears at known resistance levels, with volume confirmation, or within other bearish patterns (the tweezer top is often a component of evening stars, bearish engulfing patterns, and other formations).
History & Etymology
Tweezer tops are documented in Steve Nison's work on Japanese candlestick charting. The concept of matching highs (or lows for bottoms) was recognized by Japanese rice traders as a significant reversal signal. The name 'tweezer' was coined by Nison for its resemblance to the pinching tips of tweezers.
'Tweezer' refers to the matching highs that resemble the parallel tips of a pair of tweezers. The Japanese name 'kenuki' also means tweezers. 'Top' indicates the pattern forms at the peak of an uptrend.
How It Forms
Formation Steps
- 1Two consecutive candles with matching or near-matching highs
- 2The first candle is typically bullish, the second is bearish
- 3Both candles test the same high price and are rejected
- 4The matching highs create a 'tweezer' pinch point at resistance
Prerequisites
- Established uptrend leading into the pattern
- Both candles should reach the same high (within 0.1-0.2%)
Confirmation Signals
- Third candle closes below the second candle's low
- Volume increases on the bearish candle
- RSI showing overbought conditions
Invalidation Signals
- Price breaks above the tweezer highs
- Strong bullish follow-through
- Volume supports a breakout
Candle Breakdown
First Tweezer Candle
Typically a bullish candle that establishes the high point. Its high sets the resistance level.
Buyers push price to a new high, establishing the level that will be tested again.
Second Tweezer Candle
Tests the same high as the first candle and is rejected, typically closing bearish.
The second test of the exact same level fails, confirming it as a precise resistance point. Two rejections create conviction.
Psychology
Two tests of the same exact high in consecutive sessions demonstrate a precise resistance level that sellers are defending. This double rejection at the same price creates a clear reversal signal.
Buyer Perspective
Buyers try to break through the same level twice and fail both times. The precise nature of the rejection demoralizes them—the level clearly cannot be broken.
Seller Perspective
Sellers see their resistance level holding twice, giving them confidence to add to short positions. The exact price match confirms their level is correct.
Smart Money Action
Institutional sell orders resting at a specific price create the matching highs. The fact that the exact level is defended twice confirms the institutional selling intent.
Retail Trader Trap
Retail traders buy the second push to the high expecting a breakout, placing stops just below the pattern. The reversal triggers these stops.
Emotional Cycle
Trading Strategy
Aggressive Entry
Enter short when the second candle makes the matching high and shows rejection (before the close).
Conservative Entry
Wait for the second candle to close bearish, then enter short on the next candle.
Previous swing low
1.5x the tallest tweezer candle's range
Next major support
Best Conditions
- Timeframe: 1D
- Timeframe: 4h
- Timeframe: 1h
- After rallies to resistance
- Overbought conditions
- Near round numbers
- Asset: Stocks
- Asset: Forex
- Asset: Indices
- Asset: Crypto
Avoid When
- Timeframe: 1m
- Timeframe: 5m
- Strong momentum uptrends
- Breakout environments
Confluence Factors
- Matching highs at a known resistance level
- RSI overbought
- Bearish divergence
- Fibonacci extension level
- Round number at the highs
Scale In Strategy
Enter on the tweezer completion, add on confirmation.
Scale Out Strategy
Take 50% at first support, trail the rest.
Risk Management
Volume Analysis
Volume Confirmation
Higher volume on the bearish candle than the bullish one strengthens the signal.
Volume Profile
Volume concentrated at the high price level confirms active selling.
Volume Divergence
Both candles with low volume weakens the significance.
Technical Confluence
Support Resistance
The matching highs define a precise resistance level. This is the pattern's core contribution.
Fibonacci Levels
Tweezer tops at Fibonacci extension levels are particularly significant.
Moving Averages
Tweezer tops at a major moving average (50 or 200 SMA) add confluence.
Rsi Confirmation
RSI above 70 with the tweezer adds overbought confirmation.
Macd Confirmation
MACD showing divergence at the tweezer highs confirms weakening momentum.
Bollinger Bands
Both candle highs touching the upper Bollinger Band confirm overextension.
Vwap
Tweezer top at or above VWAP in premium territory supports the short thesis.
Ichimoku Cloud
Tweezer highs at the Kumo cloud boundary add Ichimoku resistance.
Elliott Wave
Can mark the terminal point of a fifth wave or C wave.
Wyckoff Phase
May represent the UTAD or BC in Wyckoff distribution.
Market Profile
Matching highs at the value area high (VAH) confirm the rejection.
Order Flow
Sell orders absorbing buy orders at the tweezer level create the matching highs.
Open Interest
Rising open interest at the tweezer level suggests new short positions being opened.
Multi-Timeframe Analysis
Higher Timeframe Alignment
Daily tweezer top at weekly resistance is a high-conviction setup.
Lower Timeframe Entry
Use the 4H chart to time the entry after the daily tweezer forms.
Timeframe Confluence
4H tweezer at daily resistance with weekly overbought conditions.
Top-Down Approach
Weekly resistance > Daily tweezer top > 4H confirmation entry.
Statistics
Historical Examples
EUR/USD Tweezer Top at 1.1275
successEUR/USD formed a daily tweezer top at 1.1275 with two consecutive candles matching the high to the pip. The reversal led to a 300-pip decline.
Lesson: In forex, tweezer tops with precise pip-level matching are highly respected by institutional traders.
Variations
Tweezer Top with Engulfing
The second candle not only matches the high but also engulfs the first candle's body.
Confusion Matrix
Patterns commonly confused with Bearish Tweezer Top and how to distinguish them.
Bearish Pipe Top
8500% similarIf both candles have long upper shadows reaching the same high, it can be classified as both. If the matching highs come from candle bodies or short wicks, it is a tweezer but not a pipe top.
Key Differences
- Pipe top specifically requires long upper shadows; tweezer top only requires matching highs
- Tweezer top can have various candle shapes; pipe top has specific shadow requirements
- Pipe top is a subset of tweezer top with additional criteria
The Double Top is an M-shaped reversal pattern where price tests a resistance level twice and fails, creating two peaks at similar levels. The breakdown below the neckline (trough between peaks) confirms the reversal with a measured move target equal to the pattern height.
The Bearish Engulfing is one of the most powerful and commonly traded two-candle reversal patterns. A large bearish candle completely engulfs the prior bullish candle, demonstrating a decisive shift from buying to selling dominance.
The bearish matching high is a two-candle reversal pattern where two consecutive candles close at the same or very near the same price, creating a resistance level that signals the uptrend may be stalling.
The bearish pipe top consists of two adjacent candles with long upper shadows reaching similar highs, showing that sellers twice defended a price level. This double rejection signals strong overhead resistance and an impending reversal.
The shooting star is a single-candle bearish reversal pattern with a small body near the low and a long upper shadow. It shows that buyers pushed price significantly higher during the session but sellers drove it back down, signaling a potential top.
The Confirmed Shooting Star adds a bearish confirmation candle to the classic shooting star, eliminating the ambiguity of the standalone pattern and creating a higher-probability reversal signal at the top of uptrends.
Pro Tips & Common Mistakes
Pro Tips
- The more precise the matching highs, the stronger the signal—exact matches are more significant than near-matches.
- Tweezer tops often appear as components of larger patterns (evening stars, engulfing patterns).
- The pattern is most powerful when it coincides with a known horizontal resistance level.
- Use tight stops just above the tweezer highs for excellent risk-reward.
- A bearish second candle (closing near its low) is more reliable than a bullish second candle that merely matched the high.
Common Mistakes
- Accepting highs that are not actually matching (more than 0.2% apart)
- Trading tweezer tops in the middle of strong uptrends
- Not waiting for bearish confirmation after the pattern
- Ignoring the context—tweezer tops at random levels are less significant
Advanced Techniques
- Use precise price data to verify that the highs are truly matching—rounding can hide slight differences.
- Combine with order book analysis to see if there are concentrated sell orders at the tweezer level.
Institutional Perspective
The matching highs often result from institutional sell limit orders placed at a specific price. When price touches this level twice and is rejected, it confirms that the institutional selling interest is genuine and significant.
Fun Facts
- The name 'tweezer' was coined by Steve Nison because the matching highs look like the tips of a pair of tweezers.
- Tweezer tops are incredibly common—they appear far more often than most other candlestick patterns because any two adjacent candles with matching highs qualify.
- Many other patterns (evening stars, engulfing) contain a tweezer top component within them.
Frequently Asked Questions
Two consecutive candles with matching (or near-matching) highs at the top of an uptrend. The double rejection at the same price signals a resistance level and potential reversal.
Ideally within 0.1-0.2% of each other. In forex, matching to the pip is ideal. In stocks, matching to the cent. The closer the match, the stronger the signal.