Overview
Bearish Triple Top
Also known as: Triple Top Reversal, Three Peaks, Triple Ceiling
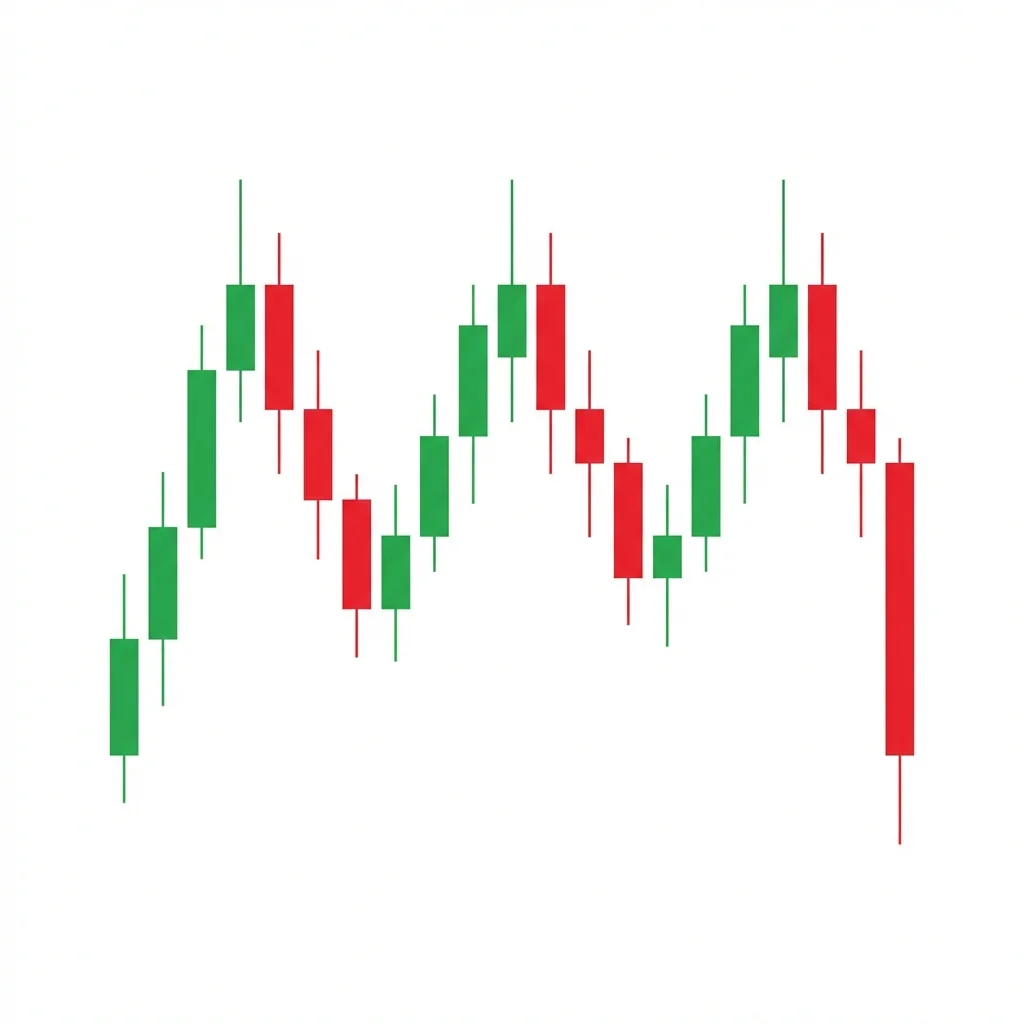
The triple top is a powerful bearish reversal pattern formed by three peaks at approximately the same price level, separated by two pullbacks. The pattern confirms when price breaks below the neckline, with a measured target equal to the pattern's height projected downward.
The triple top is among the most reliable bearish reversal patterns. It forms when price attempts to break through a resistance level three times and fails each time, creating three distinct peaks at similar levels. The two pullbacks between the peaks form the troughs, and a neckline is drawn connecting these trough lows. The pattern signals that sellers are firmly defending the resistance level and buyers are unable to generate enough momentum to break through despite three separate attempts. When price finally breaks below the neckline, it confirms the reversal. The measured move target equals the distance from the peaks to the neckline, projected downward from the neckline break. The triple top is generally more reliable than the double top because the third failed attempt adds additional confirmation of resistance strength.
History & Etymology
The triple top has been documented in technical analysis since Edwards and Magee's work in 1948. The pattern is a natural extension of the double top concept, with the additional third peak providing extra confirmation of the reversal. It is one of the most widely recognized and respected chart patterns.
'Triple' refers to the three peaks. 'Top' indicates the pattern forms at the peak of an uptrend, signaling a reversal to the downside.
How It Forms
Formation Steps
- 1Three peaks form at approximately the same price level
- 2Two troughs (valleys) form between the peaks
- 3The neckline connects the two trough lows
- 4Price breaks below the neckline to confirm the reversal
Prerequisites
- Established uptrend
- The three peaks should be at similar price levels (within 1-3%)
- At least several weeks between peaks on daily charts
Confirmation Signals
- Close below the neckline with increased volume
- Failed retest of the broken neckline
- Moving averages turning bearish
Invalidation Signals
- Price breaks above the highest peak
- Strong volume-backed breakout above resistance
- The pattern takes too long (over a year) to complete
Candle Breakdown
First Peak
Price rallies to a new high, establishing the resistance level. A pullback follows to form the first trough.
Strong buying creates the initial high. The pullback is seen as normal profit-taking.
Second Peak
Price rallies again to approximately the same level as the first peak and is rejected again.
Buyers try again but meet the same resistance. Volume may be lower than the first peak, showing waning enthusiasm.
Third Peak
The final attempt to break through resistance fails, completing the triple rejection.
The third failure is the most demoralizing. Buyers realize the resistance is impenetrable and begin to exit.
Psychology
Three failed attempts at the same level demonstrate definitive resistance. Each failure erodes buyer confidence until the neckline break triggers widespread selling.
Buyer Perspective
Buyers grow increasingly frustrated with each failed breakout attempt. By the third failure, they lose conviction and begin selling, contributing to the neckline break.
Seller Perspective
Sellers gain confidence with each successful defense of the resistance level. By the third peak, they are fully committed and aggressive in their selling.
Smart Money Action
Institutional sellers distribute their positions across all three peaks, completing their selling before the neckline break makes the reversal obvious.
Retail Trader Trap
Retail traders buy each pullback expecting a breakout, accumulating losing positions that they are forced to sell when the neckline breaks.
Emotional Cycle
Trading Strategy
Aggressive Entry
Enter short at the third peak when it shows rejection at the resistance level.
Conservative Entry
Wait for the neckline break and enter on a pullback retest of the broken neckline.
Height of the pattern projected below the neckline (measured move)
Next major support level
150% of the measured move
Best Conditions
- Timeframe: 1D
- Timeframe: 1W
- After extended uptrends
- Near all-time highs
- Sector tops
- Asset: Stocks
- Asset: Indices
- Asset: Commodities
- Asset: Crypto
Avoid When
- Timeframe: 1m
- Timeframe: 5m
- Timeframe: 15m
- Strong momentum markets
- Low-volatility environments
Confluence Factors
- Volume declining on each peak
- RSI bearish divergence across the peaks
- Moving average death cross forming
- Fibonacci extension at the peak level
- Fundamental deterioration
Scale In Strategy
Enter at the third peak rejection, add on the neckline break.
Scale Out Strategy
Take 50% at the measured move, trail the rest.
Risk Management
Volume Analysis
Volume Confirmation
Volume should decrease on each successive peak and increase on the neckline breakdown.
Volume Profile
Declining volume on peaks is the most important volume characteristic—it shows waning buying interest.
Volume Divergence
Increasing volume on the third peak without a breakout may signal absorption rather than weakness.
Technical Confluence
Support Resistance
The peaks define the resistance. The neckline defines the support. Once the neckline breaks, it becomes resistance.
Fibonacci Levels
The peaks often align with key Fibonacci extension levels. Retracement targets after the break follow standard Fibonacci levels.
Moving Averages
Death cross forming during the pattern adds confirmation. The 200 SMA near the peaks provides extra resistance.
Rsi Confirmation
RSI showing lower highs across the three peaks (bearish divergence) is one of the strongest confirmations.
Macd Confirmation
MACD making lower highs across the peaks confirms declining momentum.
Bollinger Bands
Each peak touching the upper band with less force confirms weakening buying.
Vwap
Price failing to hold above VWAP after each peak confirms distribution.
Ichimoku Cloud
Price falling through the Kumo cloud after the neckline break is powerful confirmation.
Elliott Wave
Triple tops can mark the end of a fifth wave or a B wave in Elliott Wave theory.
Wyckoff Phase
The triple top is a variant of Wyckoff distribution with three distinct upthrusts.
Market Profile
The three peaks create a high-volume node at resistance that price cannot accept above.
Order Flow
Net selling increasing at each peak despite stable prices confirms supply absorption.
Open Interest
Increasing open interest at resistance suggests new short positions are being established.
Multi-Timeframe Analysis
Higher Timeframe Alignment
A daily triple top at a weekly resistance level is the highest conviction setup.
Lower Timeframe Entry
Use the 4H chart to time the neckline break and entry.
Timeframe Confluence
Weekly resistance with daily triple top and 4H breakdown confirmation.
Top-Down Approach
Weekly resistance > Daily triple top > 4H neckline break > Entry.
Statistics
Historical Examples
Gold Triple Top at $2,075
partialGold tested the $2,075 level three times (2020, 2022, 2023) before eventually breaking through. However, each failed test led to significant corrections.
Lesson: Triple tops on very long timeframes can take years to resolve. Each failed test creates a tradeable correction even if the pattern eventually fails.
Netflix Triple Top
successNetflix formed a triple top near $700, with three peaks between October-November 2021. The neckline break led to a 75% decline to $165.
Lesson: Triple tops in momentum stocks that lose fundamental support can lead to devastating declines.
Variations
Uneven Triple Top
Three peaks at slightly different levels, with no single peak significantly higher than the others.
Triple Top with Rising Neckline
The neckline slopes upward, with each trough higher than the previous one.
Confusion Matrix
Patterns commonly confused with Bearish Triple Top and how to distinguish them.
Bearish Head Shoulders
7000% similarIf the middle peak is significantly higher than the two outer peaks, it is a head and shoulders. If all three peaks are at approximately the same level, it is a triple top.
Key Differences
- H&S has a higher middle peak (head); triple top has equal peaks
- H&S has an asymmetric neckline; triple top has a flatter neckline
- Different structural implications
The Distribution phase is a Wyckoff concept where institutional investors systematically sell (distribute) their holdings to the public within a trading range at a market top, before the subsequent markdown (decline) begins.
The Double Top is an M-shaped reversal pattern where price tests a resistance level twice and fails, creating two peaks at similar levels. The breakdown below the neckline (trough between peaks) confirms the reversal with a measured move target equal to the pattern height.
The head and shoulders is the most well-known reversal pattern in technical analysis. It consists of three peaks — a higher middle peak (head) flanked by two lower peaks (shoulders) — and signals a major bearish reversal when the neckline breaks.
A bearish resistance rejection occurs when price rallies into a well-established resistance level and is met with selling pressure, producing bearish candles with long upper wicks. The repeated failure to break through resistance signals a reversal.
The Triple Bottom is a major reversal pattern featuring three distinct lows at approximately the same price level, separated by two intermediate peaks. The breakout above the neckline confirms the reversal and targets a measured move equal to the pattern height.
The Broadening Top (Megaphone) is a chart formation characterized by expanding price swings that create higher highs and lower lows, reflecting increasing volatility and instability at market tops before a bearish breakdown.
Pro Tips & Common Mistakes
Pro Tips
- The three peaks should be within 1-3% of each other for a valid triple top.
- Declining volume on each successive peak is the most important confirmation factor.
- The neckline retest after the breakdown offers the best risk-reward entry.
- RSI bearish divergence across the three peaks is extremely reliable.
- Triple tops are more reliable than double tops because the third failed attempt adds conviction.
Common Mistakes
- Declaring a triple top before the neckline breaks
- Not drawing the neckline correctly—connect the trough lows
- Ignoring volume analysis across the peaks
- Being impatient—the pattern takes weeks or months to form
- Setting the measured move target incorrectly
Advanced Techniques
- Use point-and-figure charts to count the horizontal cause at the triple top for an accurate price target.
- Track the breadth of the market during each peak—decreasing breadth confirms the distribution thesis.
- Combine with options strategies: sell call spreads at the resistance level on the third peak.
Institutional Perspective
Institutional managers distribute their holdings across all three peaks, using each rally to the resistance level as a selling opportunity. The neckline break confirms that distribution is complete.
Fun Facts
- The triple top is sometimes called 'three strikes and you're out' by traders, borrowing from baseball terminology.
- Some of the most famous market tops in history—including the Dow's 1,000 level in the 1970s—formed triple top patterns.
- Triple tops are rarer than double tops because price usually breaks through or reverses before the third attempt.
Frequently Asked Questions
A triple top is a bearish reversal pattern with three peaks at approximately the same price level, separated by two pullbacks. It is confirmed when price breaks below the neckline connecting the pullback lows.
Yes. The third failed breakout attempt adds extra confirmation that the resistance level is impenetrable, making the triple top generally more reliable than the double top.