Overview
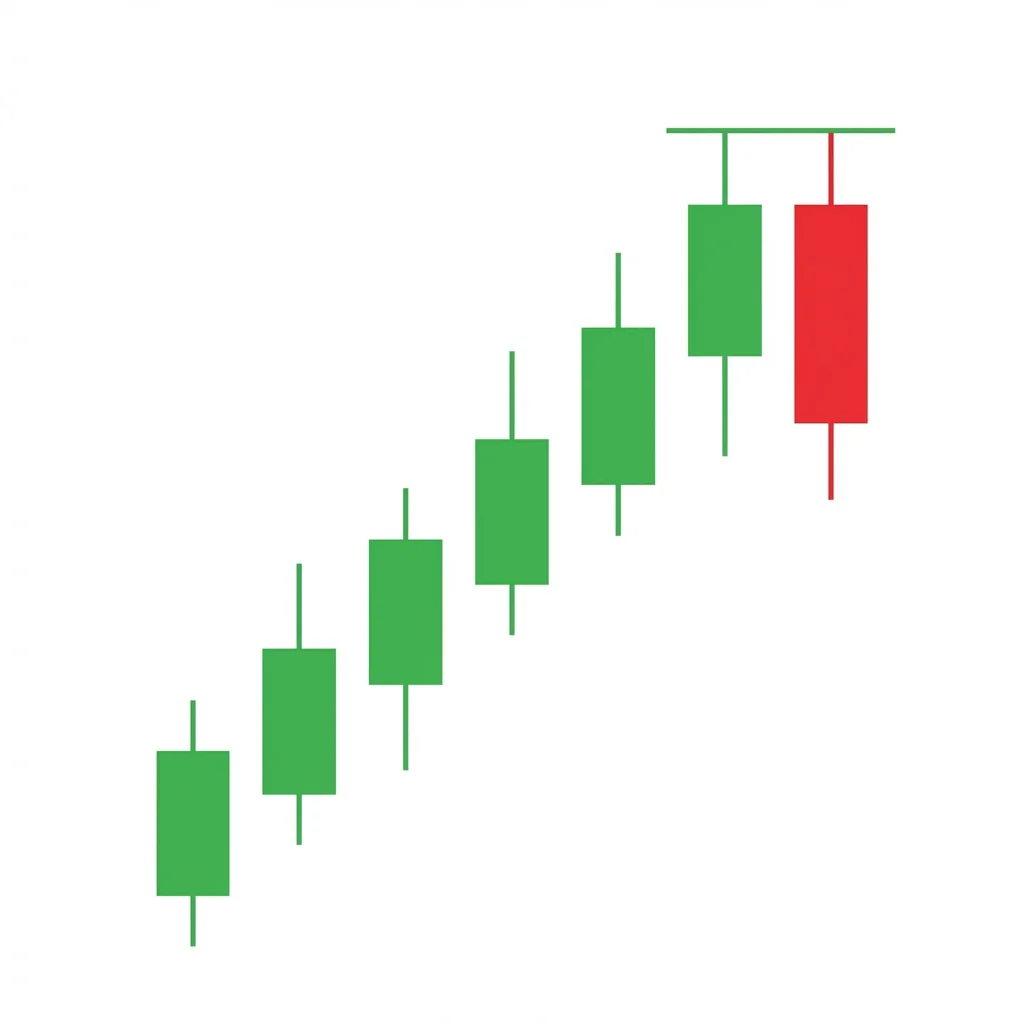
Bearish Matching High
Kenuki
Also known as: Tweezers Top Variant, Equal Highs, Double Rejection High
The bearish matching high is a two-candle reversal pattern where two consecutive candles close at the same or very near the same price, creating a resistance level that signals the uptrend may be stalling.
The matching high occurs when two candles in an uptrend close at the same price (or very close), creating a visible ceiling. This matching level acts as micro-resistance, suggesting that the market has twice failed to push beyond this price. The pattern is essentially a mini double-top compressed into two sessions. While not as powerful as larger reversal patterns, it provides an early warning of potential exhaustion and is most effective when it occurs at significant resistance levels or when combined with other bearish signals.
History & Etymology
The matching high is documented in Japanese candlestick literature as a pattern of price rejection. Japanese traders recognized that when price hit the same level twice in succession, the market was signaling resistance.
The name simply describes the pattern: two candles with 'matching' (equal) 'high' prices or closes.
How It Forms
Formation Steps
- 1First candle: bullish candle with a specific high price in an uptrend
- 2Second candle: closes at or very near the same high as the first candle
- 3Both candles reach the same price ceiling
- 4The matching high creates a micro double top
Prerequisites
- Uptrend in progress
- Two candles with matching or near-matching closes/highs
Confirmation Signals
- Third candle closes below the second candle's low
- Volume increases on the decline
- Follow-through selling
Invalidation Signals
- Price breaks above the matching high level
- Strong bullish candle exceeds the matched level
- No follow-through selling
Candle Breakdown
First Candle
A bullish candle in an uptrend that establishes the high price level.
Bulls push price to a specific level. This becomes the reference.
Matching Candle
A candle that closes at the same level as the first, failing to exceed it.
Price reaches the same ceiling and fails to push through. Double rejection at this level signals resistance.
Psychology
The matching high shows that the market has twice been unable to push beyond a specific price level, creating a micro-resistance that may cap further advances.
Buyer Perspective
Buyers attempt to push higher on the second candle but hit the same ceiling as the first. The double failure creates doubt about the continuation of the rally.
Seller Perspective
Sellers note the double rejection and gain confidence that a resistance level is established.
Smart Money Action
Institutions may be placing sell limit orders at a specific price, creating the matching high. The consistent ceiling suggests institutional distribution at that level.
Retail Trader Trap
Retail traders may not notice the matching closes and continue buying, only to be caught when the level rejects a third time.
Emotional Cycle
Trading Strategy
Aggressive Entry
Short on the close of the second candle if it matches the first and shows a bearish close.
Conservative Entry
Wait for a third candle to close below the second candle's low.
Average body size of the two candles projected downward.
Prior support level.
Start of the recent rally.
Best Conditions
- Timeframe: daily
- Timeframe: 4h
- Timeframe: weekly
- at resistance
- overbought
- end of rally
- Asset: stocks
- Asset: forex
- Asset: indices
Avoid When
- Timeframe: 1m
- Timeframe: 5m
- strong uptrend
- breakout
Confluence Factors
- At resistance
- RSI overbought
- Declining volume
- MACD divergence
- Fibonacci level
Scale In Strategy
Enter 50% on confirmation, 50% on further decline.
Scale Out Strategy
Take 50% at TP1, trail rest.
Risk Management
Volume Analysis
Volume Confirmation
Volume declining on the second candle compared to the first suggests waning buying interest.
Volume Profile
Concentration of volume at the matching level shows active two-way trading at resistance.
Volume Divergence
Increasing volume on the second candle suggests genuine buying — the pattern may fail.
Technical Confluence
Support Resistance
The matching level IS the resistance. Most powerful at pre-existing resistance.
Fibonacci Levels
Matching high at a Fibonacci level strengthens the signal.
Moving Averages
Matching high at a moving average adds confluence.
Rsi Confirmation
RSI overbought at the matching level.
Macd Confirmation
MACD declining during the pattern.
Bollinger Bands
Both candles touching the upper band.
Vwap
Matching high at VWAP from above.
Ichimoku Cloud
Matching high at the cloud edge.
Elliott Wave
Often appears at the end of Wave 5.
Wyckoff Phase
Matching highs in distribution show a price ceiling.
Market Profile
Double rejection at the same price creates a clear excess.
Order Flow
Passive selling at the matching level absorbs buying.
Open Interest
Call OI at the matching level may act as a ceiling.
Multi-Timeframe Analysis
Higher Timeframe Alignment
Weekly matching high at major resistance is a strong signal.
Lower Timeframe Entry
Use 4H to time entry after the matching high forms on the daily.
Timeframe Confluence
Matching high on both daily and 4H at the same level.
Top-Down Approach
Weekly resistance → Daily matching high → 4H confirmation → Enter.
Statistics
Historical Examples
Gold Matching High at $2000
successGold closed at essentially the same level two days in a row near $2050, forming a matching high. Price declined $100 over the following weeks.
Lesson: Matching highs at major psychological levels in commodities can signal exhaustion.
Variations
Exact Matching High
Closes match to the exact tick.
Near Matching High
Closes within 0.1-0.2% of each other.
Confusion Matrix
Patterns commonly confused with Bearish Matching High and how to distinguish them.
Bearish Tweezer Top
85% similarIf the highs match, it is a tweezer top. If the closes match, it is a matching high. They can overlap if both highs and closes match.
Key Differences
- Tweezer top matches the HIGHS of two candles
- Matching high matches the CLOSES of two candles
- Both signal double rejection at a level
The Dark Cloud Cover is a two-candle bearish reversal pattern where a bearish candle opens above the prior bullish candle's high and closes below its midpoint, signaling that the bullish 'sky' is being covered by a bearish 'dark cloud.'
The Double Top is an M-shaped reversal pattern where price tests a resistance level twice and fails, creating two peaks at similar levels. The breakdown below the neckline (trough between peaks) confirms the reversal with a measured move target equal to the pattern height.
The Bearish Engulfing is one of the most powerful and commonly traded two-candle reversal patterns. A large bearish candle completely engulfs the prior bullish candle, demonstrating a decisive shift from buying to selling dominance.
The tweezer top is a two-candle bearish reversal pattern where two consecutive candles reach the same high price and are rejected. The matching highs demonstrate a precise resistance level where sellers consistently overwhelm buyers.
The Matching Low is a two-candle bullish reversal pattern where two consecutive bearish candles close at the same price, indicating a support level that sellers cannot breach.
The Confirmed Shooting Star adds a bearish confirmation candle to the classic shooting star, eliminating the ambiguity of the standalone pattern and creating a higher-probability reversal signal at the top of uptrends.
Pro Tips & Common Mistakes
Pro Tips
- The closes don't need to be exactly the same — within a few ticks is sufficient.
- The pattern is most useful as an early warning, not a standalone trade signal.
- Combine with other bearish confirmation for best results.
- The matching level becomes a clear reference for future resistance.
Common Mistakes
- Expecting large moves from this moderate pattern alone.
- Not requiring confirmation.
- Ignoring the broader trend context.
- Setting stops too tight at the matching level.
Advanced Techniques
- Use the matching level as a reference for options strike selection (sell calls at the matched level).
- Combine with volume profile analysis at the matching price.
- Look for matching highs across multiple timeframes for stronger signals.
Institutional Perspective
Matching highs often form at prices where institutions have concentrated sell limit orders. The consistent ceiling is the footprint of institutional distribution.
Fun Facts
- The matching high is essentially a two-session double top compressed into the shortest possible timeframe.
- The Japanese term 'kenuki' refers to tweezers, linking this pattern to the broader tweezers family.
Frequently Asked Questions
A matching high is a two-candle bearish reversal pattern where two consecutive candles close at the same or very similar price, creating a micro-resistance level.
A tweezer top matches the highs (wicks) of two candles, while a matching high matches the closes. They can overlap but are technically different patterns.