Overview
Bullish Cup and Handle
Also known as: Cup with Handle, U-Bottom with Handle, CnH Pattern
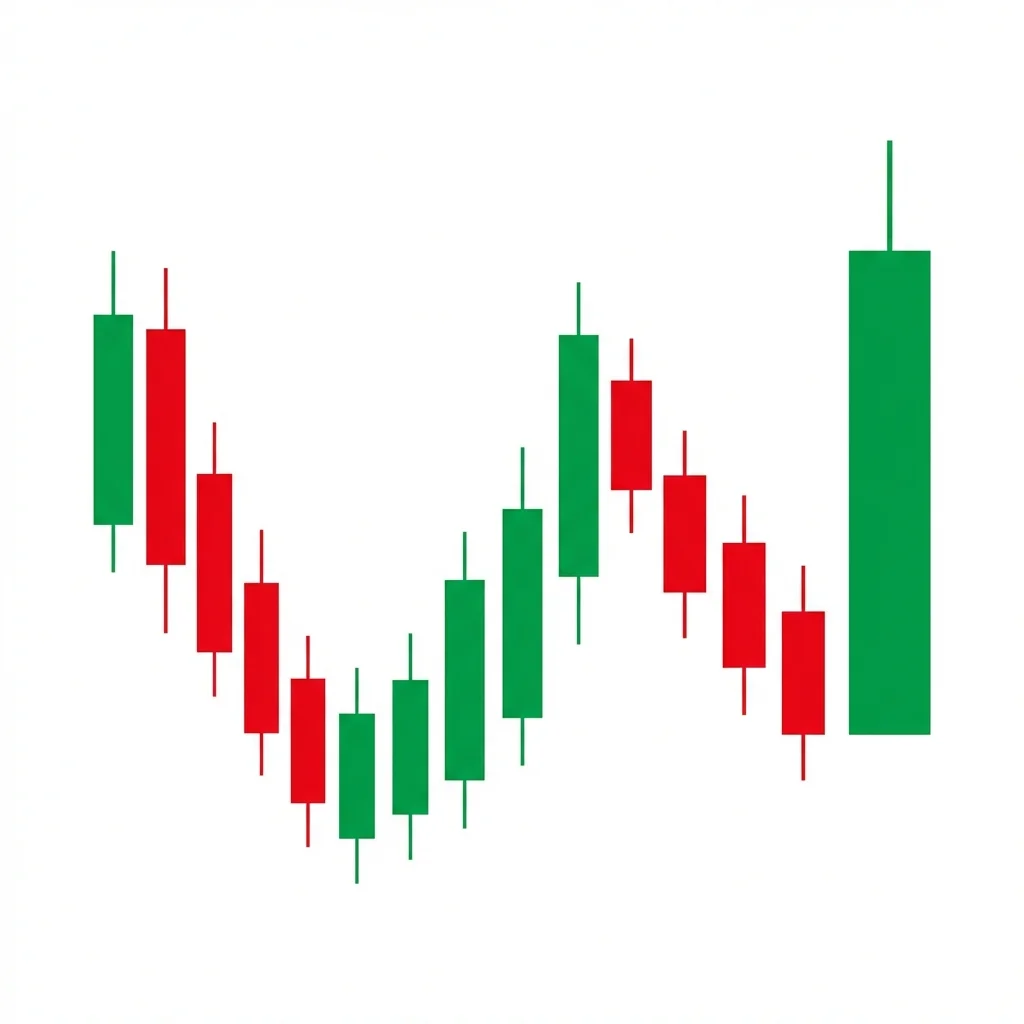
The Cup and Handle is one of the most reliable continuation patterns in technical analysis, featuring a rounded U-shaped base (cup) followed by a small pullback (handle) before a powerful breakout to new highs.
Popularized by William O'Neil in his CANSLIM methodology, the Cup and Handle forms when a stock in an uptrend corrects in a smooth, rounded fashion (the cup), recovers to the prior high level, and then consolidates in a small drift lower (the handle) before breaking out to new highs. The cup portion represents a period of correction and base-building, ideally lasting 7-65 weeks. The rounded bottom shows a gradual shift from selling to buying without the panic of a V-bottom. The handle provides one final shakeout of weak holders before the breakout. This pattern is favored by growth investors and momentum traders because it identifies stocks with strong fundamentals that are building institutional support.
History & Etymology
William O'Neil first described the Cup and Handle pattern in his 1988 book 'How to Make Money in Stocks.' He identified it as the most reliable chart pattern for growth stocks and incorporated it into his CANSLIM investment system. The pattern has since become one of the most studied and widely recognized chart formations in modern technical analysis.
The name comes from the visual resemblance to a tea cup viewed from the side. The rounded base is the cup, and the small consolidation before the breakout is the handle. O'Neil used this everyday object metaphor to make the pattern accessible to all investors.
How It Forms
Formation Steps
- 1Prior uptrend leading into the pattern
- 2Cup: a rounded U-shaped correction that retraces 12-35% of the prior advance
- 3Right side of cup rises to approximate level of the left side (prior high)
- 4Handle: a small pullback drifting downward for 1-4 weeks, retracing no more than half the cup depth
- 5Breakout above the handle high (cup rim) on volume
Prerequisites
- Established uptrend prior to the cup formation
- The cup should be U-shaped (rounded) not V-shaped
- The handle should form in the upper half of the cup
Confirmation Signals
- Breakout above the cup rim (handle high) on volume at least 50% above average
- Follow-through buying on subsequent sessions
- Handle pullback does not exceed 50% of cup depth
Invalidation Signals
- Handle drops below the cup midpoint
- Breakout fails and price falls back below the handle
- Cup is V-shaped (too sharp a recovery)
- Volume is absent on the breakout
Candle Breakdown
Cup Left Side
Price declines from the prior high forming the left side of the cup.
Profit-taking and normal correction begin. Volume should dry up as the cup deepens, showing that selling is not aggressive.
Cup Bottom
Price forms a rounded bottom over several weeks.
Supply is exhausted and demand begins to match. The rounded bottom shows a gradual, healthy transition rather than panic.
Handle and Breakout
A brief pullback (handle) followed by a breakout above the cup rim on volume.
The handle shakes out final weak holders. The breakout represents institutional commitment as the stock enters new high territory.
Psychology
The Cup and Handle maps the complete psychology of a base-building process: initial correction, gradual recovery, a final test of commitment (the handle), and then the reward of a breakout to new highs.
Buyer Perspective
Institutional buyers gradually accumulate during the cup formation, building large positions over weeks or months. The handle provides a final entry opportunity before the breakout.
Seller Perspective
Sellers who bought at the prior high sell during the cup. By the time the right side of the cup reaches the prior high, the selling is exhausted. The handle shakes out the last remaining sellers.
Smart Money Action
Institutions accumulate throughout the cup, particularly at the bottom. The decreasing volume on the handle confirms they are not selling. The volume surge on breakout shows them adding final positions.
Retail Trader Trap
Retail traders sell at the cup bottom (capitulation), sell again at the rim (breakeven selling), and then chase the breakout at extended prices.
Emotional Cycle
Trading Strategy
Aggressive Entry
Enter within the handle pullback when price is 5-10% below the rim with a reversal candle.
Conservative Entry
Wait for a daily close above the cup rim (handle high) on volume at least 50% above the 50-day average.
Cup depth projected above the breakout point (measured move).
1.618x the cup depth above the breakout.
Use trailing stop for extended moves (common with CnH breakouts).
Best Conditions
- Timeframe: daily
- Timeframe: weekly
- Bull markets
- Growth stock environments
- Sector leadership rotations
- After market corrections recover
- Asset: stocks
- Asset: ETFs
Avoid When
- Timeframe: 1m
- Timeframe: 5m
- Timeframe: 15m
- Bear markets
- Recession fears
- Rising rate environments that pressure growth stocks
Confluence Factors
- Strong fundamental growth (earnings, revenue)
- RS line at new highs (relative strength vs market)
- Industry group leadership
- Volume dry up in the handle
- 50 SMA turning up and supporting the handle
Scale In Strategy
Enter 50% in the handle, add 50% on the breakout above the rim.
Scale Out Strategy
Hold for the measured move target. Take 33% at the cup depth target, trail the rest with the 50 SMA.
Risk Management
Volume Analysis
Volume Confirmation
Volume should dry up during the cup bottom and handle, then surge at least 50% above average on the breakout day. This is O'Neil's key requirement.
Volume Profile
Declining volume through the cup formation and handle, massive spike on the breakout.
Volume Divergence
Heavy volume during the handle (distribution) is a red flag that institutions are selling, not holding.
Technical Confluence
Support Resistance
The cup rim is the key resistance level. Once broken, it becomes strong support. The handle low is the invalidation level.
Fibonacci Levels
The cup should retrace 12-35% of the prior advance (shallow cups are stronger). The handle should retrace 33-50% of the cup depth.
Moving Averages
The 50 SMA should support the handle formation. The 200 SMA should be below the cup bottom. The 10-week MA turns up as the right side forms.
Rsi Confirmation
RSI should be above 50 during the right side of the cup and showing strength, not overbought, at the breakout.
Macd Confirmation
MACD should show a bullish crossover during the right side of the cup and maintain positive histogram through the breakout.
Bollinger Bands
The breakout often pushes price above the upper Bollinger Band, and staying above it confirms strong momentum.
Vwap
On breakout day, price should trade above VWAP for the entire session.
Ichimoku Cloud
Price recovering above the Kumo cloud during the right side of the cup confirms the bullish structure.
Elliott Wave
The cup may form as Wave 2 correction, and the breakout initiates Wave 3 (the strongest wave).
Wyckoff Phase
The cup represents the accumulation phase. The handle is the Last Point of Support (LPS). The breakout is the Sign of Strength (SOS).
Market Profile
The cup formation creates a balanced profile. The breakout creates an initiating move with single prints above the rim.
Order Flow
Institutional accumulation during the cup shows as passive buying (absorption). The breakout shows aggressive buying (initiative).
Open Interest
In options, increasing call open interest at the rim strike confirms breakout anticipation.
Multi-Timeframe Analysis
Higher Timeframe Alignment
A weekly cup and handle within a monthly uptrend is the ideal setup.
Lower Timeframe Entry
Use the daily chart to time entries within the handle and on the breakout day.
Timeframe Confluence
Monthly uptrend confirmed, weekly identifies the cup structure, daily times the breakout entry.
Top-Down Approach
Monthly confirms long-term uptrend. Weekly identifies the cup pattern. Daily identifies the handle and times the breakout entry.
Statistics
Historical Examples
Amazon Cup and Handle 2017
successAmazon formed a textbook cup and handle over several months in 2017. The cup formed between $750-$1000, with the handle pulling back to $960. The breakout above $1000 on massive volume led to a run to $2000 by 2018.
Lesson: The best cup and handle patterns occur in leading stocks with strong fundamentals. The breakout was supported by accelerating earnings growth.
Shopify Cup and Handle 2020
successShopify formed a cup from $300 to $180 and back to $300, then a handle pulling back to $280. The breakout on heavy volume preceded a rally to $1700.
Lesson: Cup and handles in high-growth tech stocks during strong market environments can produce exceptional returns.
Variations
Cup without Handle
Price breaks directly from the right rim without forming a handle.
High Handle Cup
The handle forms entirely above the cup midpoint, very near the rim.
Multi-Year Cup
A cup that forms over 1-3 years on a weekly/monthly chart.
Confusion Matrix
Patterns commonly confused with Bullish Cup and Handle and how to distinguish them.
Bullish Double Bottom
5500% similarLook at the bottom shape. A double bottom has two distinct V-shaped lows. A cup has one smooth, rounded bottom. Also, the cup requires a handle; the double bottom does not.
Key Differences
- Double bottom has a W-shape with two distinct lows
- Cup and Handle has a smooth U-shape with a rounded bottom
Bullish Rounding Bottom
7000% similarIf there is a small consolidation/pullback near the highs before the breakout, it is a Cup and Handle. If price breaks out directly from the rounded recovery, it is a rounding bottom.
Key Differences
- Rounding bottom does not require a handle
- Cup and Handle specifically requires the small pullback handle before breakout
The Double Bottom is one of the most recognized reversal patterns, forming a W-shape where price tests a support level twice and bounces, signaling that sellers cannot push through and buyers are gaining control.
The Bullish Flag is the quintessential continuation pattern: a sharp rally (pole) followed by a brief, tight consolidation (flag) before the next leg up. It represents a healthy pause in a strong uptrend.
The Bullish Rounding Bottom (Saucer Bottom) is a long-term reversal pattern that forms a U-shaped curve as selling pressure gradually gives way to buying pressure, signaling a major trend change from bearish to bullish.
The Broadening Top (Megaphone) is a chart formation characterized by expanding price swings that create higher highs and lower lows, reflecting increasing volatility and instability at market tops before a bearish breakdown.
The Descending Channel is a chart formation where price trends lower within two parallel downward-sloping trendlines, making consistent lower highs and lower lows in an orderly bearish progression.
The Descending Triangle is a bearish continuation pattern featuring a flat support level with lower highs converging into an apex, typically resolving with a breakdown below the horizontal support as sellers gradually overwhelm buyers.
Pro Tips & Common Mistakes
Pro Tips
- The cup should be U-shaped, not V-shaped. V-shaped recoveries suggest the base was not long enough to fully repair the supply-demand dynamics
- The handle should form in the upper half of the cup and drift downward (not sharply decline)
- Volume should contract during the handle. Heavy volume in the handle means institutions are distributing, not holding
- The breakout day should show volume at least 40-50% above the 50-day average, ideally much more
- Relative Strength line at or near new highs before the price breakout is a powerful confirmation (per O'Neil)
Common Mistakes
- Calling any U-shaped pattern a cup and handle without verifying the handle
- Buying deep in the cup rather than waiting for the handle and breakout
- Ignoring volume on the breakout day, which is the most critical confirmation
- Accepting V-shaped cups that did not build a proper base
- Holding through a handle that drops more than 50% of the cup depth, which signals distribution
Advanced Techniques
- Use O'Neil's RS line (relative strength vs S&P 500) to confirm the stock is a leader
- Monitor institutional sponsorship (fund ownership changes) during the cup formation
- Use the VCP (Volatility Contraction Pattern) concept within the handle for the tightest entry
- Analyze the cup depth relative to the market correction to identify stocks that declined less (relative strength)
Institutional Perspective
The Cup and Handle is the institutional accumulation pattern par excellence. Large funds need weeks to months to build positions without moving price, which is exactly what the cup provides. The handle is where they test their positions one final time before committing to the breakout.
Fun Facts
- William O'Neil claimed that the Cup and Handle was responsible for identifying more big stock market winners than any other pattern.
- Monster Beverage (MNST), one of the best-performing stocks of the 2000s, formed multiple Cup and Handle patterns on its way from $1 to over $90 (split-adjusted).
- O'Neil's research found that 95% of the greatest growth stocks in history formed some version of a base pattern, with the Cup and Handle being the most common.
Frequently Asked Questions
The cup typically takes 7-65 weeks to form, with most quality patterns completing in 3-6 months. The handle should last 1-4 weeks. Cups shorter than 7 weeks may not have built sufficient base, while those longer than 65 weeks may indicate a lack of institutional interest.
Ideally, the cup should retrace 12-35% from the prior high. Shallower cups (12-20%) indicate strong demand and are often the most powerful. Deeper cups (over 35%) suggest the stock may have more overhead resistance to work through.
A cup without a handle can still break out successfully, but the absence of the handle means there was no final shakeout of weak holders. This can sometimes lead to a less clean breakout with more initial volatility.