Overview
Bearish Descending Triangle
Also known as: Descending Triangle, Right-Angle Triangle Down, Flat Bottom Triangle
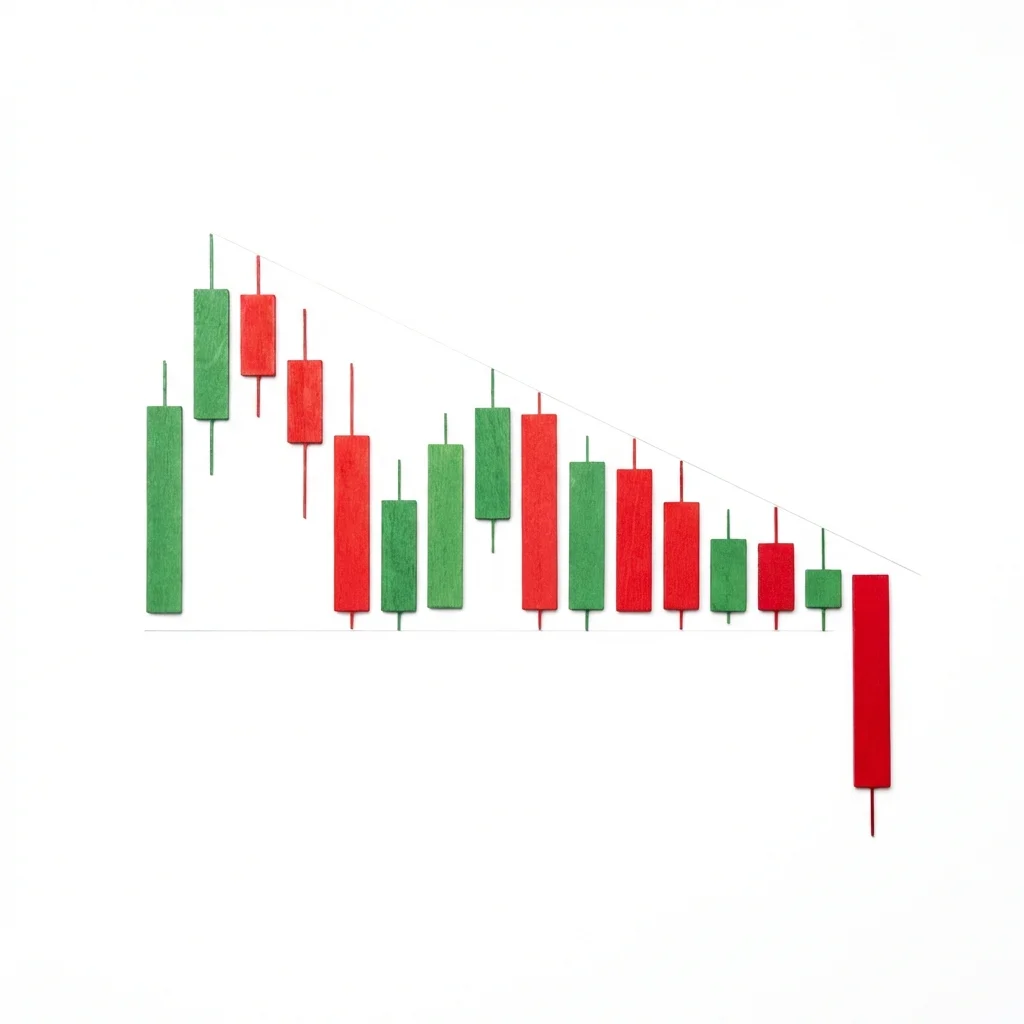
The Descending Triangle is a bearish continuation pattern featuring a flat support level with lower highs converging into an apex, typically resolving with a breakdown below the horizontal support as sellers gradually overwhelm buyers.
The Descending Triangle is one of the most reliable chart patterns in technical analysis. It forms when price repeatedly tests a horizontal support level while making progressively lower highs. The flat support shows that buyers consistently step in at the same level, but the declining highs reveal that sellers are growing more aggressive — they are willing to sell at progressively lower prices. This creates a pattern where price is squeezed into an increasingly narrow range between the flat support and the descending resistance line. Eventually, the compression resolves with a breakdown below support, as the relentless selling pressure finally overwhelms the buyers at that level. While the Descending Triangle is primarily a bearish pattern, approximately 30% of the time it breaks upward, making confirmation essential.
History & Etymology
The Descending Triangle was formally classified by Edwards and Magee in 'Technical Analysis of Stock Trends' (1948). They identified it as a 'right-angle triangle' with a flat bottom and declining top. The pattern has been validated by numerous quantitative studies, including Thomas Bulkowski's comprehensive analysis, which confirmed its bearish bias with measurable statistics.
The name describes the shape precisely: a triangle that descends (the upper boundary slopes downward) while the lower boundary remains flat (horizontal). The 'descending' refers to the series of lower highs that compress the price toward the flat support.
How It Forms
Formation Steps
- 1Horizontal support line at a consistent level (flat bottom)
- 2Descending upper trendline connecting lower highs
- 3Price oscillates between these two boundaries, with swings getting narrower
- 4The pattern converges toward the apex where both lines meet
- 5Breakdown occurs when price closes below the horizontal support
Prerequisites
- At least two bounces off the horizontal support level
- At least two lower highs defining the descending trendline
- Price compression — swings narrow over time
Confirmation Signals
- Close below horizontal support on above-average volume
- Retest of the broken support (now resistance) that holds
- Follow-through selling after the breakdown
- Volume expansion on the breakdown bar
Invalidation Signals
- Breakout above the descending trendline on high volume
- Price holds above support and forms higher lows
- Volume increases on upswings
Candle Breakdown
Test of Support
Price falls to the horizontal support and bounces. This creates or confirms the support level.
Buyers defend the support level. Limit buy orders absorb the selling pressure at this price.
Lower High
The rally from support fails to reach the previous high, creating a lower high.
Sellers are more eager. They sell at lower prices than before, pushing the rally ceiling down.
Breakdown
Price finally breaks below the horizontal support on increased volume, triggering the pattern's measured move.
The defenders at support finally capitulate. Stop losses below support are triggered. New sellers enter as the pattern breaks down.
Psychology
The Descending Triangle shows sellers gradually gaining the upper hand. Each lower high demonstrates increasing seller aggression, while the flat support represents determined but ultimately insufficient buyer defense.
Buyer Perspective
Buyers are defending a clear level they consider fair value or support. They buy on each test of this level. But each rally is weaker, which erodes their confidence. When support finally breaks, capitulation is severe.
Seller Perspective
Sellers are steadily increasing pressure. Each rally fails at a lower level, encouraging them. They know that the defenders at support will eventually run out of ammunition. The breakdown is the final push.
Smart Money Action
Institutions often sell on each rally to the descending trendline and place large sell orders below the support to trigger the breakdown. They accumulate short positions throughout the pattern.
Retail Trader Trap
Retail traders buy at support, expecting another bounce. Each successful bounce reinforces this behavior. When the breakdown occurs, all these support buyers are trapped with losses and their stop losses fuel the decline.
Emotional Cycle
Trading Strategy
Aggressive Entry
Short when price touches the descending trendline with a bearish reversal candle.
Conservative Entry
Short on a confirmed close below the horizontal support with above-average volume.
The pattern height (measured from support to the first high) subtracted from the breakdown level.
1.5x the pattern height projected downward.
Major support level below the pattern.
Best Conditions
- Timeframe: daily
- Timeframe: weekly
- Timeframe: 4h
- bear market
- downtrend continuation
- sector weakness
- Asset: stocks
- Asset: indices
- Asset: crypto
- Asset: forex
Avoid When
- Timeframe: 1m
- Timeframe: 5m
- strong bull market
- sector rotating into strength
Confluence Factors
- The pattern forms after a prior decline (continuation pattern)
- Volume declines during formation and spikes on breakdown
- The horizontal support aligns with a round number
- Higher timeframe shows resistance above the pattern
- RSI failing below 50 on each bounce
Scale In Strategy
Short 33% at descending trendline, add 33% on break below support, add 34% on retest of support as resistance.
Scale Out Strategy
Take 33% at 1x pattern height, 33% at 1.5x, trail 34%.
Risk Management
Volume Analysis
Volume Confirmation
Volume should generally decline as the pattern develops and spike on the breakdown. This is the classic triangle volume signature.
Volume Profile
Declining volume during formation = compression. High volume on breakdown = release.
Volume Divergence
If volume starts increasing on tests of support rather than declining, the breakdown may be imminent.
Technical Confluence
Support Resistance
The horizontal support IS the pattern. A break below it converts this support to resistance for the retest trade.
Fibonacci Levels
The breakdown target often aligns with Fibonacci extension levels (1.0, 1.272, 1.618) of the pattern height.
Moving Averages
The descending trendline often aligns with the declining 20 or 50 EMA, adding dynamic resistance.
Rsi Confirmation
RSI making lower highs in line with the descending trendline confirms weakening momentum.
Macd Confirmation
MACD below zero with bearish crossovers at each lower high supports the bearish bias.
Bollinger Bands
Bollinger Bands squeeze during the compression phase and expand on the breakdown.
Vwap
Anchored VWAP from the pattern start often acts as resistance, confirming the bearish structure.
Ichimoku Cloud
Price below the cloud with the pattern forming adds strong bearish context.
Elliott Wave
The Descending Triangle often forms as Wave 4 before a Wave 5 decline, or as part of a larger corrective structure.
Wyckoff Phase
The pattern can represent the Sign of Weakness (SOW) and Last Point of Supply (LPSY) phases before the markdown.
Market Profile
The horizontal support corresponds to a high-volume node where buyers defend. The breakdown is the migration of value below this node.
Order Flow
Watch for large passive buy orders at support being progressively consumed by aggressive selling.
Open Interest
Rising OI during the pattern with a spike at breakdown confirms new short positions.
Multi-Timeframe Analysis
Higher Timeframe Alignment
A daily Descending Triangle within a weekly downtrend is very high conviction for a downside breakdown.
Lower Timeframe Entry
After the daily breakdown, use the 4H or 1H chart to find re-entry points on retests of the broken support.
Timeframe Confluence
A weekly Descending Triangle is a major pattern that can lead to months of decline.
Top-Down Approach
Weekly: downtrend context. Daily: identify the Descending Triangle. 4H: trade the breakdown and retest.
Statistics
Historical Examples
Meta (META) Descending Triangle 2022
successMETA formed a textbook descending triangle with support at $155 and lower highs from $195 to $175 to $165. The breakdown below $155 led to a decline to $90 — approximately the full pattern height projected from the breakdown.
Lesson: The measured move target (pattern height below breakdown) was achieved almost exactly. Volume confirmed the breakdown with a significant spike.
Variations
Descending Triangle with False Breakout
Price briefly breaks above the descending trendline before reversing sharply and breaking down below support.
Wide Descending Triangle
The pattern height is very large (>15%), creating wide swings within the triangle.
Confusion Matrix
Patterns commonly confused with Bearish Descending Triangle and how to distinguish them.
Bearish Descending Channel
5500% similarCheck the lower boundary. If it is flat/horizontal, it is a Triangle. If it slopes downward, it is a Channel.
Key Differences
- Descending Channel has both lines sloping down (parallel)
- Descending Triangle has one flat line and one declining line
- The flat support in the Triangle creates a clear trigger level
Neutral Symmetrical Triangle
5000% similarCheck the lower boundary. If it slopes upward, it is a Symmetrical Triangle. If it is flat, it is a Descending Triangle.
Key Differences
- Symmetrical Triangle has both lines converging (one declining, one rising)
- Descending Triangle has a flat bottom
- Symmetrical is neutral; Descending has bearish bias
The Descending Channel is a chart formation where price trends lower within two parallel downward-sloping trendlines, making consistent lower highs and lower lows in an orderly bearish progression.
The Bearish Engulfing is one of the most powerful and commonly traded two-candle reversal patterns. A large bearish candle completely engulfs the prior bullish candle, demonstrating a decisive shift from buying to selling dominance.
The bearish flag is a continuation pattern consisting of a sharp decline (flagpole) followed by a gentle upward-sloping consolidation (flag) before price breaks down to continue the trend.
Three black crows is a powerful bearish reversal pattern consisting of three consecutive long bearish candles, each opening within the prior candle's body and closing near its low. It signals strong, persistent selling pressure and a likely trend reversal.
The Bullish Ascending Triangle is a continuation pattern featuring flat resistance and rising support. Buyers are consistently willing to pay higher prices, compressing the range until a breakout above resistance triggers the next leg up.
The Symmetrical Triangle is a chart formation where converging trendlines of roughly equal slope create a coiling pattern, indicating a period of equilibrium that will resolve with an explosive breakout in either direction.
Pro Tips & Common Mistakes
Pro Tips
- The measured move target (pattern height projected below the breakdown) is achieved approximately 70% of the time — use it as your primary target.
- Wait for the close below support rather than the intraday break. Many intraday breaks recover by the close (false breakdowns).
- The pattern is most reliable when it forms as a continuation of an existing downtrend, rather than as a top reversal pattern.
- Count the number of support tests. More tests weaken the support and increase the probability of a breakdown.
- Volume declining during the formation is important — it shows decreasing interest and sets up the breakout volume spike.
Common Mistakes
- Buying at support thinking it will hold forever. Each test weakens the support — eventually it will break.
- Entering the short before the breakdown is confirmed with volume.
- Ignoring the 30% chance of an upside breakout. Always have a stop loss above the pattern.
- Drawing the triangle too loosely — the support must be truly horizontal and the lower highs must be clear.
Advanced Techniques
- Use the pattern to estimate the timing of the breakdown. As the triangle converges toward the apex, the breakout typically occurs in the 2/3 to 3/4 zone of the triangle's length.
- Buy put options during the compression phase when implied volatility is low (the squeeze deflates IV). The breakdown will cause an IV expansion that benefits long puts.
- Monitor the bid depth at the support level. When the passive buying starts thinning, the breakdown is near.
Institutional Perspective
Institutions often accumulate short positions throughout the Descending Triangle formation. They sell on each rally to the descending trendline and may place large market sell orders below support to trigger the breakdown and the cascade of retail stop losses.
Fun Facts
- Thomas Bulkowski's statistical analysis of thousands of Descending Triangles found that the average decline after breakdown is 16%, making it one of the most profitable chart patterns to trade.
- The Descending Triangle is one of only three triangle patterns (ascending, descending, symmetrical), and it is considered the most reliable for directional bias.
- Algorithmic trading programs specifically scan for Descending Triangles, and their systematic selling at the descending trendline helps reinforce the pattern's formation.
Frequently Asked Questions
Measure the height of the triangle (from the horizontal support to the highest point of the pattern). Subtract this height from the breakdown level. This gives the measured move target, which is achieved approximately 70% of the time.
Yes, approximately 30% of Descending Triangles break to the upside. This is why confirmation is essential — wait for a close below support with volume before entering a short position.
At least two tests of the horizontal support and two lower highs on the descending line. More touches increase the pattern's reliability but also weaken the support, making the breakdown more likely.