Overview
Bullish Flag
Also known as: Bull Flag, Flag Pattern, Measured Move Flag
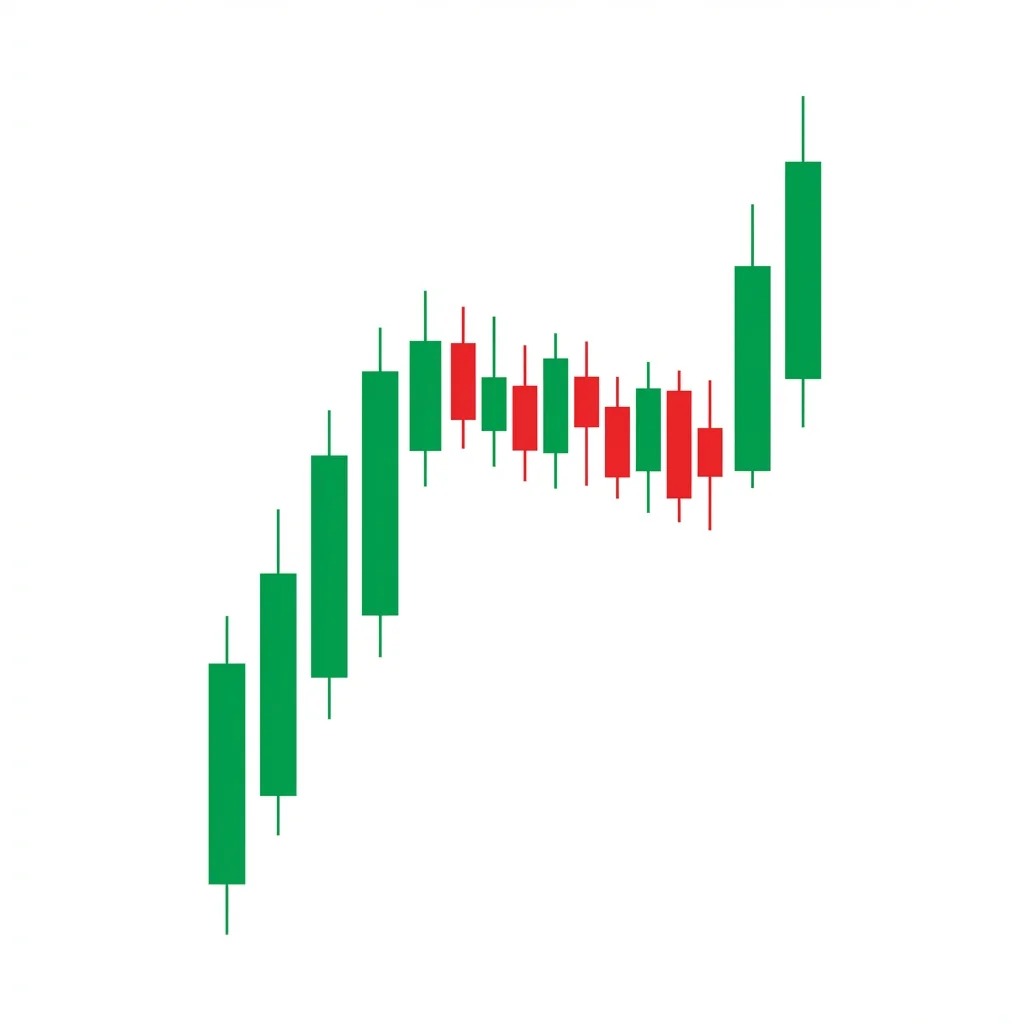
The Bullish Flag is the quintessential continuation pattern: a sharp rally (pole) followed by a brief, tight consolidation (flag) before the next leg up. It represents a healthy pause in a strong uptrend.
The Bull Flag is one of the most reliable and frequently traded continuation patterns. It forms after a sharp, high-volume rally (the pole) when price pauses to consolidate in a small, tight channel that drifts slightly lower (the flag). This consolidation represents profit-taking and a natural pause in momentum, not a reversal. Volume contracts during the flag as sellers run out, and expands on the breakout as the uptrend resumes. The measured move target is the length of the pole projected above the breakout point. Flags are popular among momentum traders and swing traders because they offer clear entries, stops, and targets.
History & Etymology
The flag pattern has been recognized since the earliest days of chart analysis. Edwards and Magee described it extensively, noting that flags are among the most reliable continuation patterns when they form after strong moves. The pattern remains a staple of both discretionary and systematic trading strategies.
The pattern looks like a flag on a flagpole. The sharp rally is the pole, and the small consolidation rectangle fluttering at the top is the flag.
How It Forms
Formation Steps
- 1Pole: a sharp, steep rally on high volume (the flagpole)
- 2Flag: a small rectangular or parallelogram consolidation drifting slightly downward on decreasing volume
- 3Breakout: price breaks above the flag upper boundary continuing the prior trend
Prerequisites
- A steep, sharp rally forming the pole (at least 5-10% in stocks)
- The flag should drift lower or sideways in a tight channel
- Volume should contract during the flag phase
Confirmation Signals
- Close above the flag upper boundary on volume
- Volume expands on the breakout to match or exceed the pole volume
- Measured move equal to the pole length unfolds from the breakout
Invalidation Signals
- Flag retraces more than 50% of the pole
- Volume increases during the flag (distribution)
- Price breaks below the flag lower boundary
Candle Breakdown
Flagpole
A series of strong bullish candles creating the sharp rally.
Strong momentum drives a vertical or near-vertical advance. Buyers are highly aggressive, creating the pole.
Flag Consolidation
Small candles in a tight, slightly downward-drifting range.
Profit-takers and short-term traders sell, but no sustained selling pressure develops. The tight range shows underlying strength.
Breakout
Price breaks above the flag on expanding volume, resuming the advance.
The pause is over. New buyers enter and profit-takers stop selling, creating the next leg of the advance.
Psychology
The flag represents a healthy consolidation within a strong trend. Momentum pauses briefly for profit-taking, but the underlying demand is so strong that the correction is minimal and the trend resumes.
Buyer Perspective
Buyers who missed the pole see the flag as their entry opportunity. The tight consolidation confirms the trend is intact and provides a clear risk level.
Seller Perspective
Sellers are only profit-takers, not new shorts. Their light selling creates the flag but cannot reverse the trend.
Smart Money Action
Institutions use the flag consolidation to add to positions established during the pole. Their buying during the flag prevents any significant retracement.
Retail Trader Trap
Retail traders who short the flag thinking the move is overextended are squeezed on the breakout.
Emotional Cycle
Trading Strategy
Aggressive Entry
Enter within the flag near the lower boundary with a tight stop below.
Conservative Entry
Wait for a close above the flag upper boundary on above-average volume.
Pole length projected above the breakout (measured move).
1.5x the pole length.
2x the pole length in strong trends.
Best Conditions
- Timeframe: 15m
- Timeframe: 1h
- Timeframe: 4h
- Timeframe: daily
- Strong trending markets
- Breakout environments
- Momentum-driven markets
- Asset: stocks
- Asset: futures
- Asset: crypto
- Asset: forex
Avoid When
- Timeframe: 1m
- Choppy, trendless markets
- Bear markets where rallies are counter-trend
Confluence Factors
- Flag at a prior breakout level (support)
- Volume declining in the flag
- RSI pulling back to 50-60 range
- 10 or 20 EMA supporting the flag
- Sector showing strong momentum
Scale In Strategy
Enter 50% within the flag, add 50% on the breakout.
Scale Out Strategy
Take 33% at 1x pole, 33% at 1.5x pole, trail the rest.
Risk Management
Volume Analysis
Volume Confirmation
Volume must contract during the flag (selling drying up) and expand on the breakout (new buying entering).
Volume Profile
Declining volume through the flag is the most important confirmation signal.
Volume Divergence
Heavy volume during the flag suggests distribution, not consolidation.
Technical Confluence
Support Resistance
The flag itself acts as support. The measured move target often aligns with prior resistance levels.
Fibonacci Levels
The flag typically retraces 23.6-38.2% of the pole. Deeper retracements suggest a weaker flag.
Moving Averages
The 10 or 20 EMA often supports the lower flag boundary.
Rsi Confirmation
RSI should pull back from overbought (70+) toward 50-60 during the flag and re-accelerate on the breakout.
Macd Confirmation
MACD should remain positive during the flag and expand on the breakout.
Bollinger Bands
The flag often consolidates near the upper Bollinger Band, and the breakout pushes above it.
Vwap
Flag forming above VWAP confirms institutional support.
Ichimoku Cloud
Price above the cloud during the flag confirms the bullish context.
Elliott Wave
Flags often form as Wave 2 or Wave 4 corrections within an impulse sequence.
Wyckoff Phase
Flags represent brief pauses within the markup phase.
Market Profile
The flag creates a tight value area that gives way to range extension on the breakout.
Order Flow
Declining selling (negative delta) during the flag confirms profit-taking not distribution.
Open Interest
Stable open interest during the flag confirms positions are being held, not liquidated.
Multi-Timeframe Analysis
Higher Timeframe Alignment
A daily flag within a weekly uptrend is the optimal setup.
Lower Timeframe Entry
Use the 1-hour chart to see the breakout developing for precise entry.
Timeframe Confluence
A 4-hour flag within a daily uptrend provides excellent intraday swing trade entries.
Top-Down Approach
Weekly confirms uptrend, daily identifies the flag, 4-hour times the entry.
Statistics
Historical Examples
Tesla Bull Flag 2020
successTesla formed a textbook bull flag after a massive rally from $350 to $450 (pole). The flag consolidated between $420-$450 for two weeks on declining volume before breaking out on earnings, eventually reaching $500+.
Lesson: Bull flags in momentum stocks, especially ahead of catalysts like earnings, can produce moves that exceed the measured move target significantly.
Variations
High Tight Flag
The pole advances 100%+ and the flag retraces less than 20%.
Flat-Top Flag
The flag consolidation is horizontal rather than slightly downward.
Confusion Matrix
Patterns commonly confused with Bullish Flag and how to distinguish them.
Bullish Pennant
8000% similarLook at the consolidation boundaries. If parallel (rectangle), it is a flag. If converging (triangle), it is a pennant.
Key Differences
- Flags have parallel or near-parallel boundaries
- Pennants have converging boundaries (triangle shape)
The bearish flag is a continuation pattern consisting of a sharp decline (flagpole) followed by a gentle upward-sloping consolidation (flag) before price breaks down to continue the trend.
The Bullish ABC Bounce is a simple but powerful continuation pattern where price makes a three-wave corrective pullback within an uptrend before resuming higher. It is one of the most fundamental and frequently occurring patterns in all of technical analysis.
The Bullish Ascending Triangle is a continuation pattern featuring flat resistance and rising support. Buyers are consistently willing to pay higher prices, compressing the range until a breakout above resistance triggers the next leg up.
The Bullish Engulfing is one of the most popular and reliable two-candle reversal patterns. A large bullish candle completely engulfs the prior bearish candle body, signaling a decisive shift from selling to buying control.
The Bullish Pennant is a continuation pattern featuring a sharp advance (flagpole) followed by a brief triangular consolidation (pennant), before price breaks out and continues higher with a measured move equal to the flagpole.
Three White Soldiers is one of the strongest bullish reversal patterns: three consecutive long bullish candles with progressively higher closes, each opening within the prior candle's body, signaling a powerful shift from bearish to bullish sentiment.
Pro Tips & Common Mistakes
Pro Tips
- The tighter the flag (less retracement), the more bullish the setup
- Volume contraction during the flag is the single most important validation criteria
- Flags that retrace more than 50% of the pole are weak and often fail
- The breakout volume should ideally match or exceed the pole volume
- In the strongest trends, flags last only 3-5 candles before the breakout
Common Mistakes
- Identifying any pullback as a flag (flags specifically require a sharp pole)
- Trading flags without checking the volume pattern
- Accepting flags that retrace too much of the pole (50%+ = not a flag)
- Not calculating the measured move target before entering
- Confusing flags with channels (flags are brief consolidations, not extended channels)
Advanced Techniques
- Use the VCP concept within the flag to identify volatility contraction for the tightest entries
- Calculate the pole angle to filter for the strongest setups (steeper poles = stronger patterns)
- Combine with relative strength analysis to find flags in market-leading stocks
Institutional Perspective
Bull flags are a primary pattern for momentum-based institutional strategies. The combination of a strong trend (pole) with a healthy consolidation (flag) represents the ideal setup for trend-following algorithms.
Fun Facts
- Bull flags are so common in strong uptrends that some traders build entire strategies around this single pattern.
- The bull flag was one of Nicolas Darvas's primary patterns that helped him turn $25,000 into $2 million in the 1950s.
Frequently Asked Questions
Three key signs a flag will hold: (1) volume contracts during the flag, (2) the flag retraces less than 50% of the pole, and (3) the flag forms in a tight range without expanding volatility. If volume increases or the flag becomes too deep, it may not be a flag but a reversal.